SLA uptime and downtime calculator
Availability calculator - SLA & Downtime calculator
Availability, measured properly
Availability is the fraction of time a service is genuinely usable, not merely “the server responds to ping.” A checkout that loads but can’t process payments is down in every way that matters, which is why serious teams measure availability against user-facing transactions rather than infrastructure heartbeats.
This calculator converts any availability percentage into time allowances. Pair the output with an honest definition of “available” — HTTP checks with content assertions, or full browser flows — and your availability figure starts meaning what your customers think it means.
What is uptime?
Uptime is the amount of time that a service is available and operational, typically expressed in percentage.
What is SLA?
A service-level agreement (SLA) defines the level of service you expect from a vendor, laying out the metrics by which service is measured, as well as remedies or penalties should agreed-on service levels not be achieved.
How to prevent downtime?
Redundancy, monitoring and alerting are key to ensure a safe and reliable service.
Percentiles matter.
99.9% uptime equals to a period of downtime of 1 minute and 26 seconds per day.
99.99% uptime equals to a period of downtime of less than 9 seconds per day.
99.999% uptime equals to a period of downtime of less than 1 second per day.
SLA calculation cheatsheet
Availability (%) = (Total Time - Downtime) / Total Time × 100Example: If a service was down for 7.3 hours in a 30-day month:
- Total Time = 30 days × 24 hours = 720 hours
- Availability = (720 - 7.3) / 720 × 100 = 98.99%
→99.9% ("three nines"): 8.76 hours downtime/year (43.8 minutes/month)
→99.95%: 4.38 hours downtime/year (21.9 minutes/month)
→99.99% ("four nines"): 52.56 minutes downtime/year (4.38 minutes/month)
→99.999% ("five nines"): 5.26 minutes downtime/year (26.3 seconds/month)
Response Time Compliance (%) = (Responses Within Threshold / Total Responses) × 100→MTBF (Mean Time Between Failures) = Total Operational Time / Number of Failures
→MTTR (Mean Time To Repair) = Total Repair Time / Number of Repairs
→MTTA (Mean Time To Acknowledge) = Total Time to Acknowledge / Number of Incidents
Service Credit = (Monthly Service Fee) × (Credit Percentage for SLA Breach)- If availability drops below 99.9% but remains above 99.0%: 10% credit
- If availability drops below 99.0%: 25% credit
Track SLAs and downtime metrics at a glance
Hyperping's reporting dashboard brings all your critical monitoring metrics into one powerful command center, giving you complete visibility into your system's reliability.
With the unified monitor overview, you can instantly see how all your monitors are performing without jumping between different screens or reports. This bird's-eye view helps you spot patterns and problems immediately.
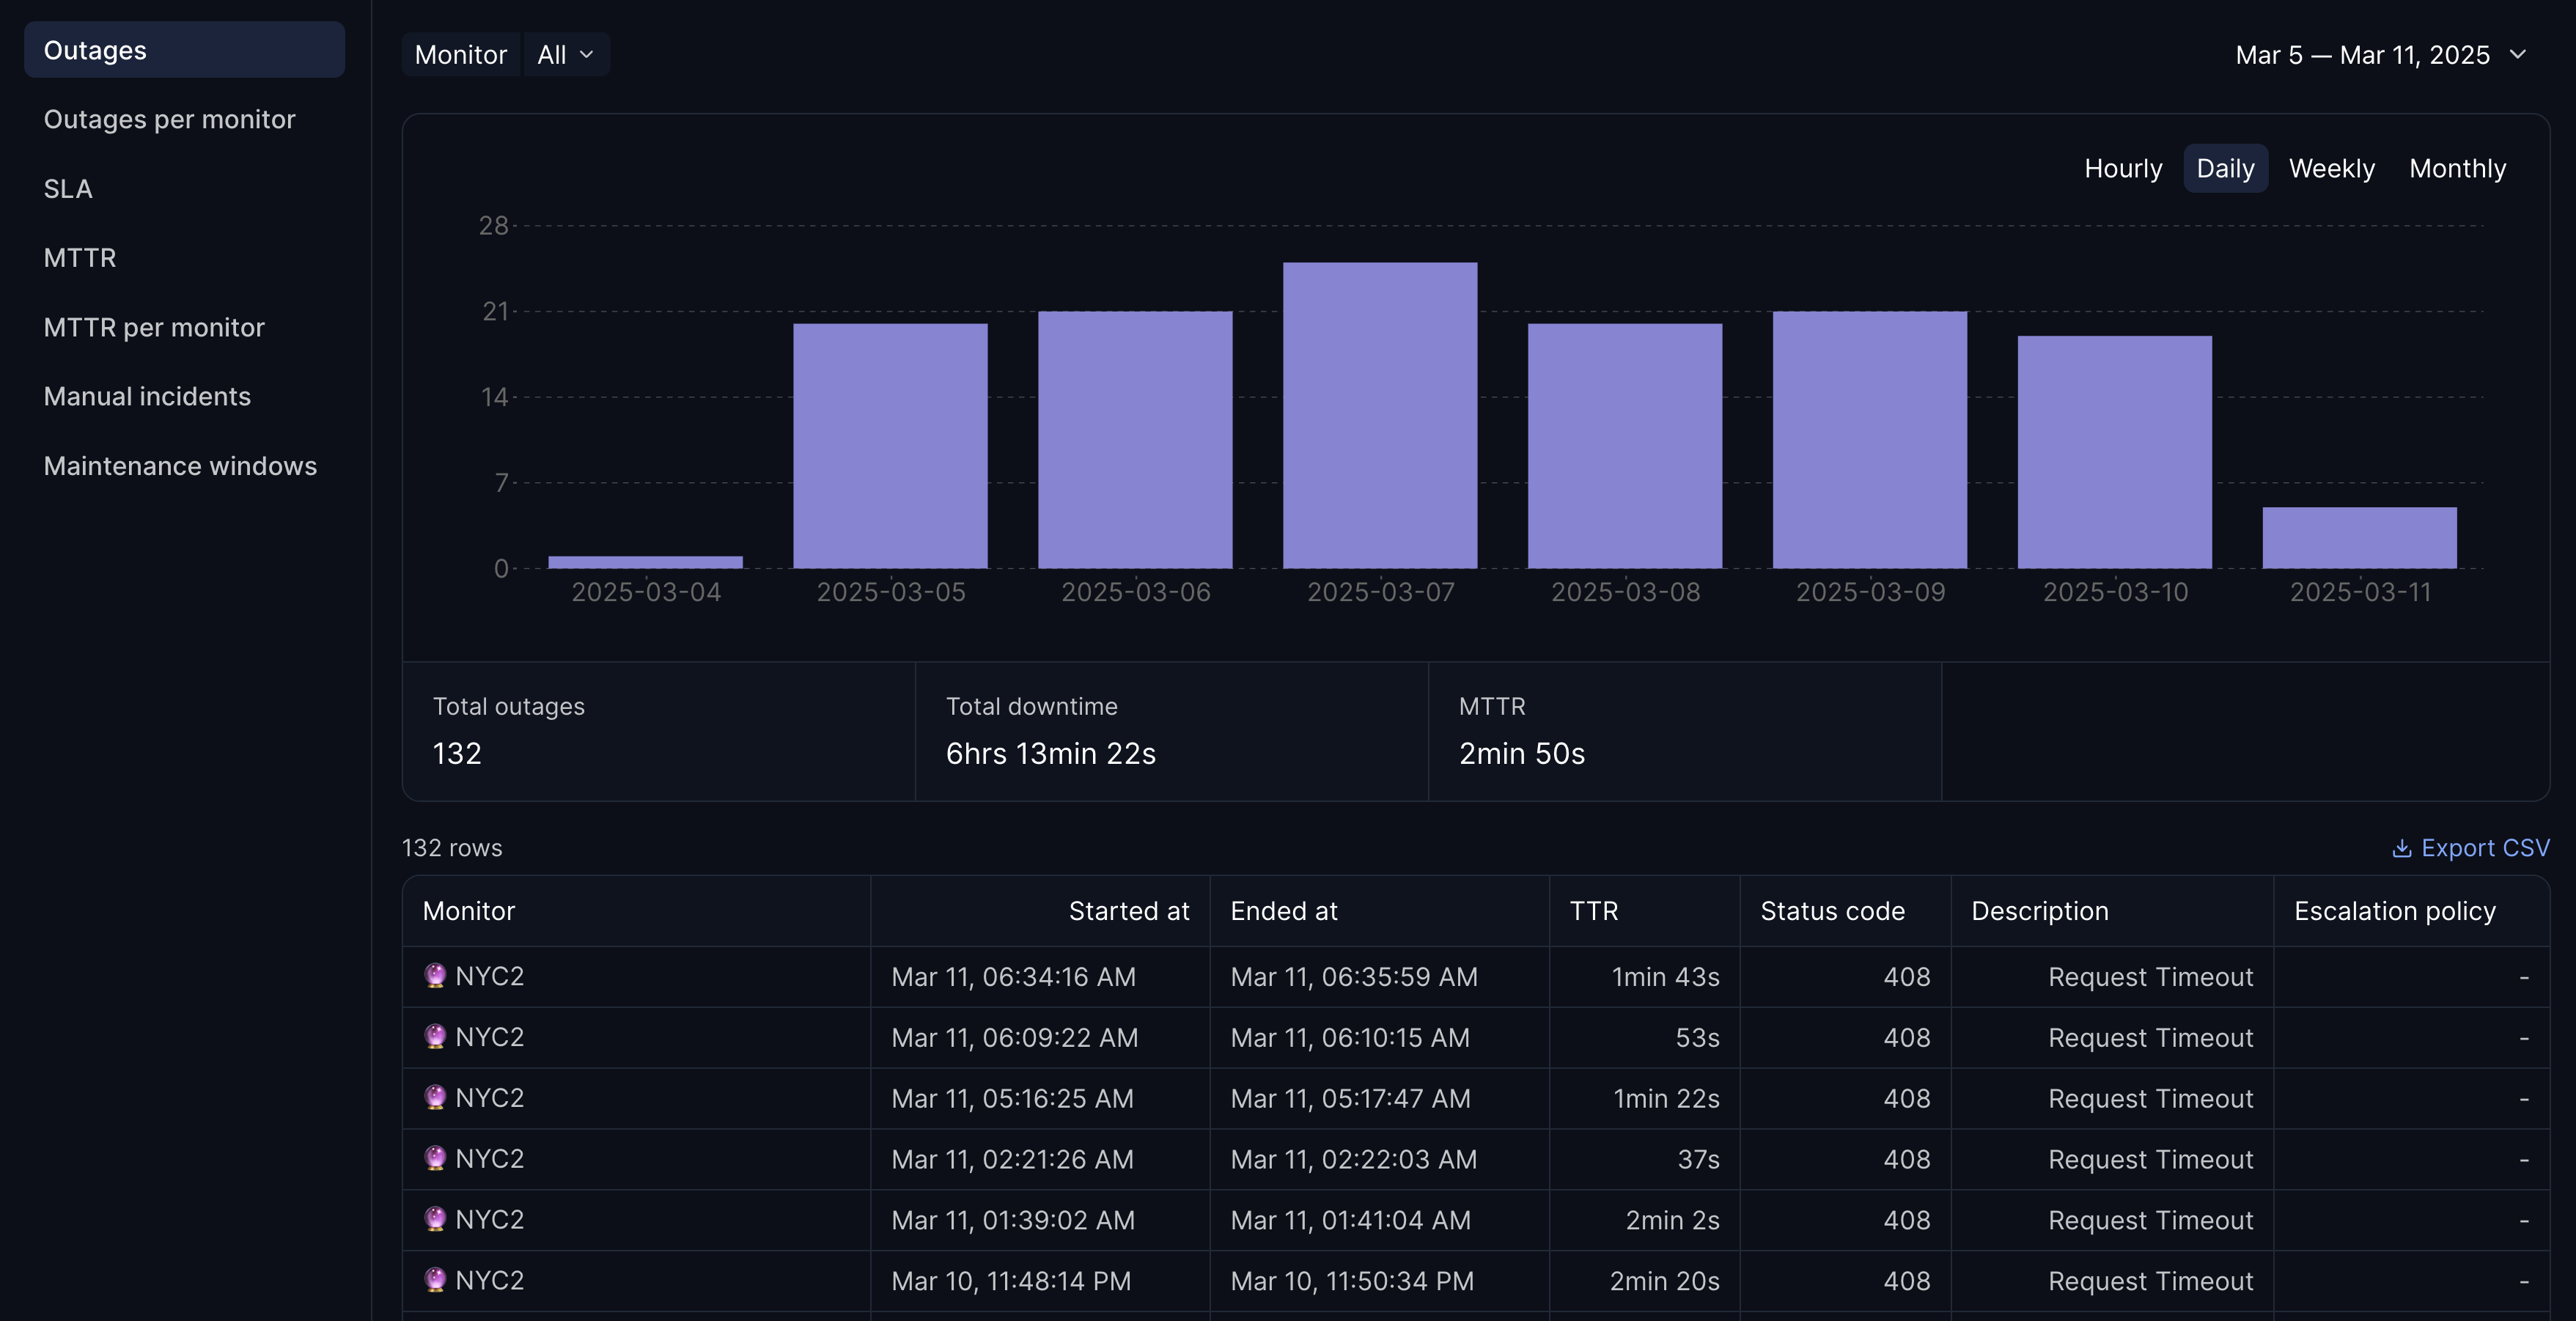
Need to prove your reliability to stakeholders? The SLA tracking feature gives you clear, easy-to-read statistics on your service level agreements. No more scrambling to compile numbers for quarterly reviews.
The dashboard also includes detailed MTTR analytics, helping you measure and improve your Mean Time to Recovery. By understanding how quickly you're resolving incidents, you can identify bottlenecks in your response processes.
Want to analyze past performance? Browse through your complete incident timeline with powerful filtering options in the comprehensive outage history section. And when you need to share this data with others, simply download your metrics in CSV format for custom analysis and reporting.
The powerful filtering and analysis tools let you track trends with intuitive visualizations and export filtered data for deeper analysis in your preferred tools.
SLA & uptime management guides
Incident Management in 2025: Best Practices, Tools Guide & More - In this guide, we'll walk through everything you need to know about incident management, from basic concepts to advanced strategies used by top DevOps teams.
Understanding SLAs, SLOs, and SLIs - SLAs, SLOs, and SLIs are crucial for managing tech services, ensuring reliability and trust. Learn how these elements work together to maintain service quality and user satisfaction.
MTTR guide: how to improve system reliability & response time - Meantime to repair (MTTR) directly impacts your customer trust and company reputation. This guide provides actionable steps to boost your system reliability and keep customers happy.
Frequently asked questions
Availability (%) = (Total Time − Downtime) / Total Time × 100. For example, a service that was down 7.3 hours in a 30-day month (720 hours) has an availability of (720 − 7.3) / 720 × 100 = 98.99%.
At 99.99% uptime, the maximum allowed downtime is 9 seconds per day, 4 minutes 19 seconds per 30-day month, and 52 minutes 34 seconds per 365-day year.
Each additional nine reduces allowed downtime tenfold: 99.9% allows about 8 hours 46 minutes of downtime per year, while 99.99% allows just under 53 minutes. Meeting 99.99% generally requires automated failover, since a human response rarely fits inside the budget.
Continuous uptime monitoring measures availability from outside your infrastructure and records every outage. Hyperping checks your endpoints at up to 30-second intervals from multiple regions and reports uptime, MTTR, and SLA compliance over any period.

Related Tools & Guides
See also: Two nines (99%), Three nines (99.9%), Four nines (99.99%), Five nines (99.999%), Six nines (99.9999%), Nine nines.
Calculators: SLA calculator, Uptime calculator, Downtime calculator, Availability calculator, Calculate availability, Uptime percentage calculator, Uptime downtime calculator.
SLA levels: 2 9s, 3 9s, 4 9s, 5 9s, 6 9s, 9 9s.
What does it mean: What does 2 9s mean?, What does 3 9s mean?, What does 4 9s mean?, What does 5 9s mean?, What does 6 9s mean?, What does 9 9s mean?.
Uptime implications: 99.95% uptime implications, 99.9999% uptime implications, 99.99999% uptime implications.
Downtime: 99.95% SLA downtime, 99.999% SLA downtime, How much downtime is 99.9%, How much downtime is 99.99%, How much downtime is 99.999%, Maximum acceptable downtime.
SLA time: SLA time, Daily uptime calculation, Monthly uptime calculation, Annual uptime calculation, Minimum uptime requirement.
Cost calculators: Downtime cost calculator. Templates: Incident post-mortem generator.