We're excited to launch our new Reporting Dashboard, giving you a powerful command center to analyze your monitoring data and make data-driven reliability decisions.
Your Monitoring Data, All in One Place
The new reporting dashboard brings together all your critical metrics:
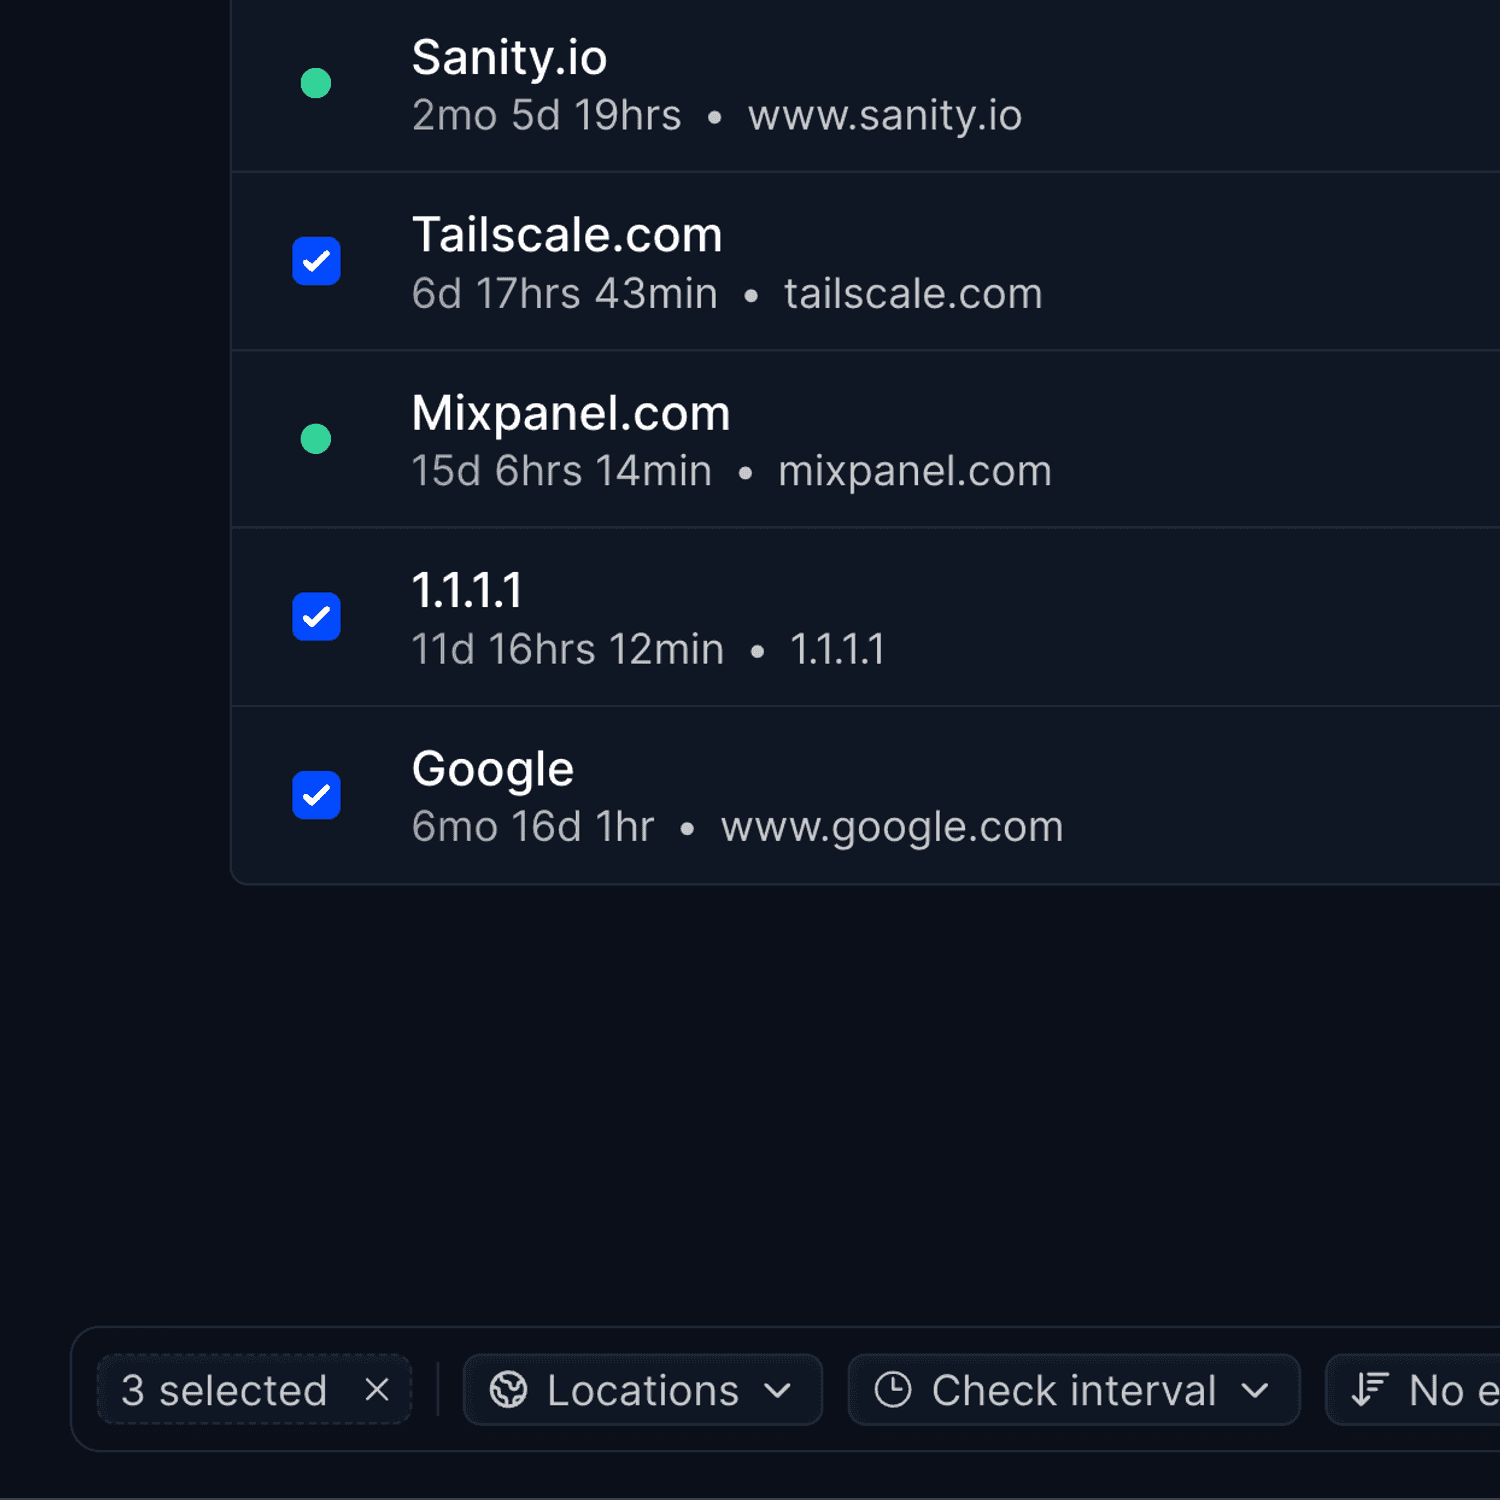
- Unified Monitor Overview: See all your monitors' performance in a single, intuitive view
- SLA Tracking: Track your service level agreements with clear, easy-to-read statistics
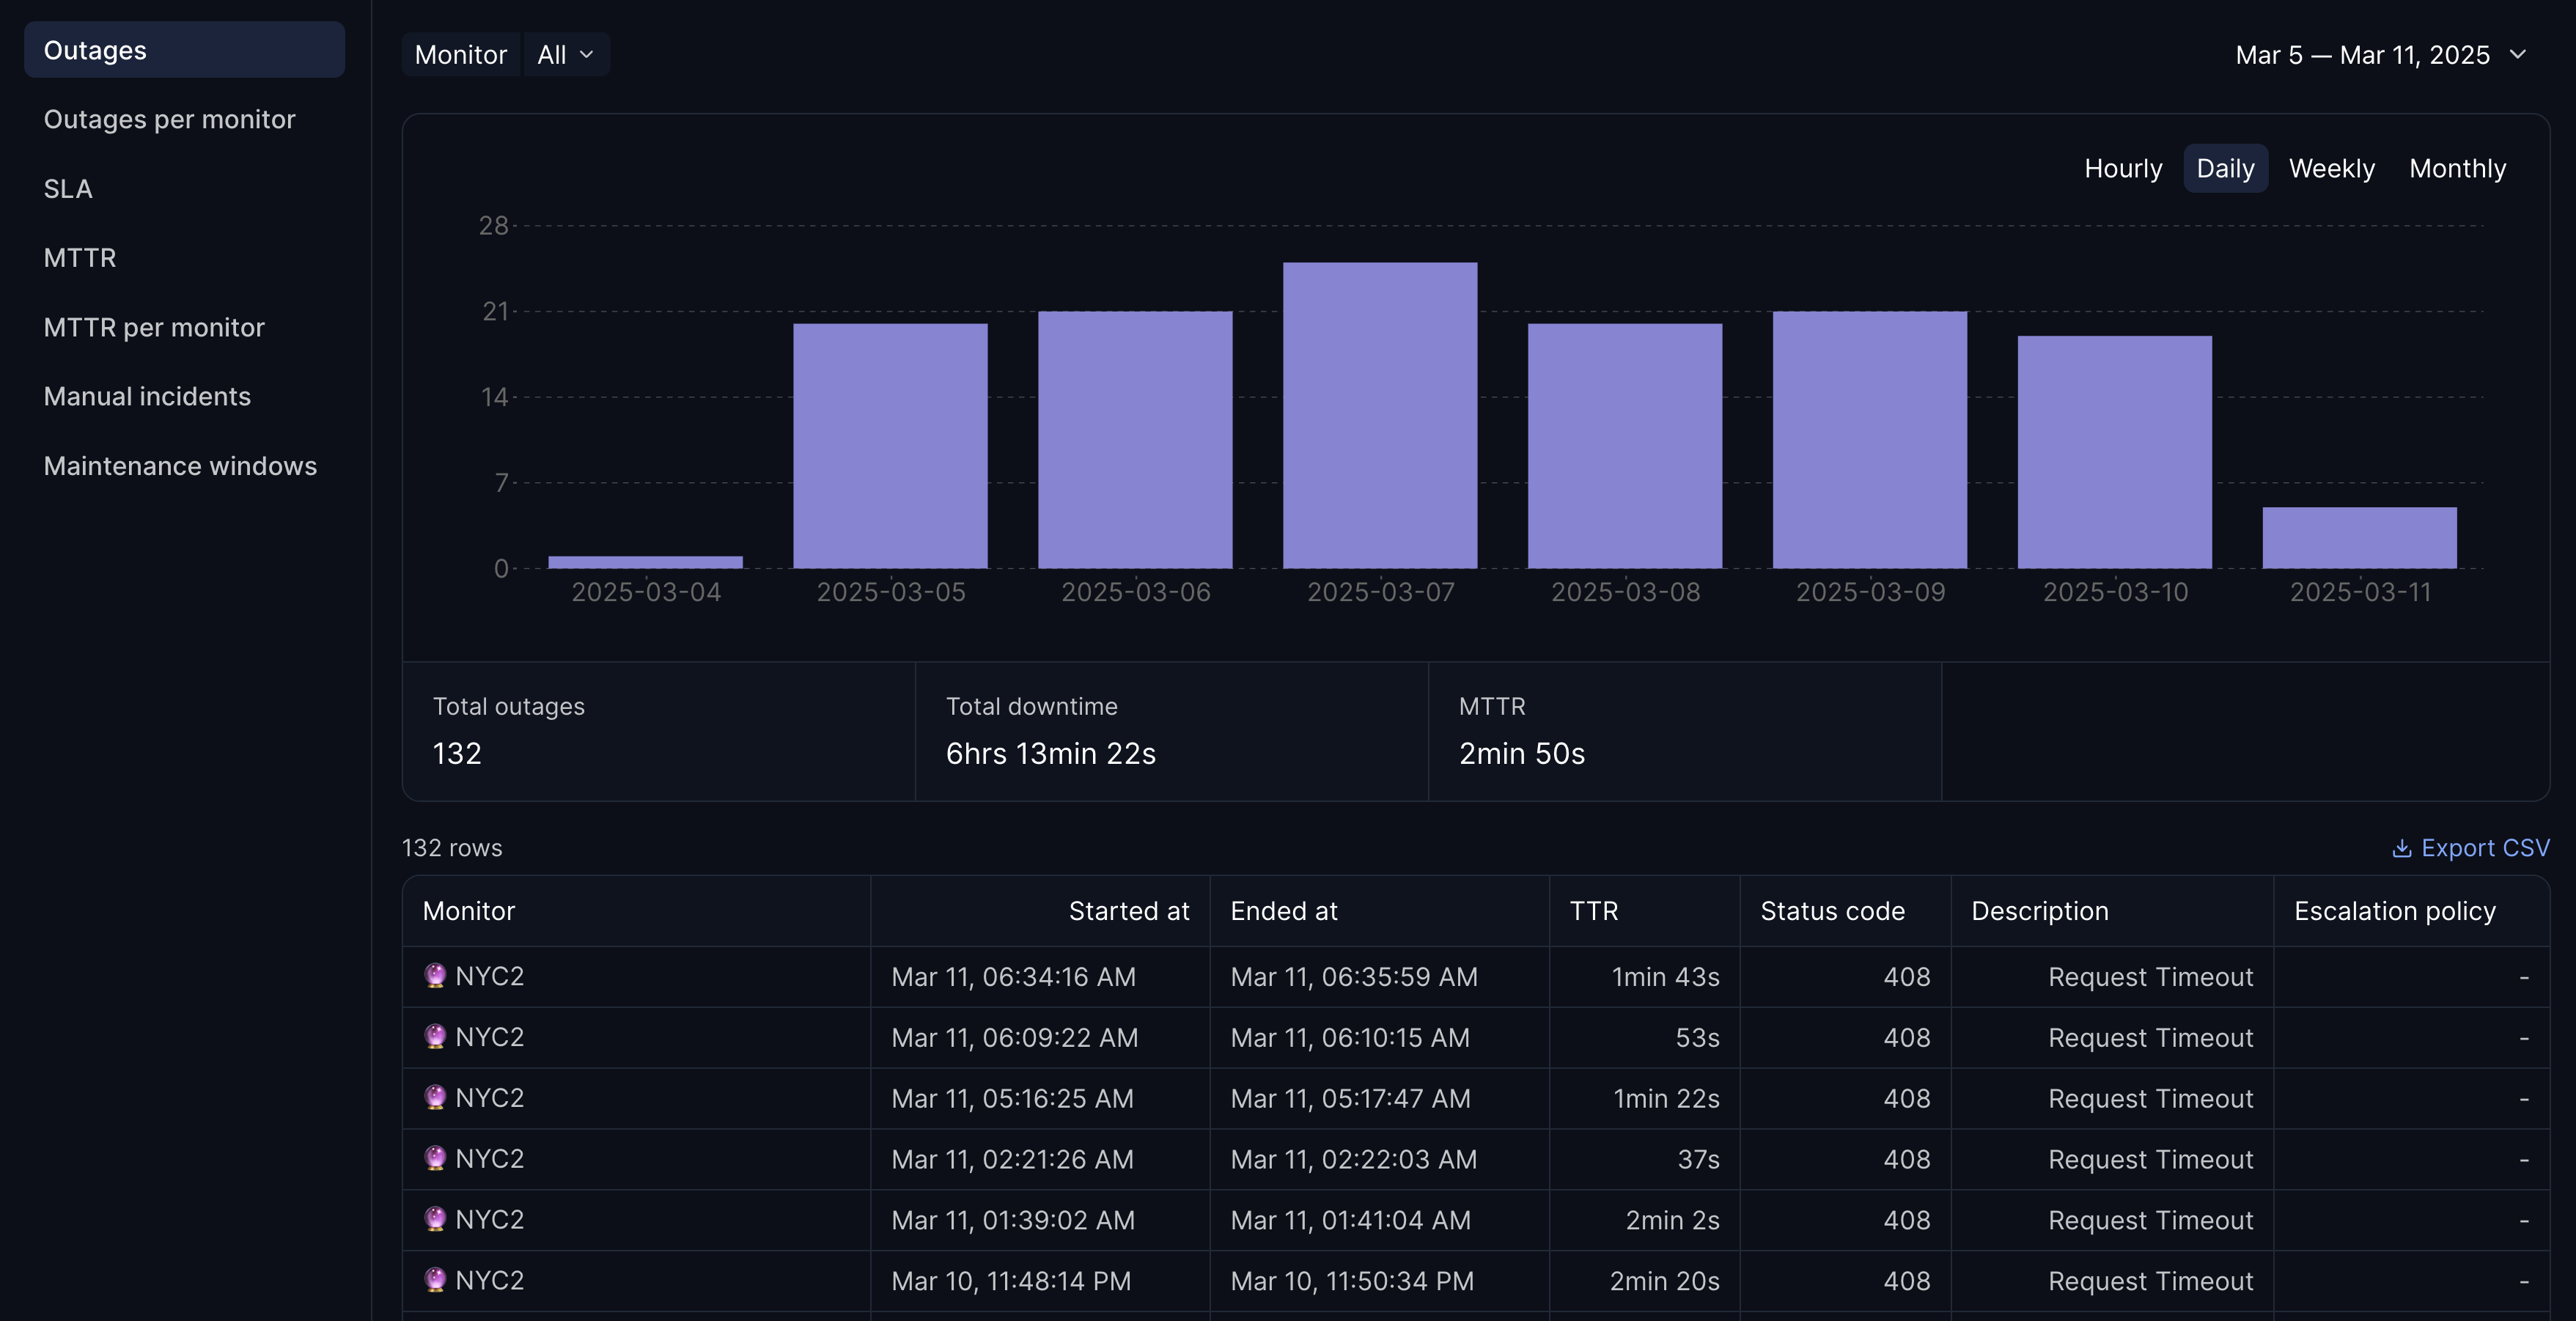
- MTTR Analytics: Measure and improve your Mean Time to Recovery with detailed insights
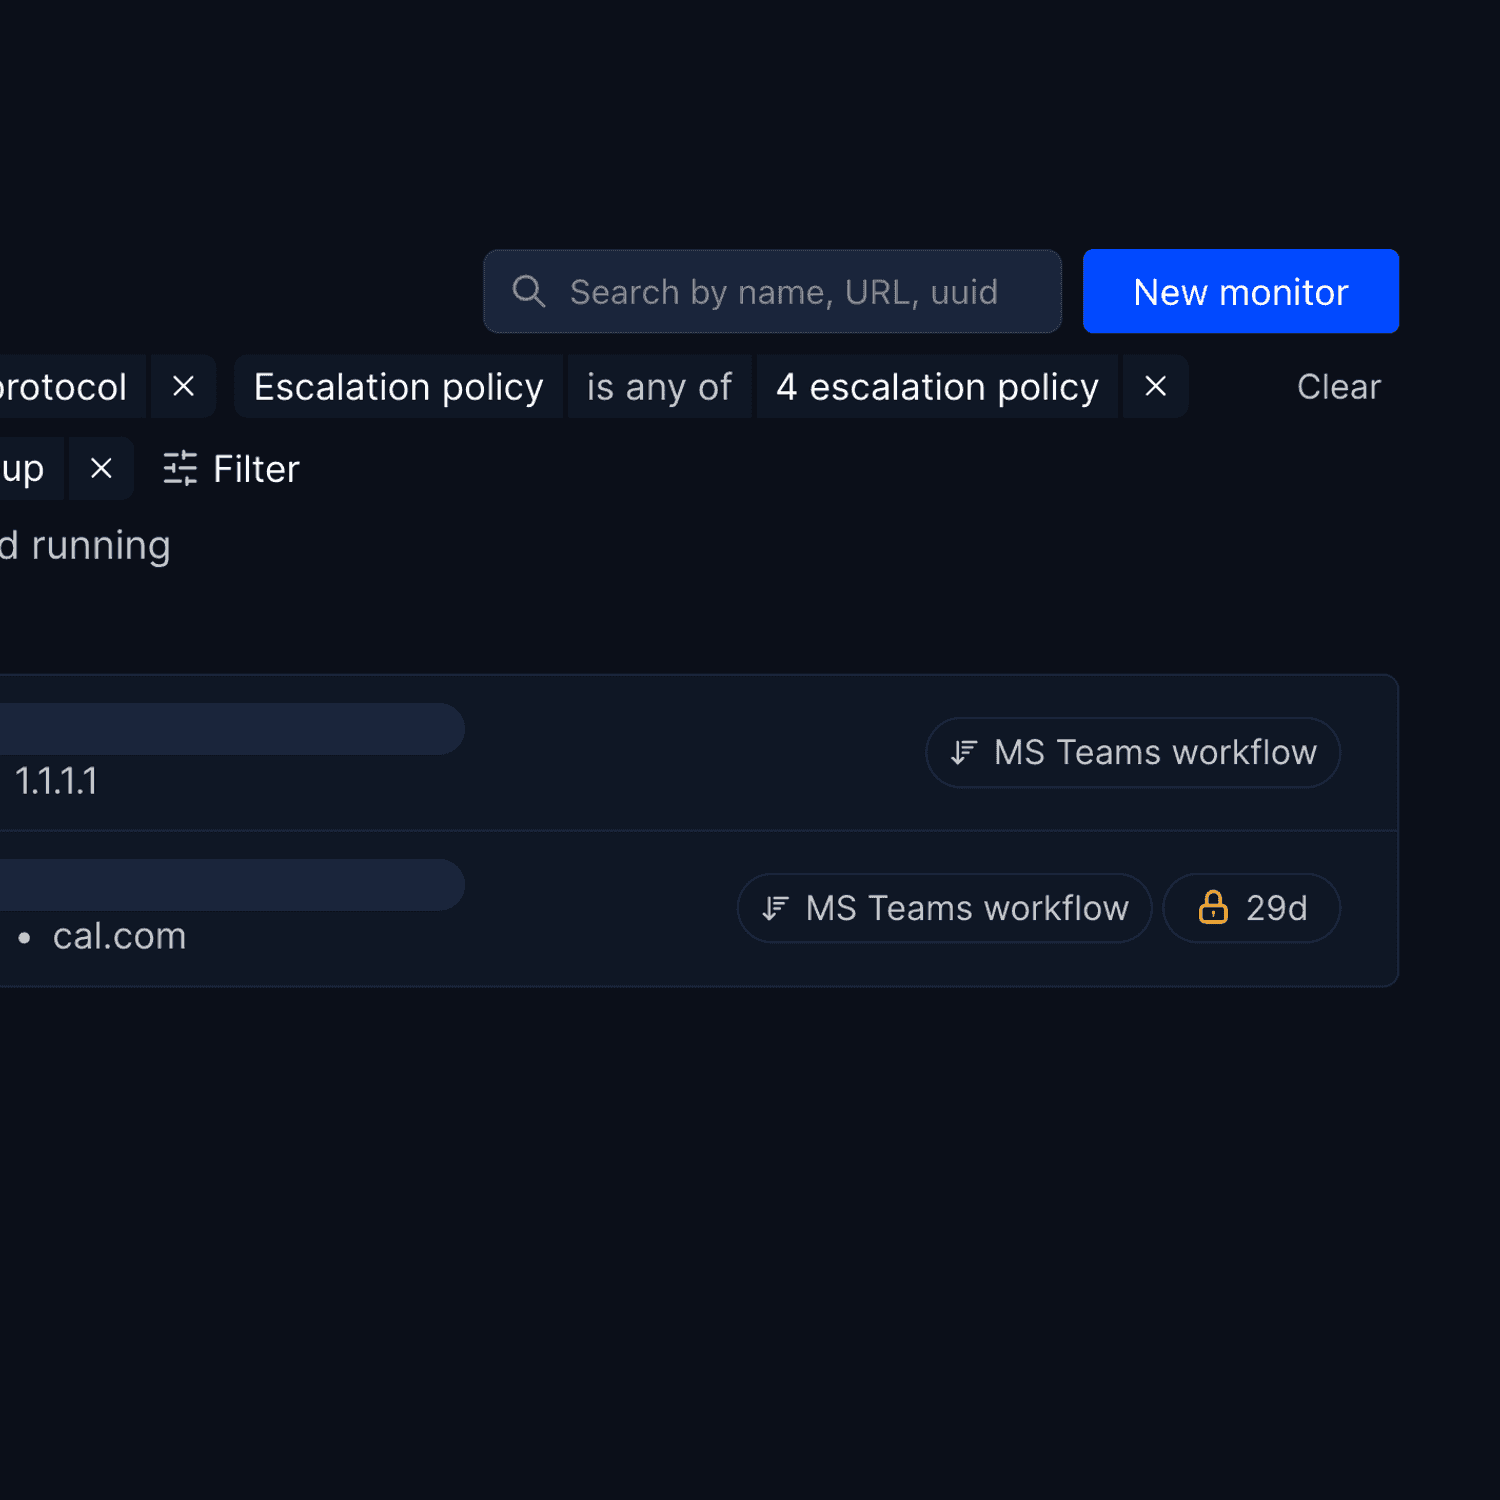
- Comprehensive Outage History: Browse through your complete incident timeline with powerful filtering options
- Data Export: Download your metrics in CSV format for custom analysis and reporting
The dashboard automatically aggregates data across your monitors, giving you both high-level insights and the ability to drill down into specific incidents or timeframes.
Powerful Filtering & Analysis
- Track trends with intuitive visualizations
- Export filtered data for deeper analysis
Access the dashboard at https://app.hyperping.io/reporting/outages or via the Reporting item in the left sidebar.
This is just the beginning - we'll be adding more powerful analytics features to help you make the most of your monitoring data.
Article by
Léo Baecker
I'm Léo Baecker, the heart and soul behind Hyperping, steering our ship through the dynamic seas of the monitoring industry.

Related Articles
MTTR, MTBF, MTTA & MTTF — Metrics, examples, challenges, and tips
Learn how to calculate and reduce MTTR with proven strategies. Includes industry benchmarks, real-world examples, and a ...
Incident Response Automation Guide: Cut MTTR by 33% in 2026
Incident response automation reduces detection time by 33% and saves $3M per breach. Covers AI-powered detection and aut...
Top 5 Statuspage Alternatives (2026 Guide)
Compared 30+ status page tools on pricing, features, and uptime. These are the 5 best Statuspage.io replacements for any...
Healthchecks and Cron Jobs on Status Pages
You can now add healthcheck and cron job monitors to your status pages alongside your HTTP monitors.