As your customer base grows, your responsibility to provide a functioning service at all times increases too. Let's explore how you can add a few lines of code to your Ruby on Rails application and gain significant peace of mind!
Why would we need a health check endpoint?
Creating a health check endpoint is remarkably simple and doesn't require extensive technical expertise. By monitoring this endpoint, you can receive timely alerts when your API or application encounters issues.
Key reasons for implementing a health check endpoint include:
- SLA (Service Level Agreement) — You're often obligated to maintain a specific uptime percentage as outlined in your SLA.
- Financial Impact — Downtime can translate to substantial financial losses, especially in certain industries where even a minute of outage can be costly. Consider the potential revenue and business impact of downtime lasting minutes, hours, or even an entire day.
- Reputation Management — Frequent downtime incidents can severely damage your business's reputation and erode customer trust.
In this guide, we'll demonstrate how to create a health check route for your Rails application. This route can be monitored by an uptime monitoring service like Hyperping, ensuring you're promptly notified of any application downtime.
Code
Open your config/routes.rb file and add the following line within the routes.draw do block:
This line defines a route that maps GET requests to the /health endpoint to the index action of a HealthController.
Now, create a new controller called health_controller.rb in the app/controllers directory with the following content:
This controller action simply returns a 200 status code with an "Ok" message in the response body.
Let's enhance this further by providing some additional information:
In this updated version, we're including the application's uptime, a simple "Ok" message, and the current timestamp in the response. Rails.application.config.start_time is a variable that you can define in config/application.rb to store when the application started.
You can further expand this health check to include connectivity checks for your database, Redis server, or any other critical services your application relies on. For microservices architectures, ensure each service has its own dedicated health check endpoint.
Automate the checks
With your new health check endpoint in place, you can now proactively monitor your application's status and receive timely alerts when issues arise. To effectively track uptime, response time, and receive prompt notifications of any failures, consider using a dedicated uptime monitoring service like Hyperping. Create an account, and you'll be guided through the process of setting up your first monitor.
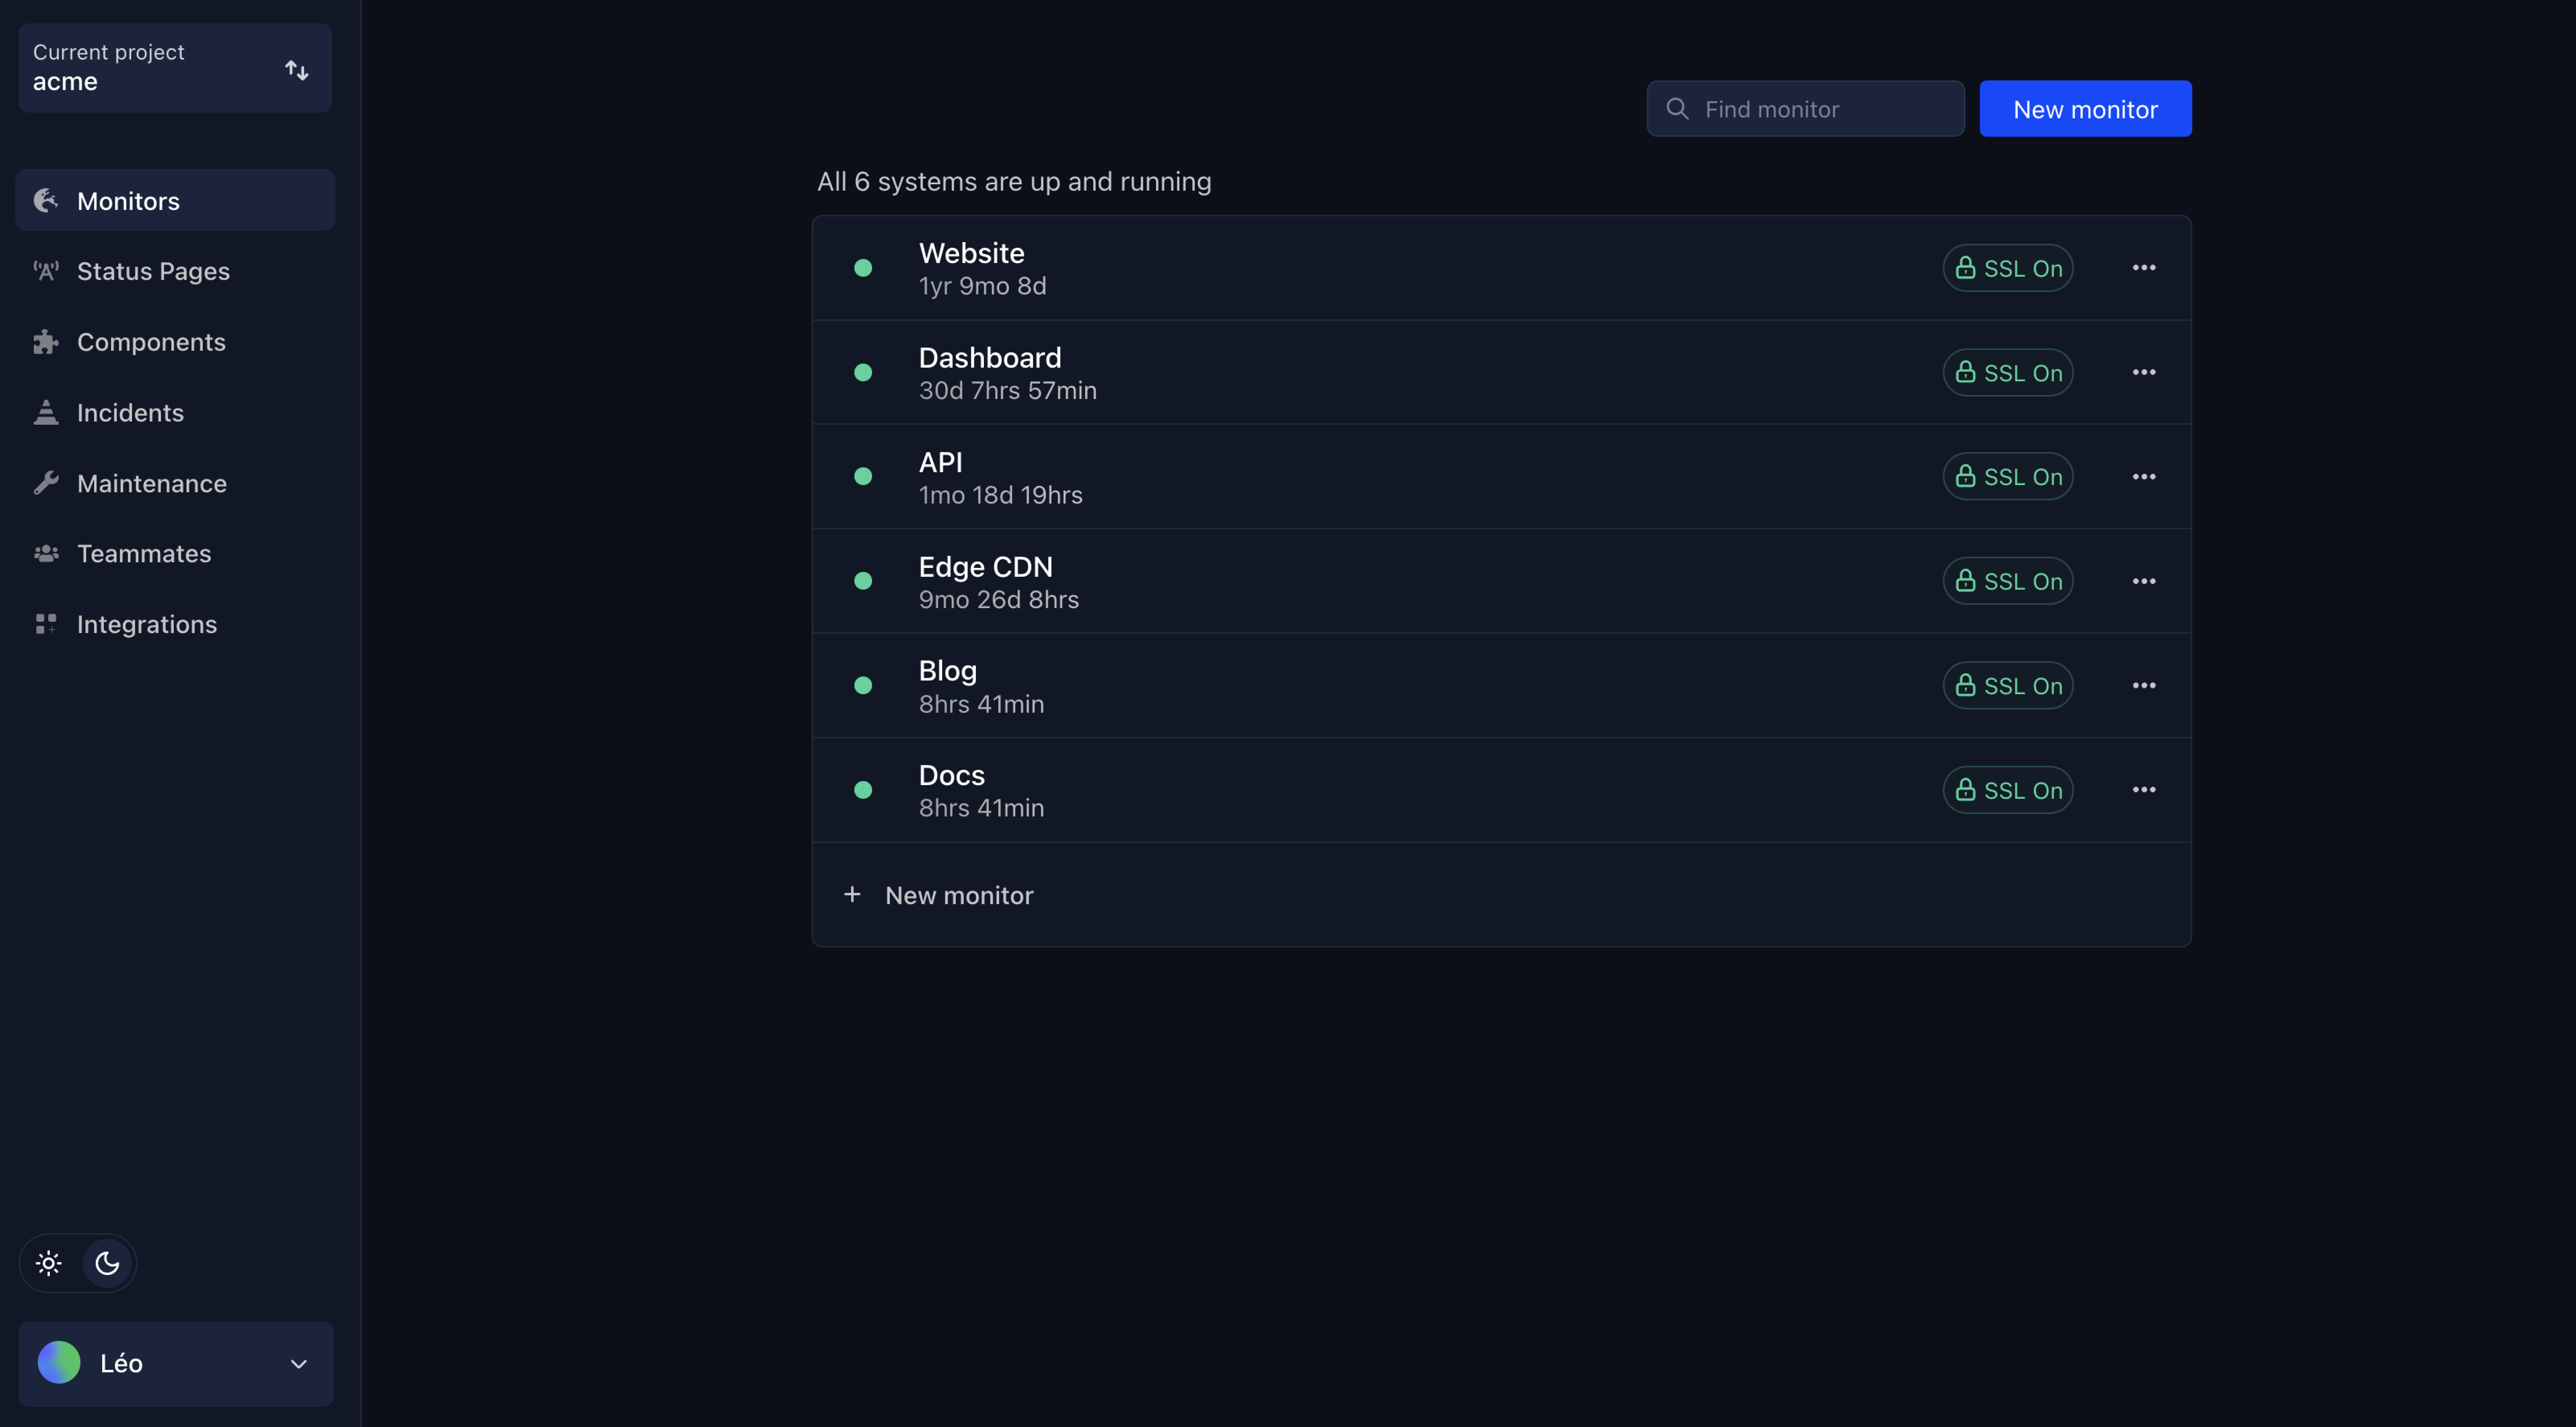
By simply adding your new health check endpoint to Hyperping, you can continuously monitor its availability without any complex configuration. After a few minutes, you'll gain valuable insights into your application's uptime and response time across various geographic regions (London, Amsterdam, Toronto, San Francisco, and more), along with historical data.
Furthermore, Hyperping seamlessly integrates with popular alerting tools like Slack, OpsGenie, and SMS, allowing you to notify your team instantly of any detected issues.
Conclusion
Setting up a health check endpoint in your Ruby on Rails application is a straightforward process that provides invaluable peace of mind. By proactively monitoring your application's health, you can ensure greater stability and reliability.
Start monitoring your Rails application with Hyperping and get 14 days of free monitoring to ensure your application stays healthy and available.