
The best cloud monitoring tools are Hyperping (uptime, server monitoring, status pages, and on-call at a flat rate), Datadog (full-stack observability with the broadest integration catalog), New Relic (usage-based observability with the most generous free tier), Dynatrace (AI-driven automatic root-cause analysis for large enterprises), Better Stack (monitoring paired with logs and incident response), and Prometheus + Grafana (the open-source standard for cloud-native metrics). I analyzed more than 20 tools and narrowed it to these six based on hundreds of G2, Capterra, and Reddit threads, product research, and conversations with DevOps and SRE teams.
Most teams shopping for cloud monitoring are escaping one of two situations. Either they have nothing beyond native cloud dashboards and keep finding out about outages from customers, or they bought a broad observability platform and watched the bill climb past their actual cloud spend. The category covers a wide range, from simple uptime checks to full metrics, logs, traces, and APM, so the right tool depends heavily on what you actually need to see and what you can afford to pay.
In this guide, you'll learn:
- What cloud monitoring covers (and where uptime, server monitoring, and observability differ)
- What engineers on Reddit and review sites actually complain about (cost surprises, tool sprawl, alert fatigue)
- Six tools that each solve a different slice of the problem
- Honest pricing comparisons with real numbers
- Where the native cloud provider tools fit
- How to match a tool to your team size, technical depth, and budget
If you want one tool that monitors uptime and servers, escalates through on-call rotations, and gives customers a branded status page when things break, Hyperping covers that surface area at a predictable price. Schedule a demo to see it in action.
Key takeaways
- Hyperping bundles uptime monitoring, server monitoring, status pages, and on-call into one flat-rate plan from $24/mo, with no per-host or per-user surprises.
- Datadog is the most complete observability platform, with 700+ integrations and unified metrics, logs, traces, and APM, but costs scale quickly and unpredictably.
- New Relic has the most generous free tier in the category (100 GB/month ingest plus one full user) and usage-based pricing with no per-host fees.
- Dynatrace leads on automation: its Davis AI engine does automatic root-cause analysis across the full stack, aimed at large enterprises.
- Better Stack combines uptime, heartbeat, log management, and incident response with a modern developer experience.
- Prometheus + Grafana is the open-source default for Kubernetes and cloud-native metrics, free to self-host if you can run the infrastructure.
Why you should trust this guide
I'm Léo, founder of Hyperping. Yes, that means I have a stake in one of these tools. Hyperping also sits at the lighter end of this list. It does uptime, server monitoring, status pages, and on-call well, and it is not a full observability platform with tracing and APM. I'm not going to pretend it competes with Datadog or Dynatrace on deep distributed tracing, because it doesn't, and that honesty is the point of this guide.
I analyzed hundreds of reviews on G2 and Capterra, read through Reddit threads in r/devops, r/sre, r/Observability, and r/Monitoring where engineers compare real production setups, tested platforms myself, and talked to teams about their monitoring stacks. Where I couldn't test something directly, I leaned on verified user feedback and documented sources.
What is cloud monitoring?
Cloud monitoring is the practice of tracking the health, performance, and availability of applications and infrastructure running in cloud or hybrid environments. In 2026 the term spans several layers that people often lump together:
- Uptime and availability monitoring: Is the website, API, or endpoint responding, from the regions where your users are? This is the outside-in view.
- Server and infrastructure monitoring: CPU, memory, disk, and network metrics from your hosts and containers.
- Application performance monitoring (APM) and tracing: Code-level visibility into requests as they move across services, used to find slow queries and bottlenecks.
- Log management: Collecting, searching, and correlating logs with the rest of your telemetry.
- Observability: The broad term for combining metrics, logs, and traces so you can ask new questions about your system, not just watch pre-built dashboards.
No single tool is the best at all five, despite what most vendor marketing implies. The practical question is which layers you need today, how much data you generate, and how much operational and financial overhead you can absorb.
Top picks at a glance
| Best for | Product |
|---|---|
| Uptime + server monitoring + status pages + on-call at a flat rate | Hyperping |
| Full-stack observability with the broadest integrations | Datadog |
| Usage-based observability with the best free tier | New Relic |
| AI-driven automatic root-cause for large enterprises | Dynatrace |
| Monitoring unified with logs and incident response | Better Stack |
| Open-source, cost-controlled metrics for cloud-native teams | Prometheus + Grafana |
What teams are actually looking for
Before getting into individual tools, it's worth grounding the comparison in what real users say they need. The recurring asks from Reddit threads in r/devops, r/sre, and r/Observability, plus G2 and Capterra reviews, fall into a tight set of themes.
Predictable, transparent costs
This is the single loudest complaint in the category. Observability bills frequently rival or exceed cloud infrastructure spend. In one r/sre thread on observability costs, a team reported roughly $97k/month across Datadog, Splunk, and Sentry against $52k of AWS. The drivers are per-host pricing that climbs with autoscaling, log ingestion volume, high-cardinality custom metrics, and long retention. A recurring r/Observability thread asks why vendors won't make pricing transparent. Engineers want pricing they can forecast, not a formula that surprises them at the end of the quarter.
One view instead of tab-switching
The "single pane of glass" is partly marketing, and most engineers know it. An r/Monitoring thread on whether one tool really covers everything lands on "no, but minimize the switching." That's the real ask: in r/Observability, engineers describe being tired of jumping between monitoring tools, where metrics in one tool, logs in another, and traces in a third means "by the time I line up the data, I've forgotten the question I was asking." Tools that correlate signals through shared trace IDs or OpenTelemetry reduce that pain.
Alerts with low noise
Too many low-context alerts in dynamic cloud and Kubernetes environments train people to ignore them. Static thresholds drift as services scale. Users want actionable, contextual alerts and the ability to tune them per service.
Fast setup and low maintenance
Commercial tools like Datadog get praised for "integrations are quick and easy" in r/devops threads weighing Datadog against AWS-native monitoring, while open-source stacks like Prometheus get respect for capability but warnings about ongoing work. Teams weigh time against money: buy speed, or build control.
Multi-cloud and hybrid flexibility
Monitoring needs to work across AWS, Azure, GCP, Kubernetes, containers, and sometimes legacy on-prem, without locking you in. Native tools handle their own cloud well but get dinged for weak multi-cloud support.
Quick comparison: cloud monitoring tools
| Tool | Starting Price | Best For | Main Limitation |
|---|---|---|---|
| Hyperping | $24/mo (50 monitors) | Uptime, server monitoring, status pages, on-call at a flat rate | Not a full observability platform (no APM/tracing) |
| Datadog | $15/host/mo + usage | Full-stack observability, broadest integrations | Costs scale fast and unpredictably |
| New Relic | Free; usage from ~$0.40/GB | Usage-based observability, best free tier | Full-user seats get expensive at scale |
| Dynatrace | Consumption-based, no free tier | Enterprise AI root-cause automation | Pricing and depth overwhelm small teams |
| Better Stack | Free; from ~$29/mo | Monitoring with logs and incidents | Modular pricing adds up |
| Prometheus + Grafana | Free (self-hosted) | Cloud-native metrics, cost control | Operational overhead and learning curve |
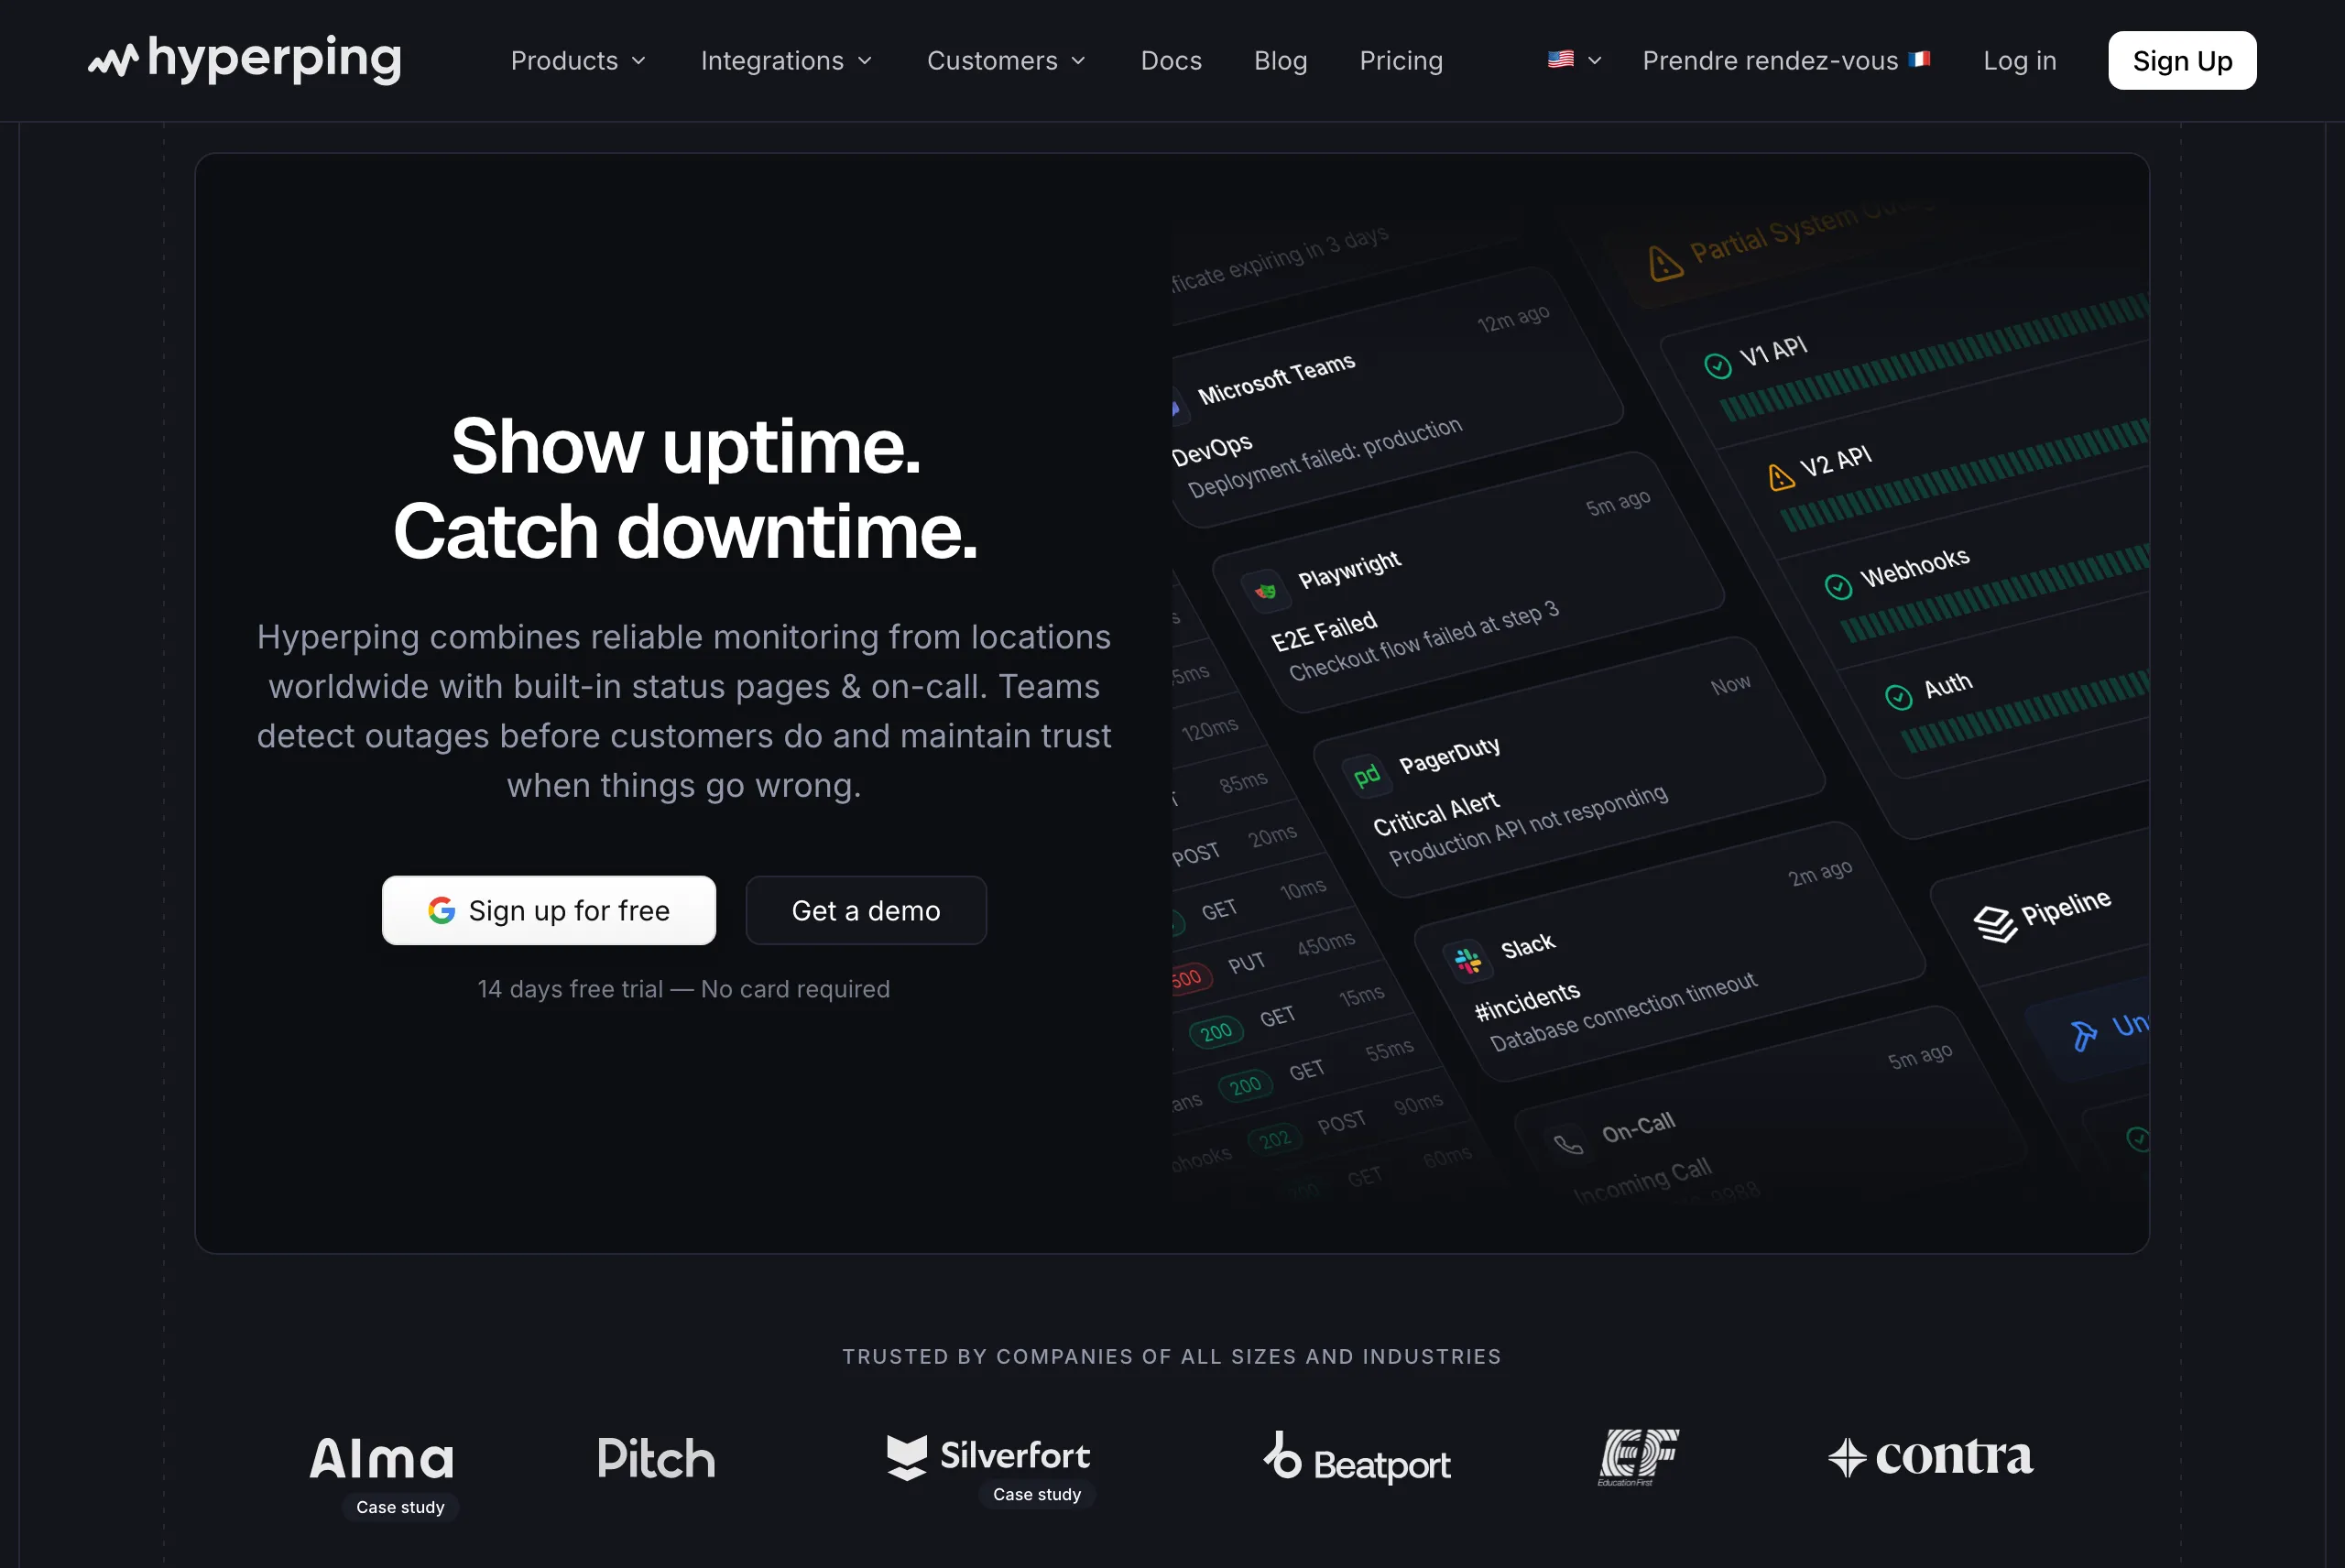
Hyperping: Best for uptime, server monitoring, status pages, and on-call at a flat rate
Who Hyperping is built for
Growing SaaS teams and SMBs that need to know their services are up from a customer's perspective, watch their server health, communicate incidents on a status page, and route alerts through an on-call rotation, all without paying for (or learning) a full observability suite. Hyperping focuses on doing the essentials well at a price you can predict.
From the reviews and conversations I analyzed, Hyperping resonates with teams that value simplicity and flat-rate pricing. It's popular with European companies because it's a French company with EU data hosting, and with teams that found broad observability platforms to be more cost and complexity than their stage warranted.
Notable features
- Multi-region uptime monitoring: HTTP, port, ping, keyword, SSL, and DNS checks from 18 regions, with 30-second intervals on paid plans and 20-second on Business.
- Server monitoring: Lightweight agents collect CPU, memory, disk, and network metrics, with threshold-based alerting. Plans include 5 to 100 agents, and additional agents are $2/mo or less.
- Status pages: Custom HTTPS domain, white-label branding, multi-language support, subscriber notifications, and private/protected pages. Included in plans rather than billed per page.
- On-call scheduling and escalation: Timezone-aware rotations, multi-step escalation, and phone call alerts on Pro and up. No separate PagerDuty subscription required.
- Browser checks: Playwright-based synthetic monitoring for login, checkout, and other multi-step flows.
- Healthchecks: Cron and heartbeat monitoring for scheduled jobs.
- European hosting: GDPR-compliant EU data centers, DIN ISO/IEC 27001 certified.
Why choose Hyperping for cloud monitoring?
One tool instead of three or four
A common stack is a uptime tool plus a status page tool plus an on-call tool plus a basic server metrics dashboard. Hyperping bundles those. For 100 monitors, a legacy stack of Pingdom plus Statuspage.io plus PagerDuty runs roughly $653/mo. Hyperping's Business plan covers the same ground at $249/mo.
Flat-rate, forecastable pricing
No per-host autoscaling penalties, no usage-based log ingestion bill, no per-seat fees until the Business tier. Given that unpredictable cost is the top complaint about cloud monitoring, this is the main reason teams pick Hyperping over a usage-billed platform.
On-call and status pages built in
When a check fails at 3 AM, Hyperping pages whoever is on call, escalates if they don't acknowledge, and can post the incident to a public status page your customers already follow. Most lightweight monitors stop at sending a Slack message.
What actual Hyperping users say
"Hyperping has been a total game-changer for us. The service is reliable, easy to use, and incredibly feature-rich. I love that it constantly checks our site and alerts us right away if there are any issues."
"We made our Hyperping status page publicly available and it became a crucial part of our sales pitches. We are proud of our uptime and we love that we can share it with prospects and customers in such an easy way."
How much does Hyperping cost?
- Free: $0 for 20 monitors, 1 server agent, 1 status page, 5-minute checks
- Essentials: $24/month (yearly) for 50 monitors, 5 server agents, 1 status page, on-call, 30-second checks, 2 seats
- Pro: $74/month (yearly) for 100 monitors, 20 server agents, 3 status pages, phone call alerts, 5 seats
- Business: $249/month (yearly) for 1,000 monitors, 100 server agents, 10 status pages, 20-second checks, SAML SSO, 15 seats
All paid plans include a 14-day free trial. Yearly billing gives two months free. Additional server agents are $2/mo each ($1.50 on Business).
Where Hyperping falls short
No APM, tracing, or log management. Hyperping monitors availability and server health. It won't trace a slow request across microservices or let you query logs. If you need code-level observability, Datadog, New Relic, or Dynatrace are the right tools.
Not open-source or self-hostable. If self-hosting is a hard requirement, Prometheus + Grafana or another OSS stack fits better.
Metric history is bounded. Server metric retention runs from 2 days on Free to 30 days on Business, which is shorter than what a dedicated metrics backend offers.
Is Hyperping right for you?
Choose Hyperping if your priority is knowing your services are up, watching your servers, communicating incidents, and paging the right person, all at a flat rate. It's a strong fit for growing SaaS teams, European companies that value GDPR-compliant hosting, and SMBs that want monitoring and incident response without the cost and complexity of a full observability platform. If you need deep APM and tracing, pair it with one of the platforms below or choose one of them instead.
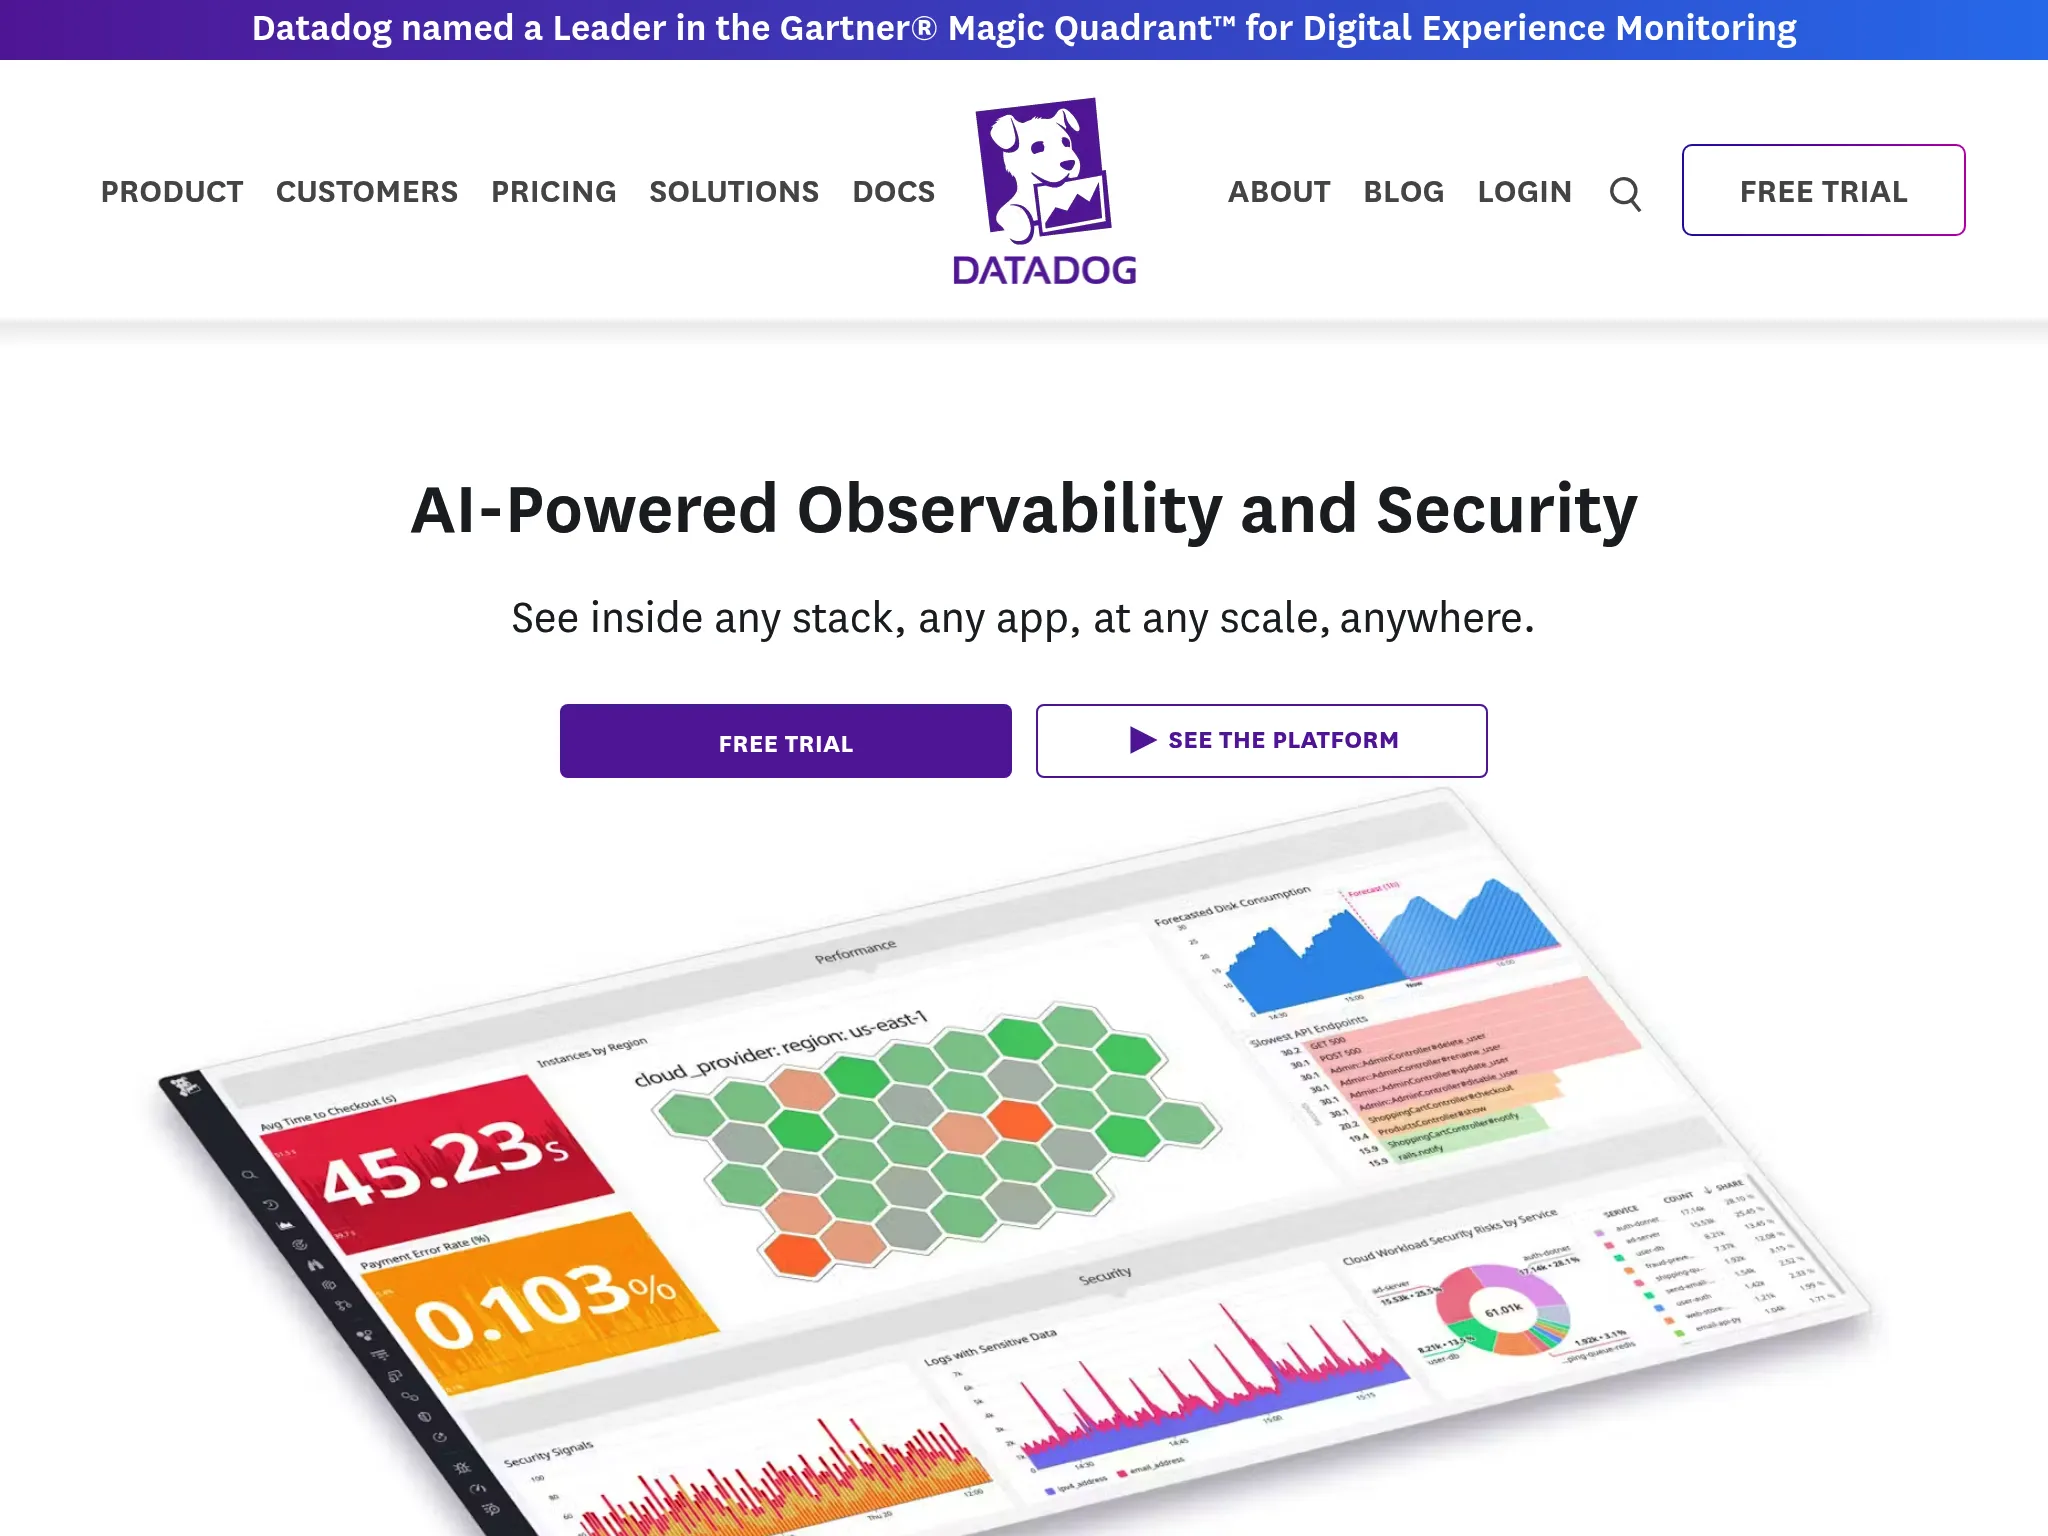
Datadog: Best for full-stack observability with the broadest integrations
Who Datadog is built for
Mid-market to enterprise teams running complex, distributed, cloud-native systems that want metrics, logs, traces, APM, security, and real-user monitoring correlated in one platform. Datadog is the most common answer when an engineering org decides to consolidate a pile of point tools.
From the G2 reviews I analyzed, the recurring praise is that Datadog brings metrics, logs, and traces together with an intuitive interface and fast setup. One reviewer summed up the consolidation story: "We used to use Sentry, self-hosted ELK, Grafana, Jaeger, OpsGenie. Datadog does all of it, but better."
Notable features
- Infrastructure monitoring: Real-time metrics from servers, containers, databases, and cloud services with auto-discovery and 700+ integrations.
- APM and distributed tracing: End-to-end request tracing, code-level visibility, and service maps across microservices.
- Log management: Centralized collection, indexing, and search, correlated with metrics and traces.
- Real user and synthetic monitoring: Session replay, Core Web Vitals, and simulated user journeys.
- Cloud SIEM and security monitoring: Threat detection with MITRE ATT&CK-aligned rules and compliance tooling.
- Watchdog and Bits AI: Machine-learning anomaly detection and an AI agent that investigates incidents.
Why choose Datadog?
The widest integration catalog
With 700+ pre-built integrations across AWS, Azure, GCP, Kubernetes, databases, and CI/CD, Datadog connects to almost anything with minimal effort. Reviewers consistently call integrations "quick and easy."
Genuine signal correlation
Metrics, logs, and traces share context, so you can pivot from a latency spike to the trace to the log line without leaving the platform. This is the workflow that justifies the price for teams with real distributed-systems complexity.
Fast time to value
Agent installation, auto-discovery, and out-of-the-box dashboards mean teams get visibility in hours, not days.
What G2 users say about Datadog
"What I like best about Datadog is how seamlessly it brings together metrics, logs, and traces in one place. The dashboard is very intuitive, and it's easy to set up real-time monitoring for applications and infrastructure."
"The main downside of Datadog is its pricing. It can get quite expensive as your infrastructure and data volume grow. Managing costs can be tricky, especially when you're monitoring multiple environments."
How much does Datadog cost?
- Free: Up to 5 hosts, 1-day metric retention, basic features
- Infrastructure Pro: $15/host/month (annual) or $18 on-demand
- Infrastructure Enterprise: $23/host/month (annual)
- Usage-based add-ons: Separate charges for indexed logs, APM spans, RUM sessions, synthetic tests, custom metrics, and security monitoring
The base host price is only the start. Logs, APM, custom metrics, and retention stack on top, which is why bills are hard to predict.
Where Datadog falls short
Unpredictable, escalating cost. This is the most cited complaint by far. Per-host pricing with autoscaling, plus usage-based logs and custom metrics, makes the total hard to forecast and easy to overshoot. The frustration runs deep enough that r/devops has long-running threads like "I do not understand the pricing model".
Overwhelming for new users. The breadth of features and dense UI take time to learn. Multiple reviewers describe getting lost in the number of screens and options.
Overkill for simple needs. If you mainly need uptime and server health, Datadog is far more platform (and cost) than the job requires.
Is Datadog right for you?
Choose Datadog if you run complex distributed systems and want the deepest, best-integrated observability available, and you have the budget and discipline to manage usage-based costs. It's a strong fit for mid-market and enterprise DevOps and SRE teams consolidating multiple tools. For smaller teams or simple stacks, the cost rarely justifies the depth.
New Relic: Best for usage-based observability with the most generous free tier
Who New Relic is built for
Mid-to-large engineering teams that want full observability (APM, infrastructure, logs, browser, mobile) but prefer pricing based on data ingested rather than per host. New Relic's free tier is generous enough that small teams and side projects can run real monitoring at no cost.
Notable features
- APM and distributed tracing: Code-level visibility and transaction tracing across microservices, with strong language support.
- Infrastructure monitoring: Hosts, containers, Kubernetes, and cloud resources with no per-host charge.
- Digital experience monitoring: Browser RUM, mobile monitoring, session replay, and synthetic checks.
- Logs in context: Ingest and correlate logs with traces and metrics, queryable with NRQL.
- AI observability and AIOps: Anomaly detection, incident correlation, root-cause analysis tied to deployments, and tracing for LLM-based applications.
- OpenTelemetry support: Strong native OTel plus 780+ quickstart integrations.
Why choose New Relic?
The best free tier in the category
100 GB/month of data ingest, one full platform user, and unlimited basic users, with no time limit. For small teams this covers real production monitoring at zero cost.
No per-host billing
Pricing is based on data ingested (around $0.40/GB) plus user seats, so instrumenting more hosts doesn't automatically raise your bill the way per-host models do.
Developer-friendly querying
NRQL gives you a flexible query language across all your telemetry, and reviewers consistently praise the documentation and onboarding.
How much does New Relic cost?
- Free: 100 GB/month ingest, 1 full user, unlimited basic users, 500 synthetic checks
- Data ingest: ~$0.40/GB (Original) or $0.60/GB (Data Plus) beyond the free 100 GB
- Core users: ~$49/user/month
- Full Platform users: From ~$99/user/month (Standard) up to ~$349 to $419 (Pro), Enterprise custom
Where New Relic falls short
Full-user seats get expensive. The data model is friendly, but full platform users add up quickly for larger teams, and reviewers cite this as the main cost surprise.
Steep learning curve. The platform has many layers and dashboards, and new users describe it as overwhelming at first.
Cost still scales with data. Very high ingest volumes or log-heavy environments can push the bill up, even without per-host fees.
Is New Relic right for you?
Choose New Relic if you want full observability with pricing tied to data rather than hosts, and you value a free tier you can actually build on. It's a strong fit for mid-sized engineering teams, especially those instrumenting many hosts where per-host pricing would hurt. Watch the full-user seat count as the team grows.
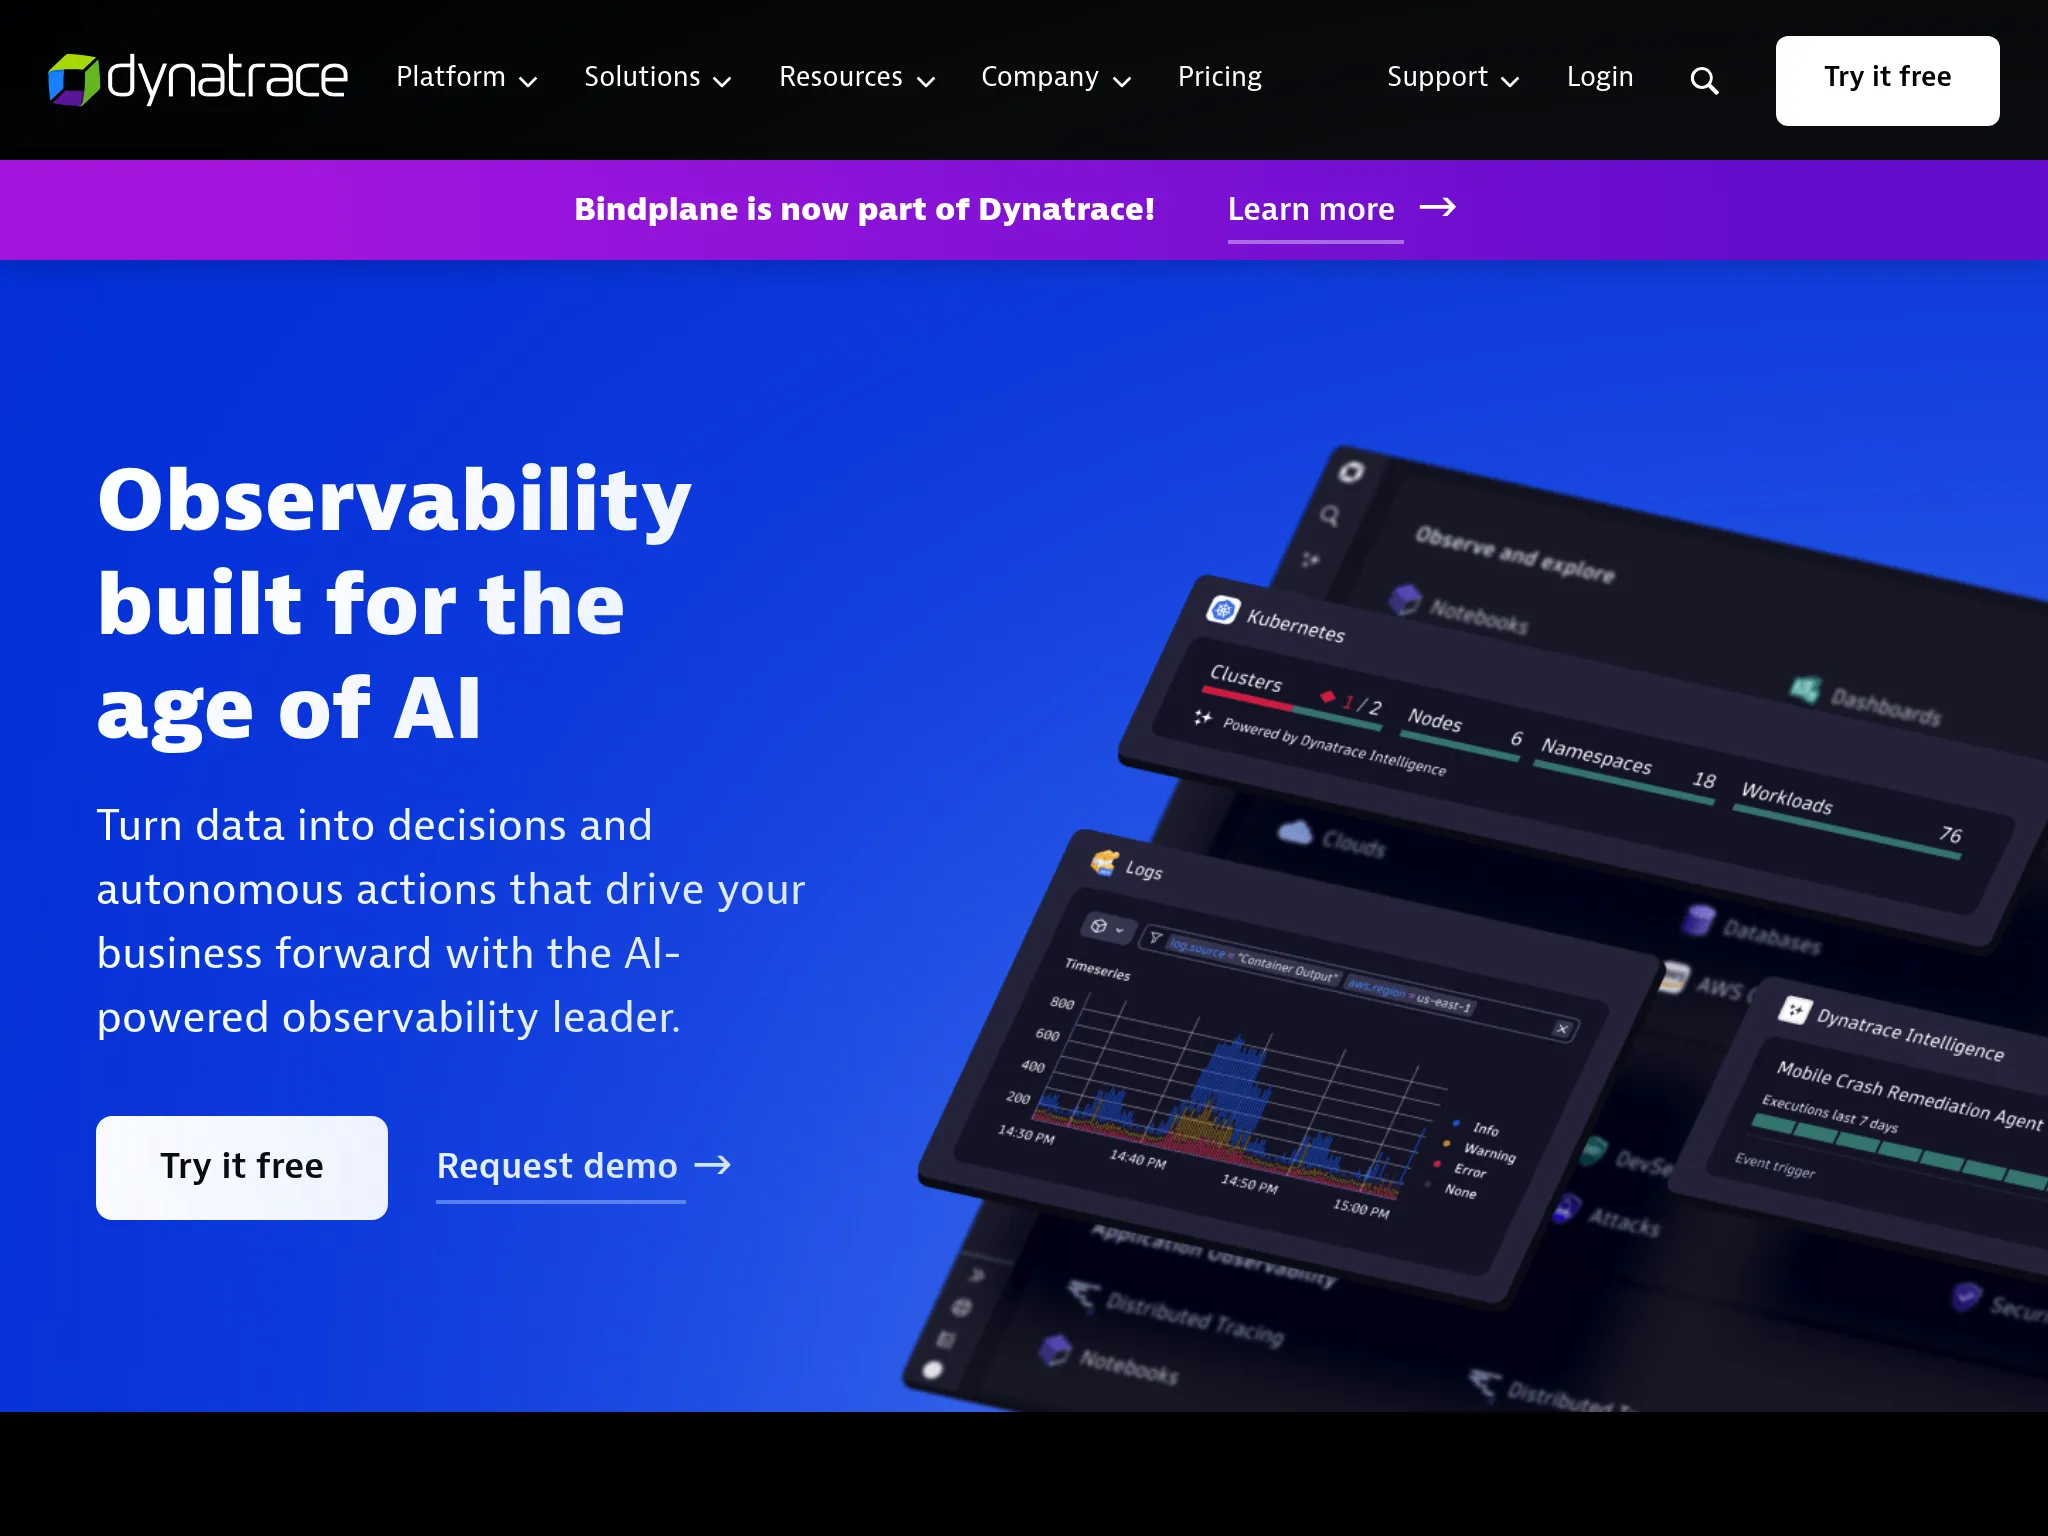
Dynatrace: Best for AI-driven automatic root-cause at enterprise scale
Who Dynatrace is built for
Large enterprises with complex, fast-changing cloud-native or hybrid environments that want automation to do the heavy lifting. Dynatrace is built around auto-instrumentation and an AI engine that correlates across the stack to surface a single root cause, rather than handing you raw dashboards to investigate yourself.
From the analysis I gathered, Dynatrace serves around 4,000 customers, heavily weighted toward Global 500 organizations in banking, insurance, government, and retail where uptime and digital experience are business-critical.
Notable features
- OneAgent auto-instrumentation: Discovers applications, services, hosts, and dependencies automatically, without manual configuration.
- Davis AI engine: Automated anomaly detection and root-cause analysis that correlates metrics, logs, traces, and topology to point at the actual cause and suggest remediation.
- Smartscape topology mapping: A real-time, always-current dependency map of services, processes, hosts, and cloud resources.
- PurePath tracing: Code-level distributed tracing across microservices.
- Grail data lakehouse: A unified, schema-on-read store for observability, security, and business data, queried with DQL.
- Runtime application security: Vulnerability detection and protection tied to real application behavior.
Why choose Dynatrace?
Automation that reduces manual setup
OneAgent and Smartscape mean you don't hand-configure monitoring for every service. For large, dynamic estates, this is the biggest time saver and the main reason enterprises pick it.
Root-cause analysis, not just dashboards
Davis AI aims to tell you what broke and why, correlating across layers automatically. Reviewers note it meaningfully cuts alert fatigue and time to resolution at scale.
True full-stack coverage
Infrastructure, APM, logs, digital experience, and security in one unified data model, built for very large systems.
How much does Dynatrace cost?
Dynatrace uses a consumption-based model (the Dynatrace Platform Subscription) charging on monitored resources such as hosts, sessions, synthetic tests, and logs. Public estimates put full-stack host monitoring in the range of roughly $0.04/hour per 8 GiB host, with unit prices dropping as consumption grows. There is no permanent free tier, only a time-limited trial.
Where Dynatrace falls short
No free tier and enterprise-oriented pricing. This makes it inaccessible for small teams and early experimentation.
Depth overwhelms smaller or less-mature teams. The feature richness that helps large estates is a steep learning curve for everyone else.
Cost management requires discipline. Optimizing DPS units, log ingest, and license usage is an ongoing task, and reviewers describe the model as opaque at times.
Is Dynatrace right for you?
Choose Dynatrace if you're a large enterprise with a complex environment and a mature SRE or platform team, and you want AI-driven automation to manage monitoring at scale. It's overkill, and out of reach on price, for small and mid-sized teams.
Better Stack: Best for monitoring unified with logs and incident response
Who Better Stack is built for
Small to mid-sized tech companies and developer-first teams that want uptime monitoring, heartbeat checks, log management, and incident response in one modern platform. Better Stack works well when you want to go from "the service is down" to "here's the log line that explains why" without switching tools.
From the reviews I analyzed, Better Stack's standout is its developer experience. Users repeatedly call out the modern UI and fast setup, with one describing it as "probably the best looking interface you'll ever get to work with."
Notable features
- Uptime monitoring: 30-second checks verified from at least three geographic regions to reduce false positives.
- Log management: SQL-like querying with ClickHouse-powered storage and real-time tailing, built to handle very high log volumes.
- Incident management: On-call scheduling, escalation policies, smart alert merging, and AI-generated post-mortems.
- Status pages: Public and private branded pages.
- Multi-channel alerting: Voice, SMS, Slack, Teams, email, and push, with noise suppression.
- eBPF-based tracing: OpenTelemetry auto-instrumentation without code changes.
Why choose Better Stack?
Logs alongside monitoring
When a check fails or a service degrades, you can query the relevant logs in the same platform. For teams that spend time tailing logs after an alert, this is a real workflow improvement.
Incident response built in
Rotations, escalation, smart merging, and post-mortem timelines come with the platform, so you don't need a separate on-call tool.
Strong developer experience
The modern UI and quick setup are the most consistent praise in reviews, and the free tier lets teams try the full workflow before paying.
What G2 users say about Better Stack
"BetterStack Uptime is an excellent tool for monitoring the availability of sites and services in real-time. Its interface is modern, easy to use, and pleasant on a daily basis. I appreciate the ability to quickly set up monitors, receive multi-channel alerts, and share professional status pages with clients."
How much does Better Stack cost?
- Free: 10 monitors, 1 status page, limited log retention
- Startup: ~$29 to $34/month for more endpoints, advanced alerting, and increased log retention
- Business: ~$200/month for greater scale and custom branding
- Enterprise: Custom, with unlimited endpoints, SLA guarantees, and dedicated support
Pricing is modular across monitoring, logs, and on-call, so the total depends on which products you use.
Where Better Stack falls short
Modular pricing adds up. What starts cheap can climb as you layer on log volume, on-call responders, and status pages.
Dashboards strain past 100 monitors. Reviewers with large numbers of monitors note the dashboard design limits visibility at that scale.
Not a deep APM platform. It covers monitoring, logs, and incidents well, but doesn't match Datadog or Dynatrace on full APM and tracing depth.
Is Better Stack right for you?
Choose Better Stack if you want uptime, logs, and incident response in one developer-friendly tool and you're comfortable with modular pricing. It's a strong fit for startups and small-to-mid teams that debug through logs and value a polished UI. Larger or APM-heavy needs point elsewhere.
Prometheus + Grafana: Best open-source stack for cloud-native metrics

Who Prometheus + Grafana is built for
Engineering teams running Kubernetes and cloud-native infrastructure that want full control over their metrics and are willing to run the infrastructure themselves to avoid per-host or usage-based SaaS bills. Prometheus is the de facto standard for Kubernetes metrics, and Grafana is the visualization layer on top.
Notable features
- Metrics collection and storage: Prometheus scrapes metrics over HTTP from exporters and instrumented services into a time-series database.
- PromQL: A powerful query language for aggregation, SLOs, and ad-hoc analysis.
- Grafana dashboards: Rich, templated visualization with a large library of community dashboards.
- Alertmanager: Rule-based alerting and routing to email, Slack, PagerDuty, and more.
- Multi-source dashboards: Grafana combines Prometheus metrics with logs (Loki), traces (Tempo), and other data sources.
- Huge exporter ecosystem: Pre-built exporters for databases, message queues, Linux hosts, and Kubernetes.
Why choose Prometheus + Grafana?
No license cost
Self-hosted, both are free under permissive open-source licenses. For cost-conscious teams at scale, self-hosting can run a small fraction of what a commercial platform charges, trading money for operational work.
Best-in-class Kubernetes metrics
Prometheus is a graduated CNCF project and ships with most Kubernetes distributions, with first-class Grafana support and community dashboards for nearly every common workload.
Full control and flexibility
You decide retention, resource sizing, and architecture. PromQL gives fine-grained, metrics-driven analysis that black-box platforms often abstract away.
How much does Prometheus + Grafana cost?
- Self-hosted OSS: Free, you provide and operate the infrastructure
- Grafana Cloud: Free tier plus usage-based paid plans, with entry tiers commonly around $29 to $49/month, billed on metrics series, log volume, and retention
- Managed Prometheus: AWS AMP and Google Cloud Managed Service for Prometheus charge per million samples ingested
Where Prometheus + Grafana falls short
Operational overhead. Running, scaling, and backing up Prometheus, long-term storage, and Grafana yourself requires real infrastructure expertise and ongoing maintenance.
Learning curve. PromQL, dashboard templating, and alerting rules are powerful but take time to master.
Metrics-first. Out of the box you get metrics, not a tightly integrated logs and traces experience. Full observability means adding Loki, Tempo, or Jaeger.
Scaling needs extra components. Vanilla Prometheus is single-node; large, multi-cluster setups need Thanos, Mimir, or Cortex.
Is Prometheus + Grafana right for you?
Choose Prometheus + Grafana if you run Kubernetes, want control over your metrics, and have the engineering capacity to operate the stack. It's a strong fit for platform teams optimizing for cost at scale. If you'd rather not run monitoring infrastructure, a managed platform is the better trade.
A note on native cloud provider tools
Every major cloud comes with its own monitoring service, and for single-cloud teams these are worth a look before adding a third-party tool:
- Amazon CloudWatch: Metrics, logs, alarms, and dashboards for AWS, with deep native integration and a generous free tier. Pay-as-you-go beyond that.
- Azure Monitor: The equivalent for Azure, covering metrics, logs (Log Analytics), and Application Insights for APM.
- Google Cloud Operations (formerly Stackdriver): Monitoring, logging, and tracing for Google Cloud.
The appeal is obvious: zero extra integration, native access to every service metric, and billing on your existing cloud account. For a team running entirely on one provider with modest needs, the native tool often covers the basics well.
The limitations show up at the edges. In r/devops discussions comparing Datadog and AWS-native monitoring, engineers regularly cite weaker cross-account and multi-cloud support, default metric delays (CloudWatch's standard resolution can lag), thinner alerting and grouping than dedicated tools, and a UX that many find clunky compared to third-party overlays. Costs can also creep with high log ingestion and custom metrics, the same trap as the commercial platforms. Most teams that outgrow a single cloud, or that want a polished status-page and on-call workflow, end up layering a dedicated tool on top.
All cloud monitoring tools analyzed
For completeness, here's the broader landscape beyond the top picks:
| Name | Pricing (2026 Est.) | Main Strength | Main Weakness |
|---|---|---|---|
| Hyperping | From $24/mo | Flat-rate bundle. Uptime, server monitoring, status pages, on-call. | Not full observability. No APM or logs. |
| Datadog | From $15/host/mo | Breadth. 700+ integrations, full-stack observability. | Cost scales fast and unpredictably. |
| New Relic | Free; usage from ~$0.40/GB | Best free tier, usage-based, no per-host fees. | Full-user seats get expensive. |
| Dynatrace | Consumption; no free tier | AI root-cause. Davis AI and auto-instrumentation. | Enterprise pricing, steep curve. |
| Better Stack | Free; from ~$29/mo | Logs plus monitoring with modern DX. | Modular pricing adds up. |
| Prometheus + Grafana | Free (self-hosted) | Open-source control for cloud-native metrics. | Operational overhead. |
| Amazon CloudWatch | Pay-as-you-go; free tier | Native AWS integration. | Weak multi-cloud, clunky UX. |
| Azure Monitor | Pay-as-you-go | Native Azure plus App Insights APM. | Best within Azure only. |
| Google Cloud Operations | Pay-as-you-go | Native GCP monitoring, logging, tracing. | Limited outside GCP. |
| Splunk Observability | From ~$95/host/mo | Log and search power at large scale. | Expensive, steep learning curve. |
| Zabbix | Free (open-source) | Comprehensive infra and network monitoring. | Dated UI, self-management overhead. |
| LogicMonitor | ~$21/managed server/mo | Hybrid and multi-cloud visibility. | Less APM depth, opaque pricing. |
| Site24x7 | From ~$9/mo | Value all-in-one. Sites, servers, apps, network. | Dated, cluttered interface. |
| Honeycomb | Free tier; event-based | High-cardinality debugging. | Query learning curve, less infra focus. |
| SigNoz | Free (OSS); cloud usage-based | OpenTelemetry-native, low cost. | Newer, less mature ecosystem. |
| Elastic Observability | Free core; usage-based cloud | Strong log search and analytics. | High cost and complexity at scale. |
Frequently asked questions
What's the difference between cloud monitoring and observability?
Cloud monitoring tracks known signals (is the service up, is CPU high, did the request fail) against dashboards and alerts you set up. Observability is the broader practice of combining metrics, logs, and traces so you can investigate problems you didn't anticipate. Uptime and server monitoring tools like Hyperping cover the monitoring layer. Platforms like Datadog, New Relic, and Dynatrace aim at full observability.
Why do cloud monitoring bills get so expensive?
The usual drivers are per-host pricing that climbs with autoscaling, log ingestion volume, high-cardinality custom metrics, and long data retention. On platforms like Datadog these stack on top of each other, which is why teams report monitoring costs rivaling their cloud spend. Flat-rate tools and self-hosted open-source stacks are the two common ways to control this.
Do I need a third-party tool if I already use CloudWatch or Azure Monitor?
If you run entirely on one cloud with modest needs, the native tool may be enough. Teams add a third-party tool when they go multi-cloud, want better alerting and correlation, need a polished status page and on-call workflow, or find the native UX too limiting. It's common to keep the native tool for raw cloud metrics and layer a dedicated tool on top.
Which cloud monitoring tool is cheapest?
For self-hosting, Prometheus + Grafana has no license cost, though you pay in operational work. For a hosted tool, New Relic's free tier (100 GB/month plus one full user) is the most generous, and Hyperping's flat-rate plans from $24/mo are the most predictable. Native cloud tools are cheap at low volume but creep with usage.
Which tool is best for a small team or startup?
For uptime, server monitoring, status pages, and on-call without complexity, Hyperping at a flat rate. For full observability on a budget, New Relic's free tier. For monitoring plus logs and incidents with a modern UI, Better Stack. Datadog and Dynatrace are usually more platform and cost than an early team needs.
Which tool is best for a large enterprise?
Dynatrace for AI-driven automation and root-cause at scale. Datadog for the broadest integrations and unified observability. New Relic if you prefer usage-based pricing. Self-hosted Prometheus + Grafana (often with Thanos or Mimir) if cost control and infrastructure ownership matter more than a managed experience.
Can I monitor multi-cloud and hybrid environments?
Yes, with the right tool. Datadog, New Relic, Dynatrace, and Prometheus + Grafana all work across AWS, Azure, GCP, Kubernetes, and on-prem. The native cloud tools (CloudWatch, Azure Monitor, Google Cloud Operations) are the weakest at multi-cloud, since each is built for its own provider.
How to test these tools
Most of the top picks offer trials or free tiers:
- Hyperping: Free tier and 14-day trial on all paid plans
- Datadog: 14-day full trial, free tier for up to 5 hosts
- New Relic: Perpetual free tier with 100 GB/month and one full user
- Dynatrace: Time-limited trial, no permanent free tier
- Better Stack: Free tier with monitoring, logs, and a status page
- Prometheus + Grafana: Free to self-host, or Grafana Cloud free tier
To evaluate them:
- Define your layers. Decide which you actually need: uptime, server metrics, APM and tracing, logs, status pages, on-call. Don't buy depth you won't use.
- Instrument a real slice of production. Connect a representative set of services and hosts, not a toy app, so you see real data volume and real cost signals.
- Trigger failures. Take a service down, slow a request, and exhaust a resource. Compare detection speed, alert quality, and how fast you can find the cause.
- Project the bill at your real scale. For usage-based tools, estimate cost at your actual host count, log volume, and retention, not the starting price. This is where most surprises live.
- Test the human workflow. Does the alert reach the right person through the right channel fast enough? If on-call and status pages matter, exercise the full escalation and communication path.