The best Datadog alternatives in 2026 are Hyperping for uptime, status pages, on-call, and server monitoring at a flat rate, New Relic for APM with a generous free tier, Dynatrace for enterprise AI-driven root-cause analysis, and Better Stack for monitoring combined with logs and incident response.
I analyzed 30+ tools, read hundreds of G2 and Capterra reviews, pulled patterns from r/devops and r/sre threads, and compared real pricing at common team sizes. If you want the short version: most teams switching from Datadog do it because of pricing, not features. The right replacement depends on which slice of Datadog you actually use.
In this guide you will learn:
- The four picks I would recommend, with honest pricing
- Why teams actually leave Datadog (it is almost always cost)
- A pricing comparison at three team sizes
- The full list of 30+ Datadog alternatives I considered
If you want uptime monitoring, server monitoring, status pages, and on-call in one tool at a price that does not climb with your log volume, Hyperping covers all four. Start your free trial.
Why you can trust this guide
I am Léo, founder of Hyperping. I have a stake in one of these tools and I will be upfront about that throughout. Hyperping covers a specific slice of the Datadog stack: external checks, server monitoring, status pages, and on-call. For deep APM, distributed tracing, or correlated log analytics at scale, the other tools in this guide are better fits and I say so below.
To build this guide I read product analyses for each tool, pulled quotes from G2, TrustRadius, and Reddit, and cross-referenced criteria against the threads where engineers and SREs actually discuss what works.
Where I could not test a tool directly, I said so and relied on verified user feedback.
Top picks at a glance
| Best for | Product | Starting price |
|---|---|---|
| Uptime, server monitoring, status pages, and on-call in one tool | Hyperping | $24/month |
| APM with the most generous free tier | New Relic | Free up to 100GB/month, then $0.35/GB |
| Enterprise AI root-cause analysis at scale | Dynatrace | ~$29/host/month (DPS-based) |
| Monitoring plus logs and incident response | Better Stack | $29/month |
Why teams leave Datadog
Across the Reddit threads and reviews I read, the complaints follow a consistent pattern. Features are rarely the problem. Pricing and predictability are.
- Runaway bills. The single most common complaint. Custom metrics, log ingestion, indexed events, APM spans, and host counts all bill separately and scale with usage. Users on r/devops report invoices three to ten times their initial budget. One r/devops thread describes the billing model as feeling like overcharging by design.
- Opaque billing. Hard to forecast, even harder to control. Custom metrics on a Kubernetes cluster with high-cardinality tags can quietly multiply your invoice. Many teams say they need a dedicated person to manage Datadog usage.
- 8% support tax. Standard 24/7 support costs 8% of your monthly spend with a $2,000 monthly minimum. That stings at scale.
- Vendor lock-in. Datadog's agents and proprietary instrumentation make switching painful. Teams that started Datadog years ago often cite this as the reason they wish they had picked an OpenTelemetry-first tool.
- Alert fatigue and tuning. Powerful alerting, but tuning it (especially on Elasticsearch-based logging) is repeatedly called out as painful in r/devops observability threads.
Positive notes balance this. Many users still call Datadog the best polished, all-in-one observability platform on the market. Engineers on r/devops describe Datadog as "GOAT" when cost is not the binding constraint. The pattern is clear: teams that fully commit and manage usage carefully stay happy. Teams that grow past 100 hosts or heavy log volumes start looking for the exit.
What people actually want from a replacement, in roughly this order:
- Predictable pricing (flat-rate or transparent per-host).
- OpenTelemetry support, so they are not locked in again.
- Good-enough APM and infrastructure monitoring for their stack.
- Status pages and on-call without bolting on Statuspage.io plus PagerDuty.
- Low-maintenance alerting that does not require constant tuning.
The four tools below each cover at least three of these for a specific kind of team.
How I picked these four
I started with the 30+ tools in the alternatives list at the bottom of this guide. I cut tools that fell short on at least one of three criteria:
- Opaque pricing. Tools that require a sales call before you can get a number.
- Too narrow. Tools that cover only one slice without filling enough of the Datadog gap.
- Operational overhead. Tools that are technically free but cost real engineering time to run, unless that tradeoff is the point (Prometheus, SigNoz, Uptrace).
That left a shortlist where each tool wins clearly for a specific use case. I changed one pick from the previous version of this guide: AppDynamics is out, Better Stack is in. AppDynamics has strong APM but pricing is enterprise-opaque and the product feels more like a Cisco bundle than a 2026 observability tool. Better Stack covers more of the same gap Datadog leaves for SMB and mid-market teams at transparent prices.
Pricing at three team sizes
Here is what I calculated for three common team sizes. Numbers are monthly and as of May 2026.
Startup (5 engineers, 20 hosts, 1 status page):
| Tool | Monthly cost | Includes |
|---|---|---|
| Hyperping | $38 | Monitoring + 5 servers + on-call + 1 status page + 2 extra seats |
| Better Stack | ~$170 | Monitors + on-call (5 users) + 1 status page |
| New Relic | Free | Within the 100GB free tier, 1 full platform user, rest on basic seats |
| Dynatrace | ~$580 | $29/host x 20 hosts (full-stack) |
| Datadog | ~$460 | $23/host x 20 hosts (Enterprise tier) |
Mid-stage SaaS (10 engineers, 100 hosts, 3 status pages):
| Tool | Monthly cost | Includes |
|---|---|---|
| Hyperping | $74 | 250 monitors + 20 servers + on-call + 3 status pages |
| Better Stack | ~$368 | Monitors + on-call (10 users) + 3 status pages |
| New Relic | ~$200 to $600 | Data ingest past the 100GB free tier, 1 full platform user and 9 basic seats |
| Dynatrace | ~$2,900 | Full-stack across 100 hosts |
| Datadog | ~$2,300+ | Per-host plus APM plus log ingest |
Enterprise (50 engineers, 500 hosts, 10 status pages):
| Tool | Monthly cost | Includes |
|---|---|---|
| Hyperping | $249 (Business) | 1,000 monitors + 100 servers + 10 status pages + SAML SSO |
| Better Stack | Custom | Enterprise tier |
| New Relic | Custom | Enterprise agreement, negotiated seat pool plus ingest |
| Dynatrace | ~$14,500+ | $29/host x 500 hosts |
| Datadog | ~$11,500+ | Before custom metrics and log volume |
The pattern is consistent. Hyperping is the predictable flat-rate option. New Relic stays cheap until your data volume grows or a second engineer needs a full platform seat, since those are $549/user/month at list. Better Stack splits the difference between transparent SaaS and modular pricing. Dynatrace and Datadog scale linearly with your fleet. To run your own fleet size, the server monitoring cost calculator compares Datadog, New Relic, Netdata, and Hyperping by host count.
1. Hyperping: best all-in-one for SaaS teams
Perfect for
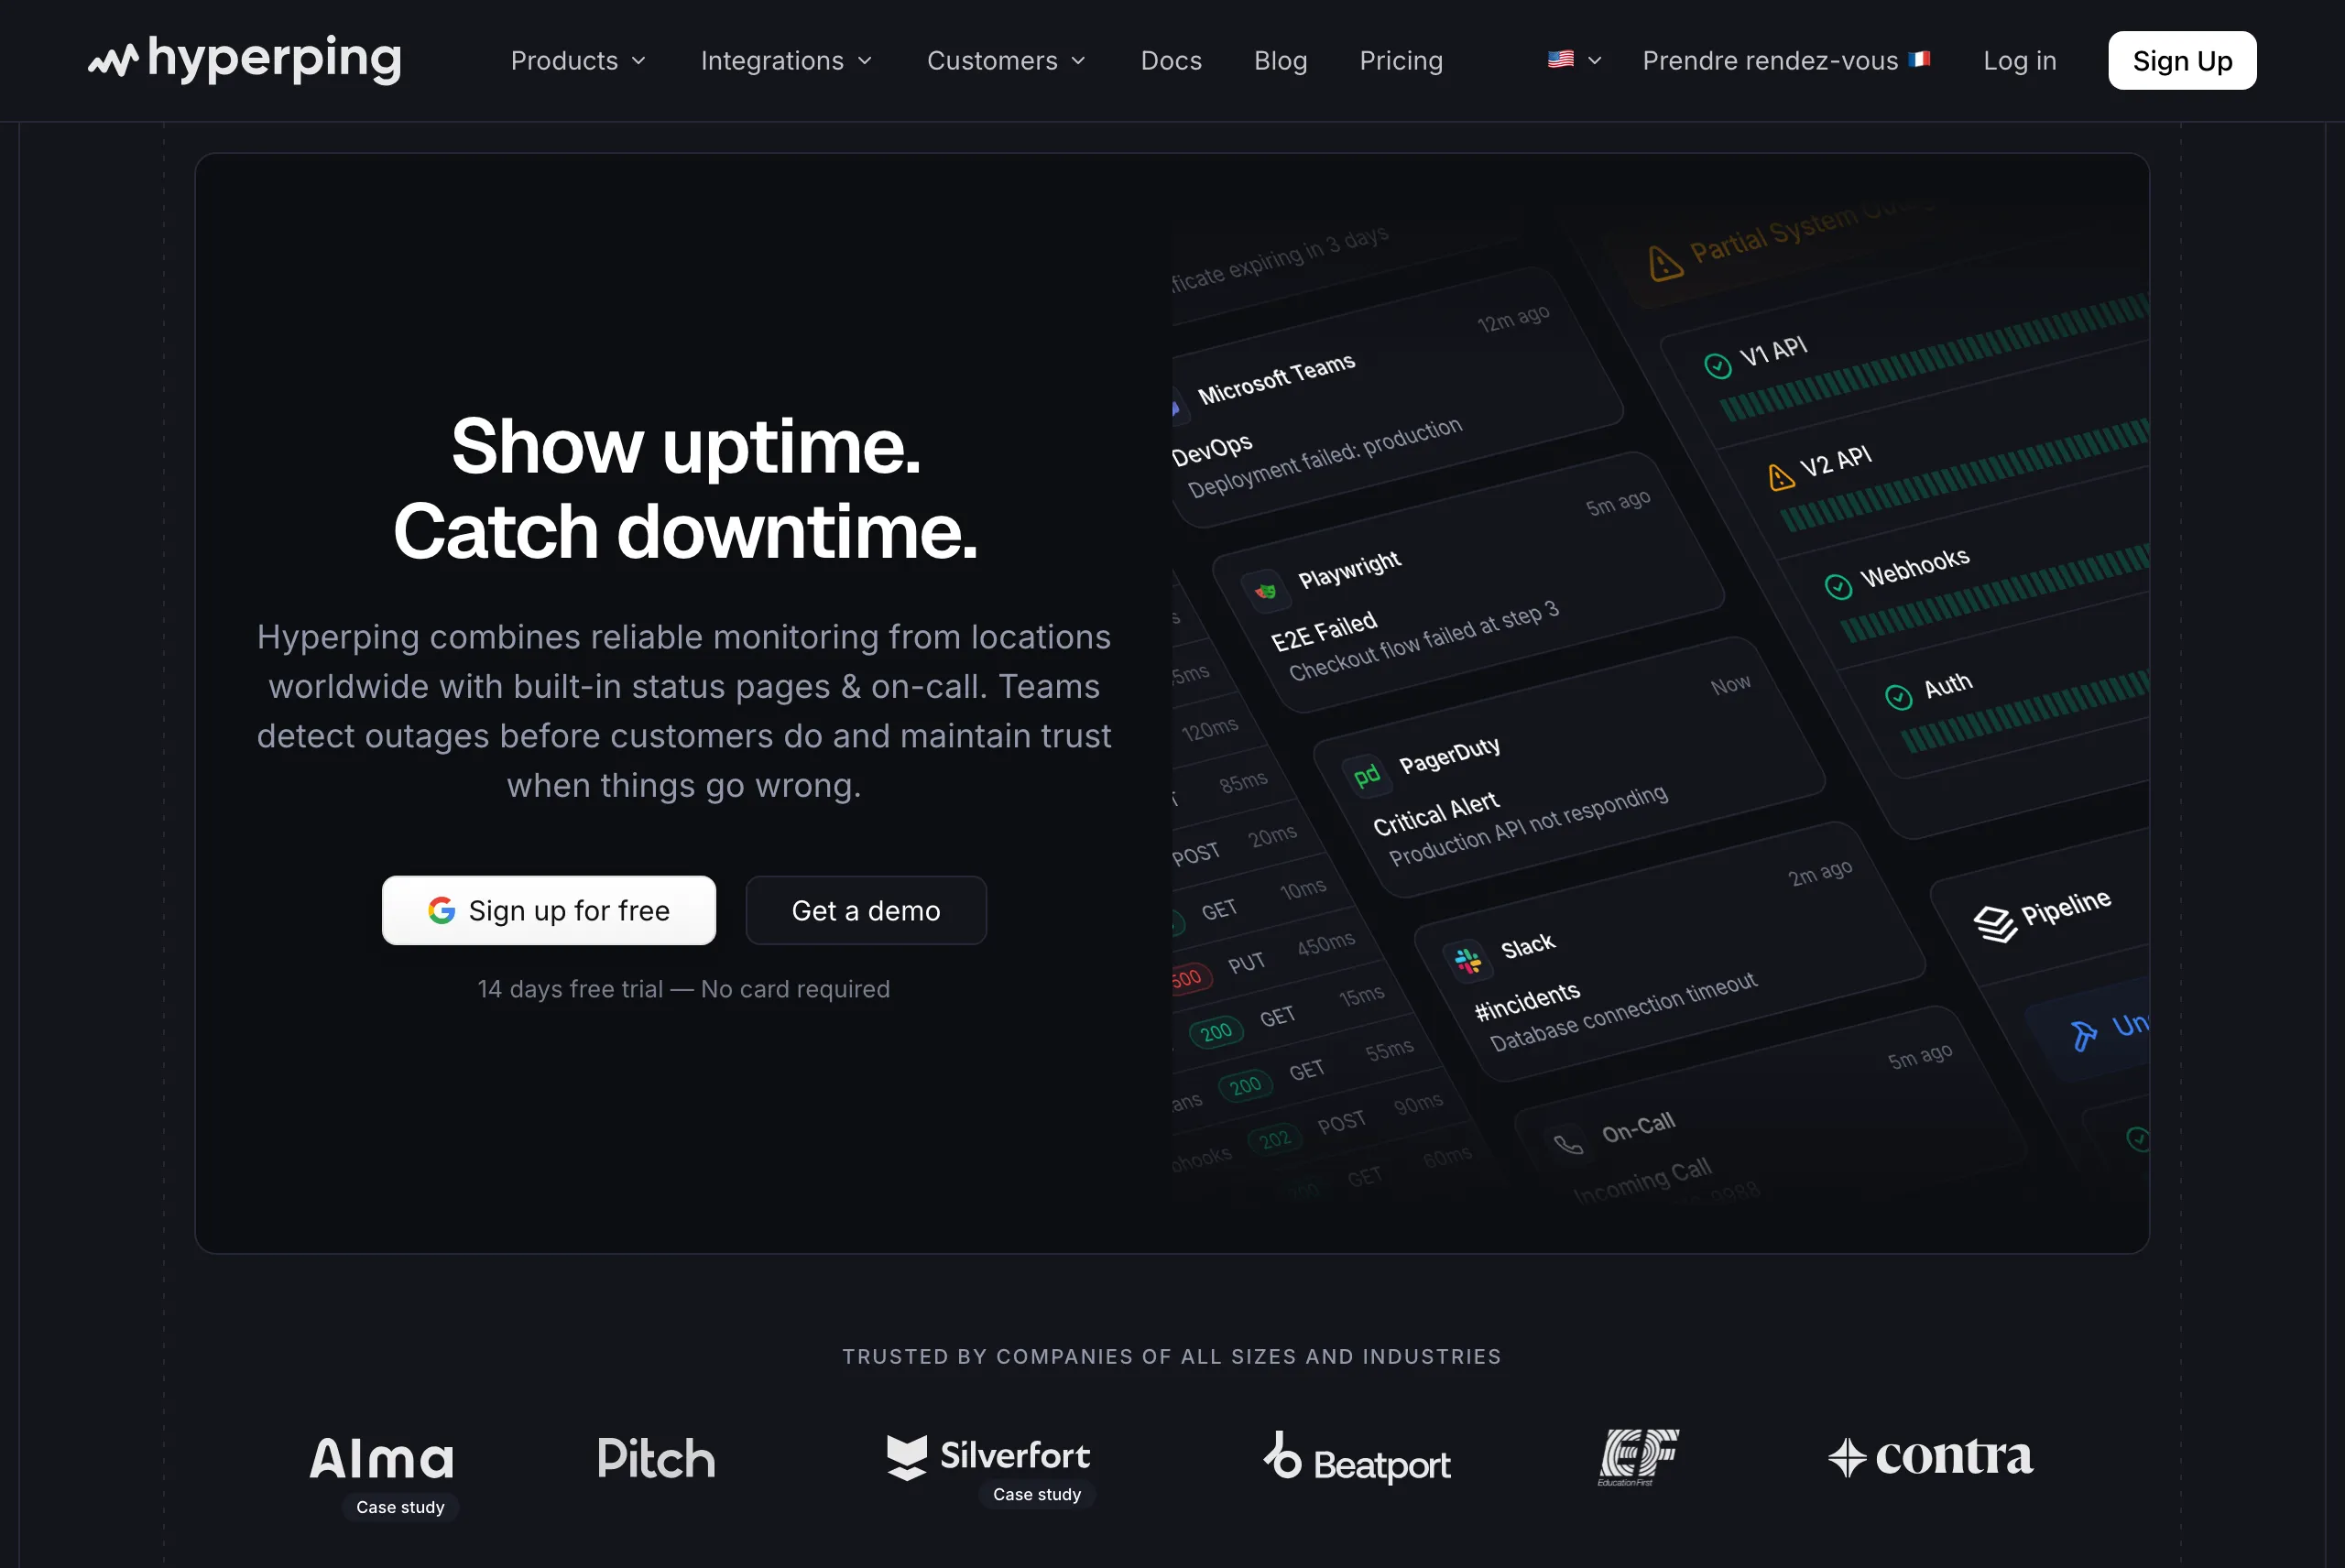
Startups, SMBs, and growing SaaS teams that need uptime monitoring, server health, status pages, and on-call scheduling in one tool with predictable monthly pricing.
Notable features
- External monitoring from 18 global regions. Catch issues from your customers' perspective, not just inside your VPC. HTTP, port, ping, keyword, and DNS checks at 30-second intervals (20-second on Business), plus daily SSL certificate checks.
- Server monitoring with a lightweight agent. New in 2026. Install on Linux (systemd) or macOS (launchd) and stream CPU, memory, filesystem, disk I/O, network, and host metadata back to your dashboard every 30 seconds. Built on OpenTelemetry with an on-disk queue so metrics survive ingest outages.
- Playwright-based browser checks. End-to-end synthetic monitoring for login, checkout, and other critical flows.
- Full-featured status pages included. Public and private pages, custom HTTPS domains, white-label branding, SAML SSO protection, multi-language support, embedded charts. 3 pages on Pro, 10 on Business, with no per-page fees inside those limits.
- On-call scheduling and escalation policies. Timezone-aware rotations, automatic handoffs, multi-step escalation. Acknowledge and escalate from Slack, Teams, or SMS.
- Multi-channel alerting. Email, SMS, voice calls, Slack, Teams, Discord, Telegram, PagerDuty, OpsGenie, webhooks. Auto-retry across regions to suppress false positives.
- EU hosting and GDPR compliance. DIN ISO/IEC 27001 certified, EU data centers.
Why choose Hyperping
The case for Hyperping comes down to two things. First, predictable flat-rate pricing. A 100-monitor, 20-server, 5-seat, 3-status-page setup is $74/month on the Pro plan. The same setup using Datadog plus Statuspage.io plus PagerDuty would clear $1,000/month before log volume. Second, three or four products in one bill. Monitoring, server agents, status pages, and on-call scheduling are all included at every paid tier.
The 2026 server monitoring agent closes the main historical gap with Datadog for SMB teams. You install one command on a Linux or macOS host, and CPU, memory, filesystem, disk I/O, network, and host metadata stream to the dashboard within seconds. The collector embeds OpenTelemetry host metrics and persists unsent batches to disk so metrics survive reboots and network blips. External HTTP checks tell you a page stopped loading from outside your network. The agent tells you the host ran out of memory two minutes earlier. Both work together.
Alma, a French fintech processing millions of buy-now-pay-later transactions, runs Hyperping as an independent safety net alongside Datadog. Their SRE Fabrice Gregoire told me:
"Hyperping's reputation in our company is that it's more reactive than Datadog. We usually get notifications from Hyperping before Datadog. It's useful as a fallback, a lighter backup monitoring solution."
"Datadog charges per check. You [Hyperping] have a package, that's better. Pay per use is annoying and expensive."
Read the full Alma case study.
What users say
"Hyperping has been a total game-changer for us. The service is reliable, easy to use, and incredibly feature-rich."
"We made our Hyperping status page publicly available and it became a crucial part of our sales pitches. We are proud of our uptime and we love that we can share it with prospects."
Considerations
Hyperping is not a full observability platform. You do not get distributed tracing, indexed log analytics, or APM for deep code-level performance work. If you need to correlate a slow database query with a specific code path across microservices, pair Hyperping with New Relic, Datadog, or SigNoz.
Server metric history depends on the plan: 1-minute resolution is kept for 7 days on Essentials, 14 days on Pro and 30 days on Business, and hourly rollups for 6 months on Essentials and 13 months on Pro and Business. There are no threshold alerts on metric values yet: Hyperping pages you when a server stops reporting, not when a disk crosses 90%. Per-process metrics, per-interface packets and errors, and swap stats are on the roadmap but the ingestor does not accept them yet.
Pricing
- Free: 1 seat, 20 monitors, 1 server agent, 1 basic status page, 5-min checks
- Essentials: $24/month yearly (3 seats, 50 monitors, 5 server agents, 1 status page, 30-sec checks)
- Pro: $74/month yearly (10 seats, 250 monitors, 20 server agents, 3 public or private status pages, phone alerts). Includes email access codes, multilingual pages, and native account SAML SSO.
- Business: $249/month yearly (20 seats, 1,000 monitors, 100 server agents, 10 status pages, 20-sec checks, SAML SSO add-ons)
- Enterprise: Custom
All paid plans include on-call scheduling, escalation policies, and the server monitoring agent. Yearly billing gives 2 months free. See the full pricing page, or the server-by-server cost comparison with Datadog for what 20 or 100 hosts cost on each.
Choose Hyperping if
You want monitoring, server health, status pages, and on-call in one tool with a bill that does not climb every time you ship more services. It is a strong fit for European companies that need GDPR compliance, SaaS teams using their status page as a sales asset, and SRE teams running Hyperping as an independent safety net alongside Datadog (see the Alma case study).
2. New Relic: best for APM with a generous free tier
Perfect for
Mid-to-large engineering teams running cloud-native, microservices, or Kubernetes workloads that need deep APM and tracing without per-host pricing.
Notable features
- Distributed tracing and APM. Code-level visibility across microservices with auto-instrumentation in Java, Python, Node.js, Go, Ruby, .NET, and PHP.
- Infrastructure monitoring. Real-time host, container, Kubernetes, and cloud metrics. No per-host fees, unlike Datadog or Dynatrace.
- Digital experience monitoring. Browser RUM, mobile monitoring, session replay, and synthetic checks correlated with backend telemetry.
- Log management in context. Ingest, parse, and correlate logs with traces and metrics in the same UI.
- New Relic AI and AIOps. Anomaly detection, automatic incident correlation, and root-cause analysis tied to deployments. Recent additions include "New Relic Knowledge" for contextual troubleshooting and AI-agent observability for LLM-based applications.
- OpenTelemetry-first. Strong native OTel support plus 780+ quickstart integrations.
Why choose New Relic
The free tier is the headline. 100GB of data ingest per month, one full platform user, unlimited basic users, and access to 50+ capabilities. For small teams or early-stage startups, that often covers everything indefinitely. Beyond the free tier, ingest is priced per GB ($0.35 on Original, $0.55 on Data Plus) with no per-host charges. That billing model is the main reason teams escaping Datadog land here: when you turn on monitoring across hundreds of hosts, you do not multiply your bill.
The AI observability work is also notable. New Relic was early to tracing for AI agent and LLM applications, including hallucination tracing and agent-reasoning correlation. If your stack already includes AI workloads, the same platform covers them.
What users say
"The way we monitor our application and analyze performance issues has improved enormously since introducing New Relic, as we get new insights that were hidden from us previously. Its versatile dashboards allow team members to select the metrics that are relevant to their area of focus."
"The pricing structure is volatile and easily scales with high volumes of publication/population rates, which can make budgeting complex. The API also has some advanced functionality only available with the higher-end plans."
The pattern across reviews: praise for the free tier and APM depth, with consistent caution that data ingest costs can become unpredictable at scale. NRQL (the query language) also has a learning curve that some reviewers call steep.
Considerations
User pricing for full platform seats jumps quickly. The first full platform user is free, Core users are $49/user/month for a restricted feature set, and every additional full platform user is $549/user/month at list. Large accounts negotiate that down to roughly $349/user/month on an annual pool commitment, which is not a rate you can pick off the pricing page. For a team where many engineers need full access, this can rival Datadog's host-based bills.
The UI is dense. With many layers, dashboards, and tools surfacing at once, new users frequently describe it as overwhelming until they spend a few weeks in it. Some reviewers also report agent overhead in older versions.
Pricing
- Free: 100GB/month ingest, 1 full platform user, unlimited basic users
- Core user: $49/user/month for a restricted set of capabilities
- Full platform user: $549/user/month at list, around $349/user/month on a negotiated annual pool commitment
- Data ingest: $0.35/GB on Original, $0.55/GB on Data Plus, beyond the free 100GB
- Enterprise: Custom (FedRAMP, HIPAA, advanced SLAs)
- Advanced Compute: pay-per-use CCU model with no/limited user fees
Choose New Relic if
You need APM, distributed tracing, and infrastructure monitoring without the per-host bill multipliers. The free tier alone is enough for many small teams, and the usage-based billing past it scales more predictably than Datadog's modular per-feature pricing. It is also the right pick if you are instrumenting AI or LLM workloads alongside traditional services.
3. Dynatrace: best for enterprise AI root-cause analysis
Perfect for
Large enterprises (often 1,000+ hosts) running complex cloud-native, microservices, or hybrid architectures with mature SRE and platform teams.
Notable features
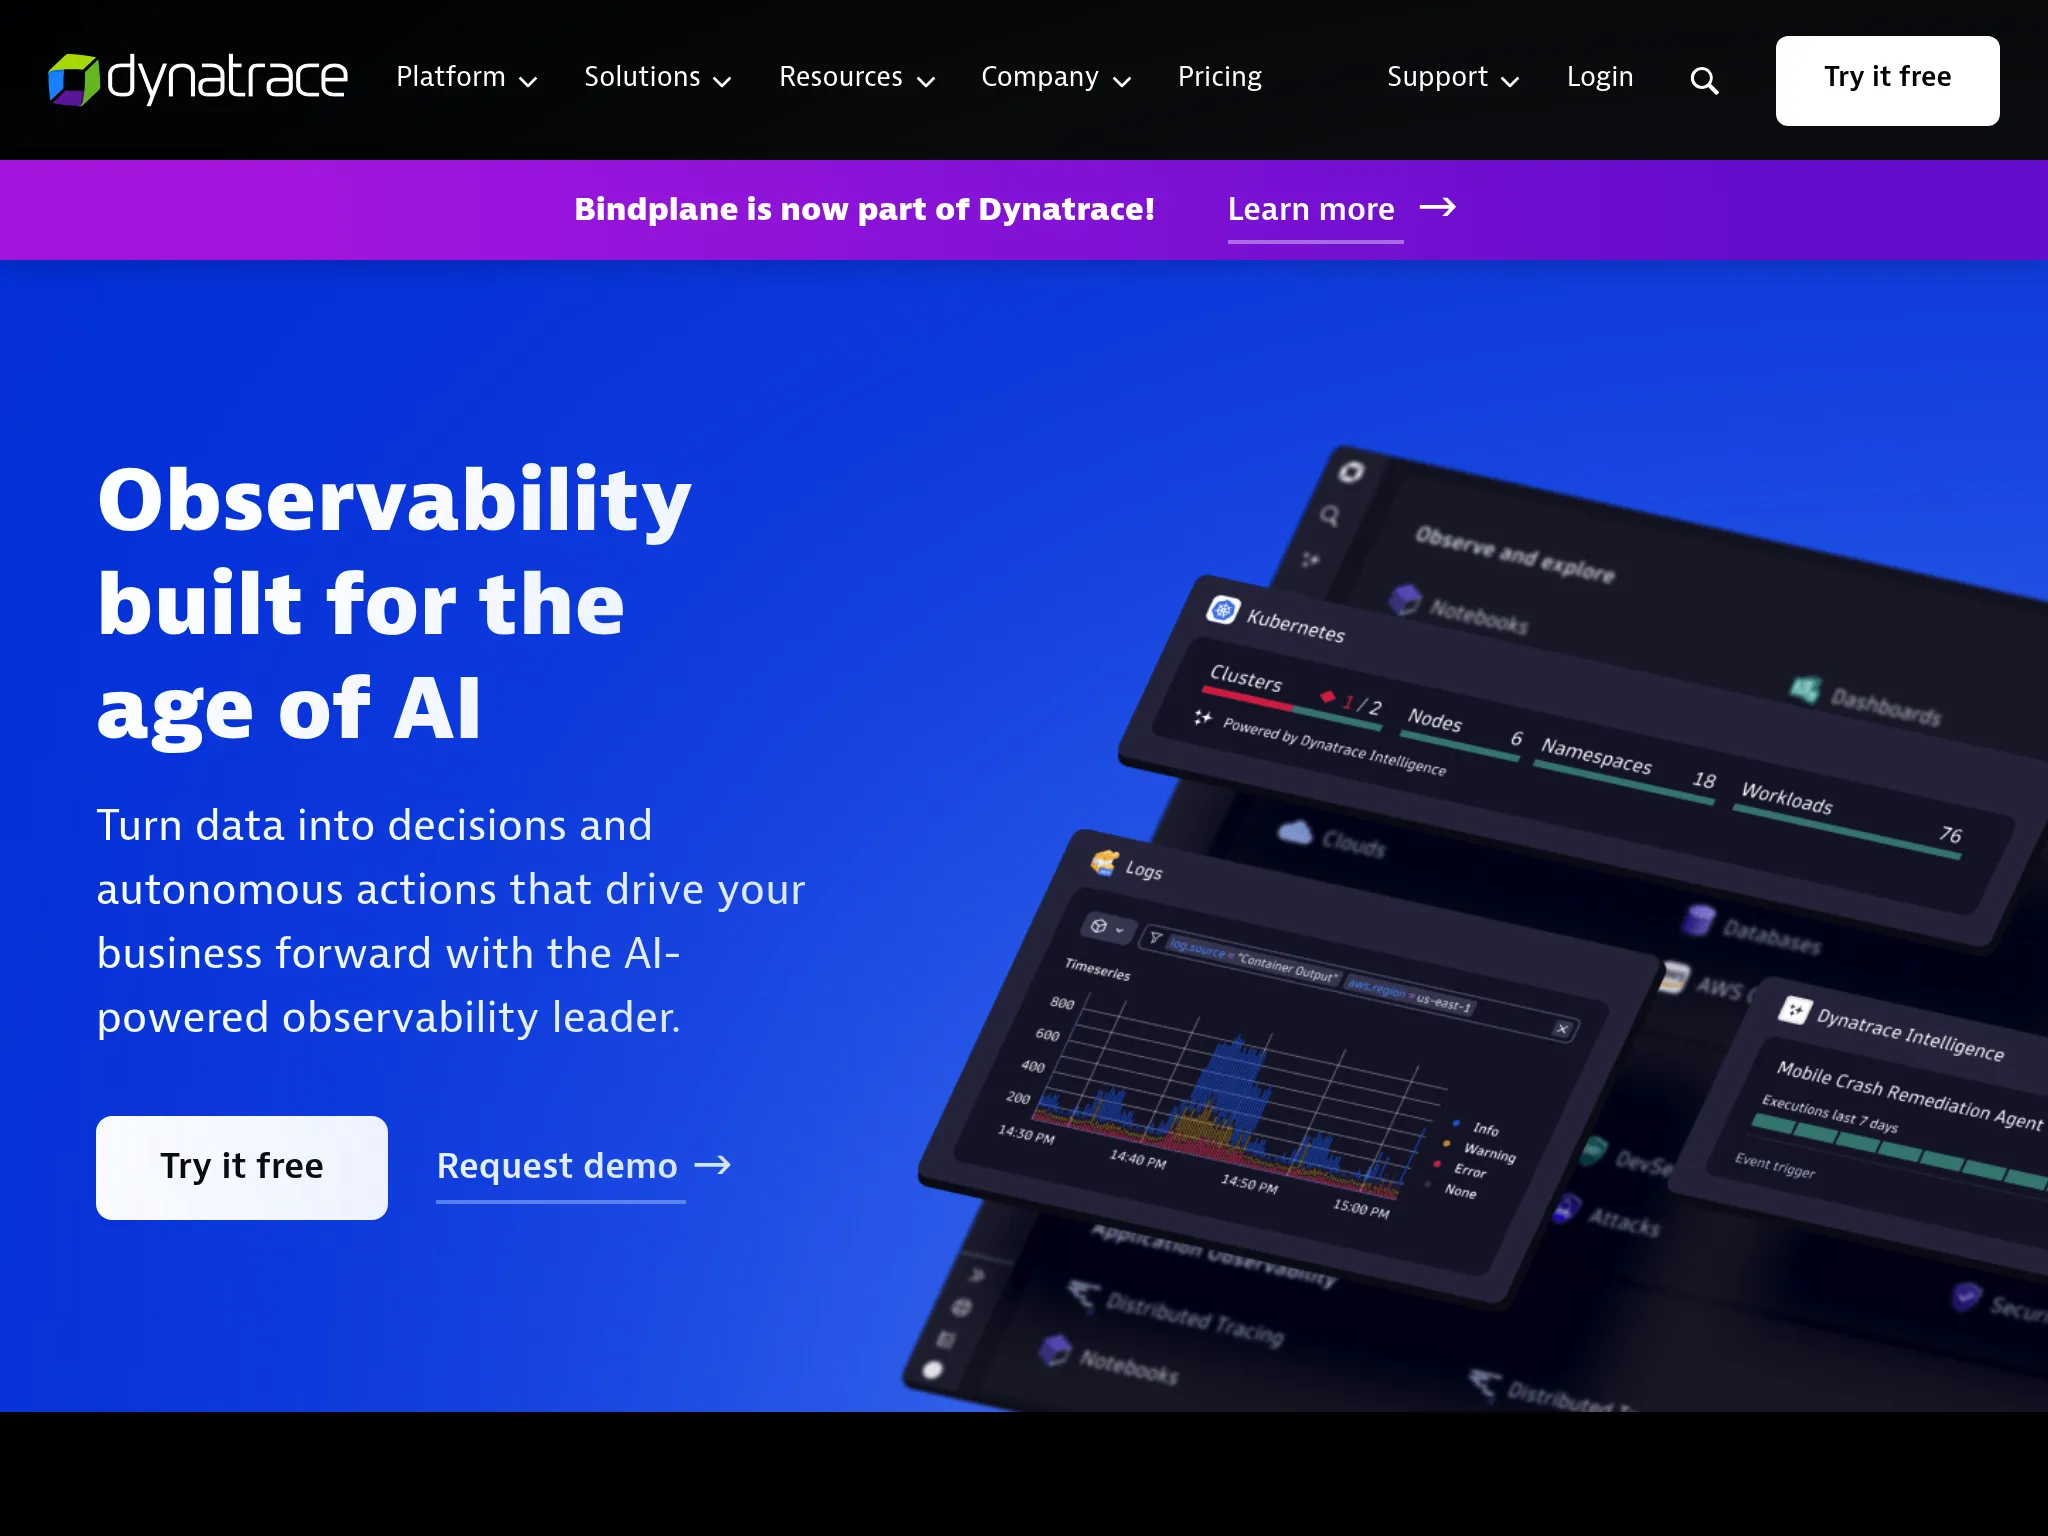
- OneAgent auto-instrumentation. A single agent per host that auto-discovers every service, process, and dependency. No manual instrumentation.
- Davis AI engine. Correlates metrics, logs, traces, and topology into a single root cause with remediation guidance, instead of dumping 40 alerts on your on-call.
- Smartscape topology. Real-time dependency map that updates as your infrastructure changes.
- PurePath distributed tracing. Code-level tracing across microservices.
- Grail data lakehouse. Indexless, schema-on-read storage for observability, security, and business data, queryable in DQL.
- Application security included. Runtime vulnerability detection tied to real application behavior.
Why choose Dynatrace
Davis AI is the main draw. Teams running large, dynamic environments report meaningful reductions in alert volume and MTTR because Davis collapses related signals into one incident with a proposed root cause. If your on-call team is drowning in noise, the AI layer earns its price tag. OneAgent removes the burden of manual instrumentation, which matters when your estate has thousands of services that change daily.
For enterprises in regulated industries (banking, insurance, healthcare), the integration of observability and runtime application security in one platform reduces tool sprawl and audit overhead.
What users say
"The product is marketed to everyone, from execs to designers, marketers, and engineers. That broad appeal helps drive innovation across the enterprise and prevents teams from siloing their technology stack. I also appreciate its 'business process first, technology second' vision."
Dynatrace G2 review, Financial Services, Enterprise
"Unable to migrate between tenants without easily losing data. AI tooling needs to be consistent across all areas of the product. The consumption-based charging model isn't clear, for example what a query actually costs in currency terms, or how it maps to a percentage of the annual commitment."
The recurring theme: the AI and auto-discovery work is genuinely impressive at enterprise scale, but optimizing DPS (Dynatrace Platform Subscription) units becomes its own ongoing job. Reviewers consistently describe the platform as overwhelming for small teams.
Considerations
There is no permanent free tier, only a 15-day trial. For teams with fewer than 100 hosts, Dynatrace is overkill and you are paying for AI features designed for messes you do not have yet. The DPS pricing model decreases per-unit costs as consumption grows, but the trade-off is that small estates pay a premium.
Setup is also heavier than New Relic or Datadog. The platform is opinionated, and getting Davis AI to produce signal-not-noise requires aligning your tagging and topology conventions with how it expects to see them.
Pricing
- Full-stack monitoring: ~$29/host/month at list price (DPS-based, unit prices decrease at scale)
- Logs, synthetics, DEM, and security: metered separately
- No free tier: 15-day trial only
- Tiering: Starter, Professional, Enterprise levels aligned to feature depth and support
Choose Dynatrace if
You have 500+ hosts, a mature SRE team, complex microservices where auto-discovery and AI correlation save real engineering hours, and a budget that accepts enterprise list prices. Skip it for small or mid-sized teams, and skip it if your needs are mostly infrastructure monitoring without APM and security layered on top.
4. Better Stack: best for monitoring plus logs and incident response
Perfect for
Engineering teams that want uptime monitoring, log management, and incident response unified in one developer-first platform with a modern UI.
Notable features
- Uptime monitoring with 30-second checks across 17 global regions. HTTP, SSL, DNS, TCP, UDP, SMTP, POP3, IMAP, and cron/heartbeat monitors. Multi-region verification before alerting.
- Log management at scale. ClickHouse-powered storage, SQL-like querying, real-time tailing, and aggregation that handles up to a billion log lines per second.
- Incident management with on-call. Schedules, escalation policies, AI-assisted post-mortems, Slack and Teams integration.
- Status pages. Public and private, with custom domains and branding.
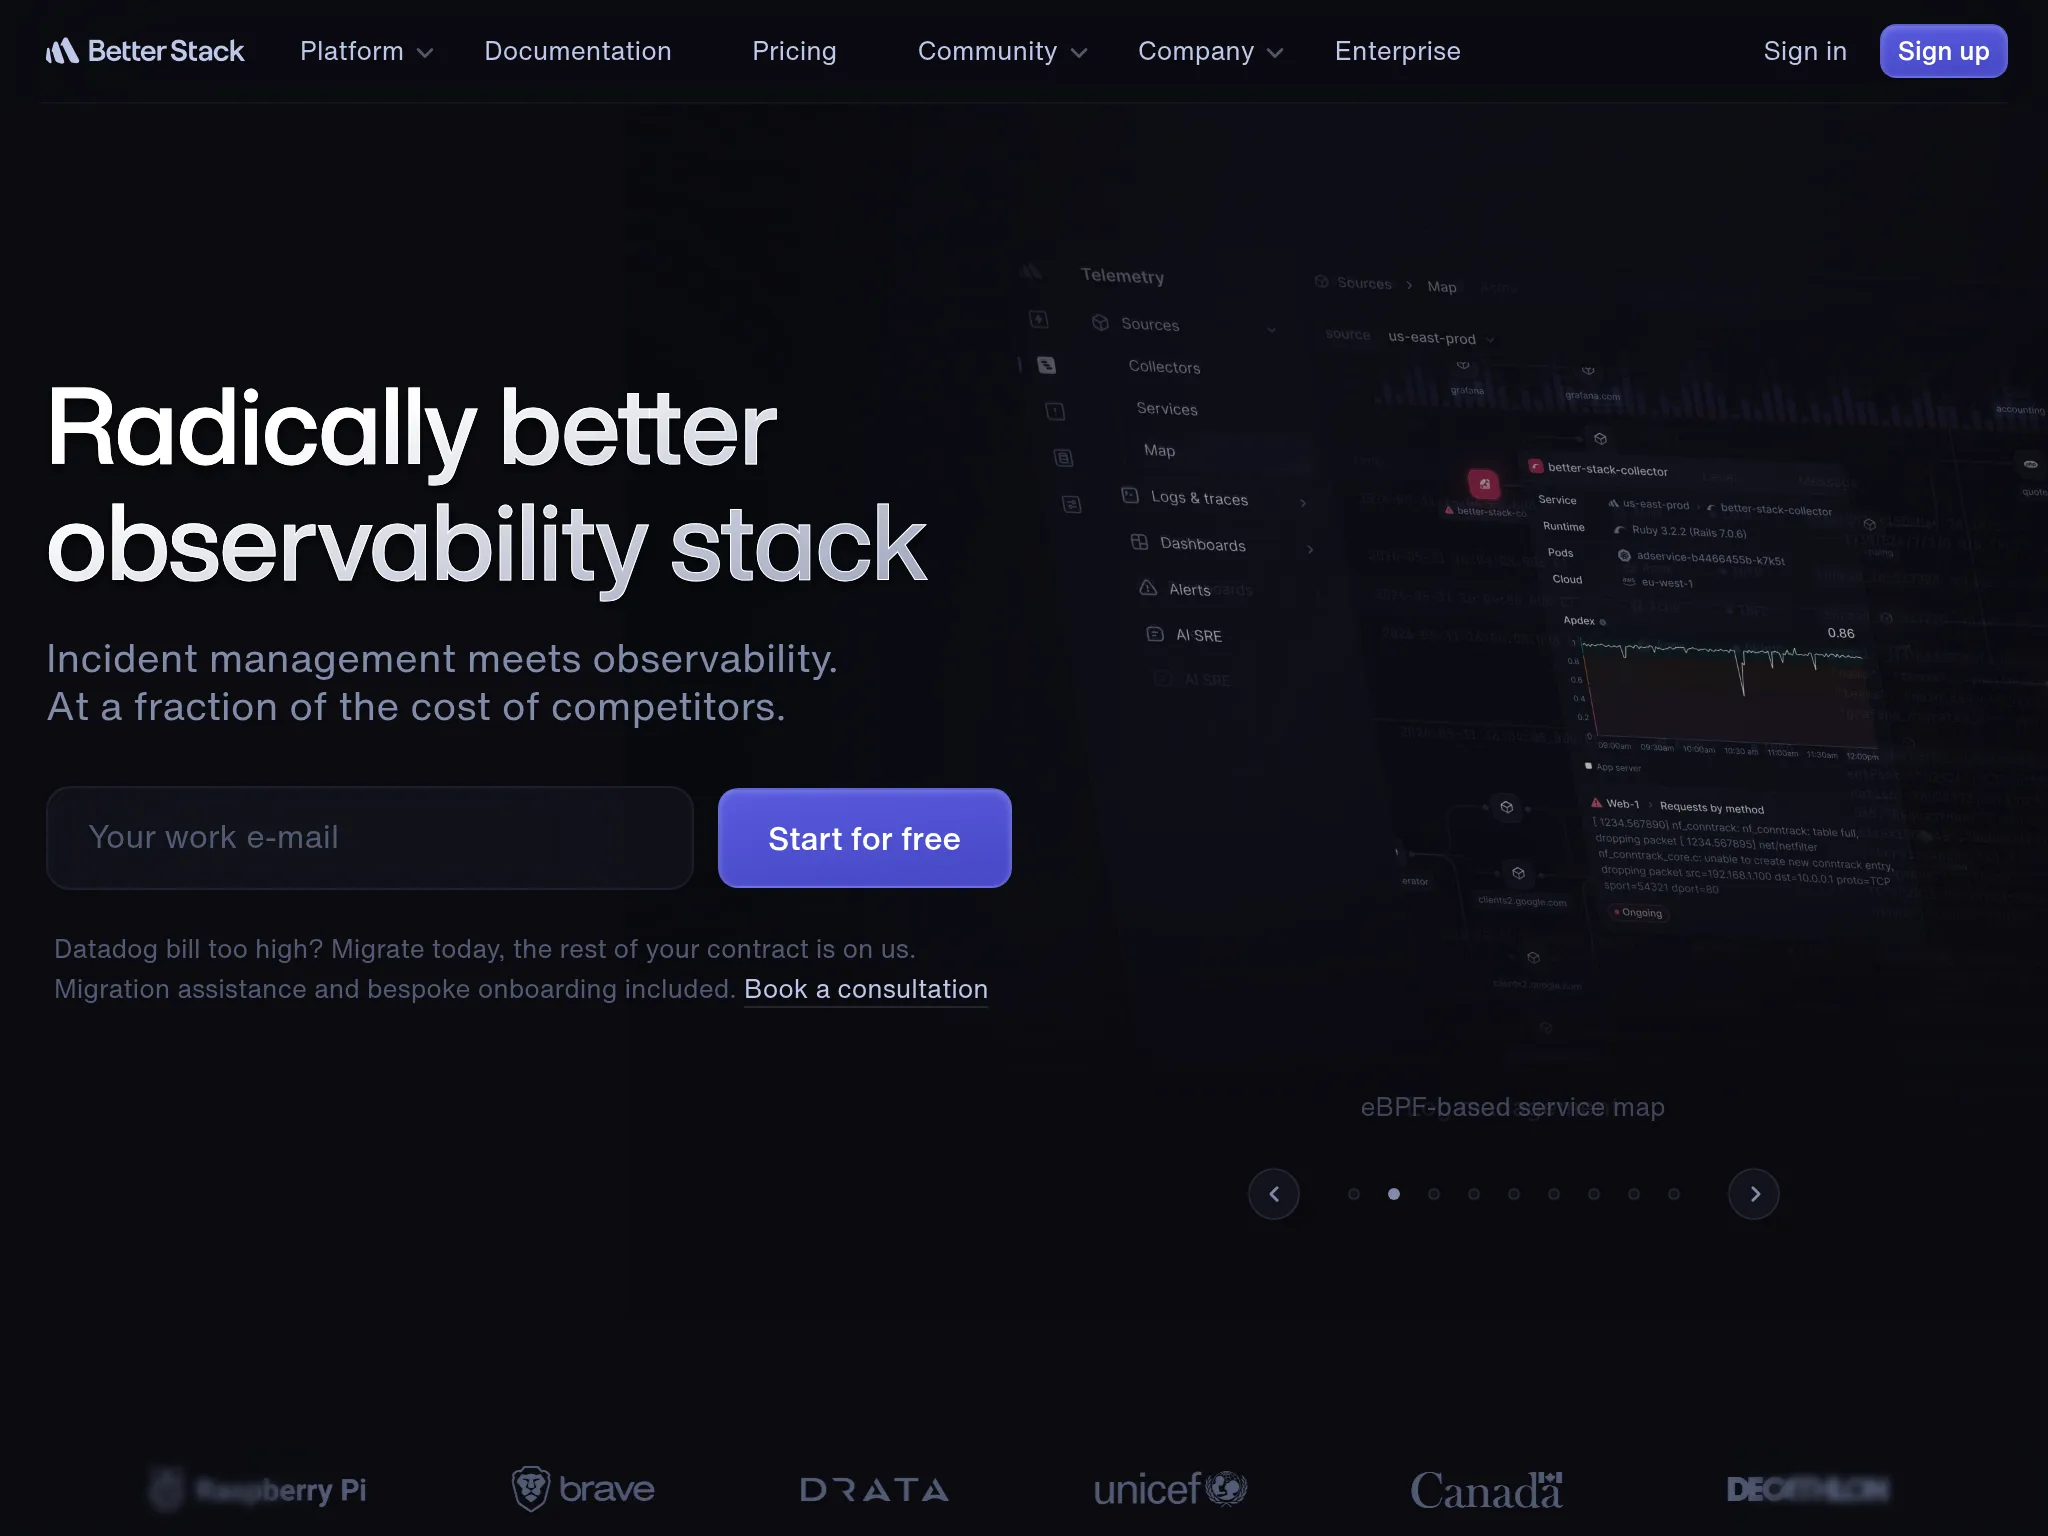
- eBPF-based OpenTelemetry tracing. Auto-instrumentation of services without code changes.
- AI-native incident response. Smart merging for alert noise reduction, with Google Docs-style commenting on logs for team troubleshooting.
Why choose Better Stack
Better Stack is the closest direct competitor to Datadog for SMB and mid-market teams. It covers the same broad surface area (uptime, logs, traces, incidents, status pages) at transparent prices that are typically a fraction of Datadog at the same scale. The UI is consistently praised as modern and developer-first, in contrast to Datadog's dense and feature-heavy interface.
The eBPF-based tracing is a real differentiator for teams that want OpenTelemetry-native APM without manually instrumenting code. ClickHouse for logs gives you the query performance of Datadog's log explorer without the per-GB indexed pricing model.
What users say
"BetterStack Uptime is an excellent tool for monitoring the availability of sites and services in real-time. Its interface is modern, easy to use, and pleasant on a daily basis. The provided diagnostics (screenshots, traceroute, cron job monitoring) really facilitate incident resolution."
"The only downside: the cost can quickly rise if you have many monitors or need advanced integrations. Additionally, some customization features (for example, on status pages) remain limited in the entry-level plans."
"The initial paid tier out the gate starts at $29 which is very steep for the small open source services I run."
The pattern across reviews: strong praise for the UI and the bundled feature set, with consistent feedback that pricing climbs quickly as you stack monitoring, on-call seats, status pages, and logs together. Some users also note dashboard density at 100+ monitors.
Considerations
The modular pricing structure (separate billing for uptime monitors, on-call seats, status pages, and logs) is easy to start small but adds up. A team running 250 monitors, on-call for 5 engineers, 3 status pages, and basic log retention will land north of $250/month, where Hyperping with comparable monitoring and on-call is $74/month.
Self-hosting and deep customization options are limited compared to enterprise tools. For highly regulated workloads, that may be a constraint.
Pricing
- Free: 10 monitors, 1 status page, limited log retention
- Uptime monitoring: $29/month base, scales with monitor count
- On-call: ~$29/user/month
- Status pages: $12/month per additional page
- Logs: starts around $25/month with 30-day retention
- Enterprise: custom with unlimited endpoints and SLA
Choose Better Stack if
You want one developer-first vendor covering monitoring, on-call, logs, and incident response with a polished modern UI, and you accept that the bill grows as you stack products. It is a strong fit for SaaS startups that are growing into full observability and want to avoid stitching together three or four point tools.
Honorable mentions worth knowing
A few tools I considered but did not include in the top four. Each owns a specific niche.
- Honeycomb. Excellent for high-cardinality tracing and query-driven observability. The philosophy explicitly avoids Datadog's metric-pitfalls model. Best for teams debugging distributed systems where you do not know what to ask in advance. Less focus on infrastructure or synthetic monitoring.
- SigNoz. Open-source, OpenTelemetry-native, with a UI similar to Datadog. Self-hosted is free; cloud has a free tier plus paid plans. Reported cost savings of 80 to 90% versus Datadog at scale. Younger ecosystem and fewer enterprise integrations.
- Grafana Cloud / LGTM stack (Loki, Mimir, Tempo, Grafana). The default for Kubernetes-heavy and engineering-driven teams. Generous free tier, paid from ~$49/month. Trade-off: you assemble it yourself.
- Chronosphere. Usage-based pricing focused on telemetry pipelines and cost control (reported savings up to 80%). Acquired by Palo Alto Networks in late 2025, integrating into broader security offerings.
- Splunk Observability Cloud. Strong for log analytics and the security/observability overlap. Complex pricing and high cost for large-scale ingestion.
- Elastic Observability. Search-driven logging and metrics with strong self-hosted options. Resource-intensive to operate at scale.
For Kubernetes teams that want to assemble their own stack, Prometheus + Grafana is the default. Free, flexible, and CNCF-standard, but you operate it yourself (and add Thanos or Mimir for long-term storage, Loki for logs, Tempo for traces).
Open-source picks
If you have engineering time and want zero license cost:
- Prometheus + Grafana for Kubernetes and cloud-native metrics
- SigNoz or Uptrace for OpenTelemetry-native, all-in-one observability
- OpenObserve or Parseable for high-performance, low-cost log and metrics storage
- Zabbix for on-prem and hybrid infrastructure monitoring at scale
- Uptime Kuma for simple uptime checks and a basic status page (homelabs and small teams)
Self-hosting is rarely free in practice. You pay in infrastructure, ongoing maintenance, on-call for the monitoring tool itself, and engineering time for upgrades. The math works best when you already have a dedicated platform or SRE team.
Full list of Datadog alternatives I considered
For completeness, here are the 30+ tools I reviewed before narrowing to the four picks. Pricing is approximate, based on 2025 to 2026 market data, and varies with usage (hosts, GB ingested, events, time-series).
| Name | Main strength | Main weakness | Starting price |
|---|---|---|---|
| Hyperping | Flat-rate, all-in-one for SaaS | Not full APM or trace storage | $24/mo |
| New Relic | Generous free tier, strong APM | NRQL learning curve | Free up to 100GB/mo |
| Dynatrace | Davis AI, OneAgent auto-discovery | Expensive, no free tier | ~$29/host/mo |
| Better Stack | Modern UI, logs + incident in one | Modular pricing adds up | $29/mo |
| Datadog | Broad integrations, polish | Cost at scale | ~$15/host/mo |
| Splunk Observability | Log analytics, security | Complex pricing | Custom |
| Elastic Observability | Search, self-hosted option | Resource-intensive | Free OSS / $95+ cloud |
| Grafana Cloud / LGTM | Visualization, modular | Assembly required | Free / $49+ |
| SigNoz | OpenTelemetry-native, OSS | Young ecosystem | Free OSS / cloud paid |
| Honeycomb | High-cardinality tracing | Less infra focus | Free up to 20M events |
| Chronosphere | Telemetry cost control | Security pivot post-acquisition | Usage-based |
| Prometheus | Kubernetes standard | Needs storage add-ons | Free OSS |
| Zabbix | On-prem at scale | Steep learning curve | Free OSS |
| Nagios XI / Core | Mature network monitoring | Dated UI, weak on traces | Free / thousands/yr |
| SolarWinds Observability | Hybrid IT, network | Brand perception (SUNBURST) | Subscription |
| AppDynamics (Cisco) | Enterprise APM | Complex, opaque | Custom |
| LogicMonitor | AIOps, infrastructure | Opaque pricing | Usage |
| Sumo Logic | Log analytics | UI feels dated | Usage |
| OpenObserve | High-performance OSS logs | Smaller community | Free OSS |
| Uptrace | OpenTelemetry-native OSS | Lesser-known | Free OSS |
| OneUptime | Open-source all-in-one | Early enterprise traction | Free OSS |
| Netdata | Real-time infra metrics | Host-focused | Free OSS |
| Parseable | Object-store logs | Maturing | Free OSS |
| HyperDX | Unified, DX-focused | Smaller presence | Free tier + usage |
| Middleware | LLM/AI observability | Niche | Usage |
| Site24x7 | Uptime + infra, SMB price | Less APM depth | Subscription |
| Groundcover | eBPF, Kubernetes | K8s-focused | Usage/host |
| Dash0 | OpenTelemetry-native | New entrant | Free tier |
| Arize Phoenix | ML/LLM observability | Narrow focus | Free OSS / paid |
| Kloudfuse | Unified observability | Lesser-known | Enterprise |
| ScienceLogic | IT ops AIOps | Traditional ops focus | Subscription |
| ManageEngine | Broad IT suite | UI feels bloated | Tiered |
| Uptime Kuma | Free self-hosted | Single-region, no API | Free OSS |
Source patterns across this list came from 2025 to 2026 analyses by Gartner Peer Insights, vendor pricing pages, comparison write-ups on SigNoz, OneUptime, Uptrace, OpenObserve, and Reddit threads on r/devops, r/sre, and r/Monitoring.
How to choose
Three questions cover most decisions.
Do you mostly need uptime, server health, status pages, and on-call? Hyperping is the predictable flat-rate pick, and the Hyperping vs Datadog breakdown covers the swap feature by feature. The 2026 server agent covers CPU, memory, disk, and network on Linux and macOS hosts. Status pages and on-call are bundled. No per-host bill multiplier.
Do you need real APM and distributed tracing? New Relic if you want the most generous free tier and OpenTelemetry-first design. Dynatrace if you are at enterprise scale with thousands of hosts and want Davis AI to triage incidents for you.
Do you need monitoring plus logs and incident response in one developer-first tool? Better Stack. Modern UI, ClickHouse-backed logs, eBPF tracing. The trade-off is the bill climbs as you stack products.
If you are running a Kubernetes stack and have engineering time, Prometheus + Grafana + Loki + Tempo remains the cheapest path at scale. The cost is operational, not licensing.
Common mistakes when leaving Datadog
A few patterns I saw repeatedly in the Reddit threads.
- Picking a tool that solves today's bill, not next year's stack. Most teams underestimate how much their data volume grows. A tool that is cheap at 20 hosts may not be cheap at 200 if it bills usage-based on logs.
- Underestimating migration cost. Datadog's proprietary instrumentation does not move cleanly to a new vendor. Plan for engineering time on instrumentation rewrites, alert recreation, and dashboard rebuilds. OpenTelemetry-first replacements (New Relic, SigNoz, Uptrace) reduce this but do not eliminate it.
- Forgetting status pages and on-call. Many teams replace Datadog and then realize they were also using Statuspage.io and PagerDuty, each at $200 to $400/month. A bundled tool like Hyperping or Better Stack covers that gap. Datadog alone never did.
- Going fully open source without the headcount. Prometheus, Loki, and Tempo are free as software, not as operations. Without a dedicated platform engineer, the savings disappear into incident time and upgrade churn.
- Treating "all-in-one" as a feature checklist. No replacement matches Datadog's full surface area at the same polish. Pick the slice you actually use daily.
The bottom line
There is no single best Datadog alternative, just the best replacement for the slice of Datadog you actually depend on.
- For uptime, server monitoring, status pages, and on-call in one flat-rate tool: Hyperping.
- For APM and tracing with a free tier that lasts: New Relic.
- For AI-driven root-cause analysis at enterprise scale: Dynatrace.
- For monitoring plus logs and incident response in one developer-first product: Better Stack.
If you want a tool that catches issues from outside your network in 30 seconds, tracks the CPU and memory of every host with a one-line install, and rolls up status pages and on-call in the same subscription, try Hyperping free for 14 days.
Related reading
- Best website monitoring tools: compare the top monitoring platforms
- Best server monitoring tools: covers Datadog, Dynatrace, Hyperping, and OSS picks
- Linux server monitoring guide: CPU, memory, disk, and network on your own hosts
- Server monitoring alert thresholds: where to set CPU, memory, and disk alerts
- Best on-call scheduling tools: pair monitoring with on-call
- Better Stack vs Datadog vs Hyperping: head-to-head comparison
- Best Pingdom alternatives: if you are also evaluating Pingdom
- Best Better Stack alternatives: if Better Stack is on your shortlist
- MTTR guide: measure and reduce mean time to resolution
- Hyperping pricing
FAQ
What is the best Datadog alternative? ▼
The best Datadog alternative depends on what you actually need. For uptime, status pages, on-call, and server monitoring in one flat-rate tool, Hyperping starts at $24/month. For full APM with a generous free tier, New Relic offers 100GB/month free. For enterprise AI-driven root-cause analysis, Dynatrace. For monitoring plus logs and incident response, Better Stack.
Why do teams switch from Datadog? ▼
From the Reddit threads and reviews I read, the dominant reason is pricing. Bills balloon with log ingestion, custom metrics, host counts, and APM spans. Many users report invoices three to ten times what they budgeted. Vendor lock-in through proprietary agents is the second most cited reason.
Is there a free Datadog alternative? ▼
Yes. New Relic has a perpetual free tier with 100GB of data ingest per month and one full platform user. Prometheus plus Grafana is fully open source. SigNoz and Uptrace are OpenTelemetry-native open-source options. Hyperping also has a free plan with 20 monitors, one server agent, and one status page.
What is the cheapest Datadog alternative? ▼
For self-hosted, Prometheus plus Grafana and SigNoz are free if you have the engineering time to run them. For SaaS, Hyperping starts at $24/month with monitoring, status pages, on-call, and server agents included. New Relic's free tier covers most small teams indefinitely.
Is Datadog worth the cost? ▼
For teams running 50+ hosts with distributed microservices that actively use APM, logs, and metrics together, yes. For teams that mostly need uptime monitoring, server health, or status pages, Datadog is overkill and the bill grows faster than expected as log volume and custom metrics climb.