The best server monitoring tools depend on what you actually need to watch. If you want unified metrics, logs, and traces in one SaaS, Datadog wins. For AI-driven root-cause analysis at enterprise scale, Dynatrace is the pick. If you want uptime monitoring, server monitoring, status pages, and on-call scheduling at a predictable monthly rate, Hyperping is the best value. For Windows-heavy networks, PRTG. For hybrid IT with deep plugin coverage, Checkmk. For open-source flexibility, Zabbix. For Kubernetes and cloud-native metrics, Prometheus + Grafana. For homelabs and small teams who want a free self-hosted uptime tracker, Uptime Kuma.
I analyzed 20+ tools and picked these eight based on hundreds of G2 reviews, Reddit threads from r/sysadmin, r/devops, and r/homelab, and product analyses from Perplexity research.
In this guide you'll learn:
- Who each tool is built for (team size, stack, budget)
- What sysadmins actually complain about on Reddit (alert fatigue, pricing surprises, steep learning curves)
- Honest pricing with real numbers for a 100-server setup
- Which tool fits your deployment model (SaaS, self-hosted, or hybrid)
If you want uptime checks, host-level server metrics, beautiful status pages, and on-call scheduling in one tool, Hyperping covers all four. Start a free trial to see it in action.
Key takeaways
- Datadog is the most complete SaaS observability platform, starting at $15/host/month, with the tradeoff that log ingest, APM, and custom metrics make costs hard to predict.
- Dynatrace delivers the strongest AI-powered root-cause analysis through its Davis engine and OneAgent, aimed at enterprises with 100+ hosts and usage-based pricing starting around $29/host/month.
- Hyperping is the best value for teams that want uptime checks, lightweight server monitoring, status pages, and on-call in one tool, starting at $24/month yearly with paid plans including 5, 20, or 100 server agents.
- PRTG is the go-to for Windows-heavy networks and small-to-mid IT departments, with sensor-based licensing starting at $1,899 perpetual.
- Checkmk fits hybrid IT shops with 2,000+ plugins and service-based pricing around $225/month for a 100-host estate.
- Zabbix is free, open-source, and powerful for on-prem and network monitoring, but requires real in-house expertise to operate at scale.
- Prometheus + Grafana is the default metrics stack for Kubernetes and cloud-native workloads, free to self-host but operationally heavy.
- Uptime Kuma is the best free self-hosted option for homelabs and small teams that only need uptime checks and a simple status page.
Why you can trust this guide
I'm Léo, founder of Hyperping. Yes, I have a stake in one of these tools. My goal here is not to convince you Hyperping is always the answer. It rarely is. Server monitoring is a broad category, and Hyperping now covers external checks, host-level server metrics, status pages, and on-call. For logs, APM, distributed tracing, or deep network monitoring, other tools on this list are better fits, and I say so below.
To build this guide I read product analyses for each tool, pulled quotes from G2, TrustRadius, and community reviews, and cross-referenced criteria against Reddit threads where practicing admins share what works and what does not. Key threads I leaned on:
- What do you prefer as monitoring software/system? (r/sysadmin)
- How are you actually handling observability in 2025? (r/devops)
- What infrastructure monitoring tools are you using right now? (r/Monitoring)
- Zabbix, Nagios... vs PRTG (r/sysadmin)
- What is your favorite host monitoring tool and why? (r/devops)
- Recommend a monitoring solution (r/homelab)
Where I could not test a tool directly, I said so and relied on verified user feedback.
Top picks at a glance
| Best for | Product |
|---|---|
| All-in-one SaaS observability (metrics + logs + APM) | Datadog |
| Enterprise-scale AI root-cause analysis | Dynatrace |
| Uptime + server monitoring + status pages + on-call | Hyperping |
| Windows-heavy networks and mid-market IT teams | PRTG |
| Hybrid IT with broad plugin coverage | Checkmk |
| Open-source, self-hosted, on-prem monitoring | Zabbix |
| Kubernetes and cloud-native metrics | Prometheus + Grafana |
| Free self-hosted uptime checks for homelabs and small teams | Uptime Kuma |
What to look for in a server monitoring tool
From the Reddit threads I read, the criteria that come up the most often are not flashy features. They are the boring fundamentals that stop working well when you scale.
- Low-noise alerting. Alert fatigue is the number one complaint across r/sysadmin and r/devops. Look for root-cause correlation, auto-retry before alerting, and tunable thresholds. One r/Monitoring commenter put it bluntly: "The tool matters less than how you wire the alerting together."
- Predictable pricing. Datadog and New Relic dominate the "too expensive" complaints in r/devops observability threads. Usage-based billing on metrics, logs, and hosts adds up faster than teams expect. Flat-rate plans or transparent per-host pricing prevent bill shock.
- Broad coverage with minimal setup. CPU, RAM, disk, network, services, processes, plus custom metrics and integrations with your existing stack (OpenTelemetry, cloud providers). Auto-discovery and templates save hours.
- Dashboards worth looking at. Grafana gets name-dropped constantly for a reason. Historical trends matter as much as real-time data, especially for capacity planning.
- Fit for your environment. Windows-heavy shops love PRTG. Linux and containerized shops lean Prometheus or Zabbix. Hybrid shops want Checkmk. Pick a tool built for your reality, not the one with the best demo.
- Alert channels that work. Slack, Teams, PagerDuty, SMS, email, webhooks. Not just available, but actually well integrated.
One recurring theme: no single tool is perfect. Many teams run hybrid stacks, for example Prometheus for Kubernetes metrics plus Hyperping for external checks, host metrics, status pages, and on-call. The goal is not one tool to rule them all, it's the right tool for each layer.
Why these 8 tools made the cut
I considered 20+ tools including New Relic, AppDynamics, LogicMonitor, SolarWinds SAM, Nagios, LibreNMS, Sematext, Better Stack, and Netdata. Many fell short for specific reasons:
- Too narrow. Better Stack is strong on logs and uptime but does not cover server metrics like CPU or memory at the agent level.
- Legacy baggage. Nagios gets called "outdated" and "a joke" in multiple r/sysadmin threads. Config is painful, the UI feels dated, and teams are actively migrating off.
- Opaque pricing. LogicMonitor requires a sales call to get a number. That's a non-starter when you are evaluating options.
- Redundant with stronger picks. Sematext and Netdata are fine tools, but Uptime Kuma covers the free self-hosted niche better for uptime, and Datadog covers the full-stack SaaS niche better for observability.
The eight tools below each own a specific use case that the others cannot match.
Feature comparison table
| Feature | Datadog | Dynatrace | Hyperping | PRTG | Checkmk | Zabbix | Prometheus+Grafana | Uptime Kuma |
|---|---|---|---|---|---|---|---|---|
| Deployment | SaaS | SaaS | SaaS | Self-host/SaaS | Self-host | Self-host | Self-host/SaaS | Self-host |
| Agent or agentless | Agent | OneAgent | Agent + external | Mostly agentless | Both | Both | Exporters (pull) | None needed |
| Metrics (CPU/RAM/disk) | Yes | Yes | Yes (host metrics) | Yes | Yes | Yes | Yes | No |
| Logs | Yes | Yes | No | Limited | Yes (basic) | No | No (pair w/ Loki) | No |
| APM / traces | Yes | Yes (PurePath) | No | No | No | No | Pair w/ Tempo | No |
| External / synthetic checks | Yes | Yes | 18 regions | Limited | Limited | Limited | No | 1 location |
| Status pages built-in | No | No | Yes | No | No | No | No | Yes |
| On-call scheduling | No (add PagerDuty) | No | Yes | No | No | No | No | No |
| Kubernetes support | Strong | Strong | Host-level only | Moderate | Good | Good | De facto standard | Basic (Docker) |
| Windows support | Yes | Yes | No agent yet | First-class | Yes | Yes | Limited | Yes |
| Free tier | 5 hosts, 1-day | 15-day trial | Yes (20 monitors, 1 server) | Free 100 sensors | Yes (OSS) | Yes (OSS) | Yes (OSS) | Yes (OSS) |
Pricing comparison (as of April 2026)
Below is what a realistic 100-host or 100-monitor setup costs across the eight tools. Numbers are monthly unless noted.
| Tool | Starting price | 100-host/monitor estimate | Pricing model |
|---|---|---|---|
| Hyperping | $24/mo yearly | $249/mo yearly (Business, 100 server agents) | Flat-rate tiers + extra servers |
| Uptime Kuma | Free | Free + your infra | Open source, self-hosted |
| Zabbix | Free | Free + your infra | Open source, self-hosted |
| Prometheus+Grafana | Free | Free + your infra | Open source, self-hosted |
| Checkmk | ~$225/mo | ~$225/mo | Service-based, self-hosted |
| Datadog | $15/host/mo | $1,500/mo (infra only) | Per-host + usage-based add-ons |
| Dynatrace | ~$29/host/mo (full-stack) | ~$2,880/mo | Consumption-based (DPS units) |
| PRTG | $1,899 perpetual | $3,599 perpetual (PRTG 1000) | Sensor-tiered perpetual license |
The jump from self-hosted OSS to commercial SaaS is real. For the same 100 hosts, you are looking at $0 to $150 of server costs for OSS, $249/month for Hyperping Business paid yearly, or $1,500+ monthly for Datadog or Dynatrace. That's not a reason to pick OSS, it's a reason to pick the right tier for your stack. For your own host count, the server monitoring cost calculator compares Datadog, New Relic, Netdata, and Hyperping side by side.
Datadog: best for unified SaaS observability (metrics, logs, APM)
Perfect for
Mid-market and enterprise teams running cloud-native or microservices architectures that need metrics, logs, traces, and security monitoring correlated in one place.
Notable features
- Unified observability. Metrics, logs, traces, RUM, and Cloud SIEM under one UI, with one-click pivots between them.
- 650+ pre-built integrations. AWS, Azure, GCP, Kubernetes, databases, CI/CD tools. Agent installation is usually under 5 minutes.
- Watchdog AI. Automatic anomaly detection that surfaces issues without hand-tuned thresholds.
- Bits AI SRE agent. Autonomous incident investigation that correlates signals across the stack.
- APM with code-level tracing. Pinpoint slow methods, database calls, and service dependencies.
Why choose Datadog
Datadog replaces the "tool sprawl" stack (Sentry + self-hosted ELK + Grafana + Jaeger + OpsGenie) with a single product. When an alert fires, you can go from metric spike to related log entry to the exact trace in the same session. For complex distributed systems, that correlation speed matters.
Where Datadog falls short
Cost. This is the most consistent complaint I saw in Datadog G2 reviews and r/devops observability threads. "Pricing can ramp up quickly" is the polite version. Custom metrics, log ingestion, APM spans, and support fees (8% of spend, $2,000 minimum) add real cost on top of the $15/host/month sticker. Several Alma engineers told me Datadog's per-check pricing is what drove them to add Hyperping as a cheaper redundant monitoring layer.
The UI is also dense. New users report feeling overwhelmed until they spend time with it.
Pricing
- Pro: $15/host/month (annual) or $18 on-demand. Infrastructure monitoring, 15-month retention, 650+ integrations.
- Enterprise: $23/host/month (annual). Adds ML alerts, extended log retention, compliance tooling.
- APM: $31/host/month additional. Log management: $0.10/GB ingested + $1.70 per million events indexed.
Is Datadog right for you?
Choose Datadog if you're running 50+ hosts, have distributed microservices, and need to correlate metrics, logs, and traces daily. Skip it if your primary need is "is the server up?" or if your budget cannot absorb usage-based bills that scale with log volume.
Dynatrace: best for enterprise-scale AI root-cause analysis
Perfect for
Large enterprises (1,000+ hosts, often 1B+ in revenue) running complex cloud-native or hybrid architectures, with mature SRE and platform teams.
Notable features
- OneAgent auto-instrumentation. One agent per host discovers every service, process, and dependency automatically. No manual instrumentation.
- Davis AI. Correlates across metrics, logs, traces, and topology to surface a single root cause, not 40 alerts.
- Smartscape topology. Real-time dependency map that updates as your infra changes.
- PurePath tracing. Code-level distributed tracing across microservices.
- Integrated application security. Runtime vulnerability detection inside the same platform.
Why choose Dynatrace
The Davis AI engine is the main draw. Teams running large dynamic environments report meaningful reductions in alert volume and MTTR because Davis rolls up related signals into one incident with a proposed root cause. If you have more alerts than your on-call team can read, Dynatrace's AI layer earns its price tag.
Where Dynatrace falls short
Pricing is usage-based and opaque until you engage sales. There is no free tier, only a 15-day trial. For teams with fewer than 100 hosts, Dynatrace is overkill and you're paying for AI features designed for messes you do not have yet. Several Dynatrace G2 reviewers mention optimizing DPS (Dynatrace Platform Subscription) units becomes its own ongoing job.
Pricing
- Usage-based via Dynatrace Platform Subscription (DPS). Unit prices decrease as consumption grows.
- Full-stack monitoring is typically around $29/host/month at list price.
- Logs, synthetics, and digital experience monitoring are metered separately.
Is Dynatrace right for you?
Choose Dynatrace if you have 500+ hosts, a mature SRE team, and complex microservices where auto-discovery and AI correlation save real engineering hours. Skip it if you are a small or mid-size team, or if you mostly need infrastructure monitoring without APM and security layered on top.
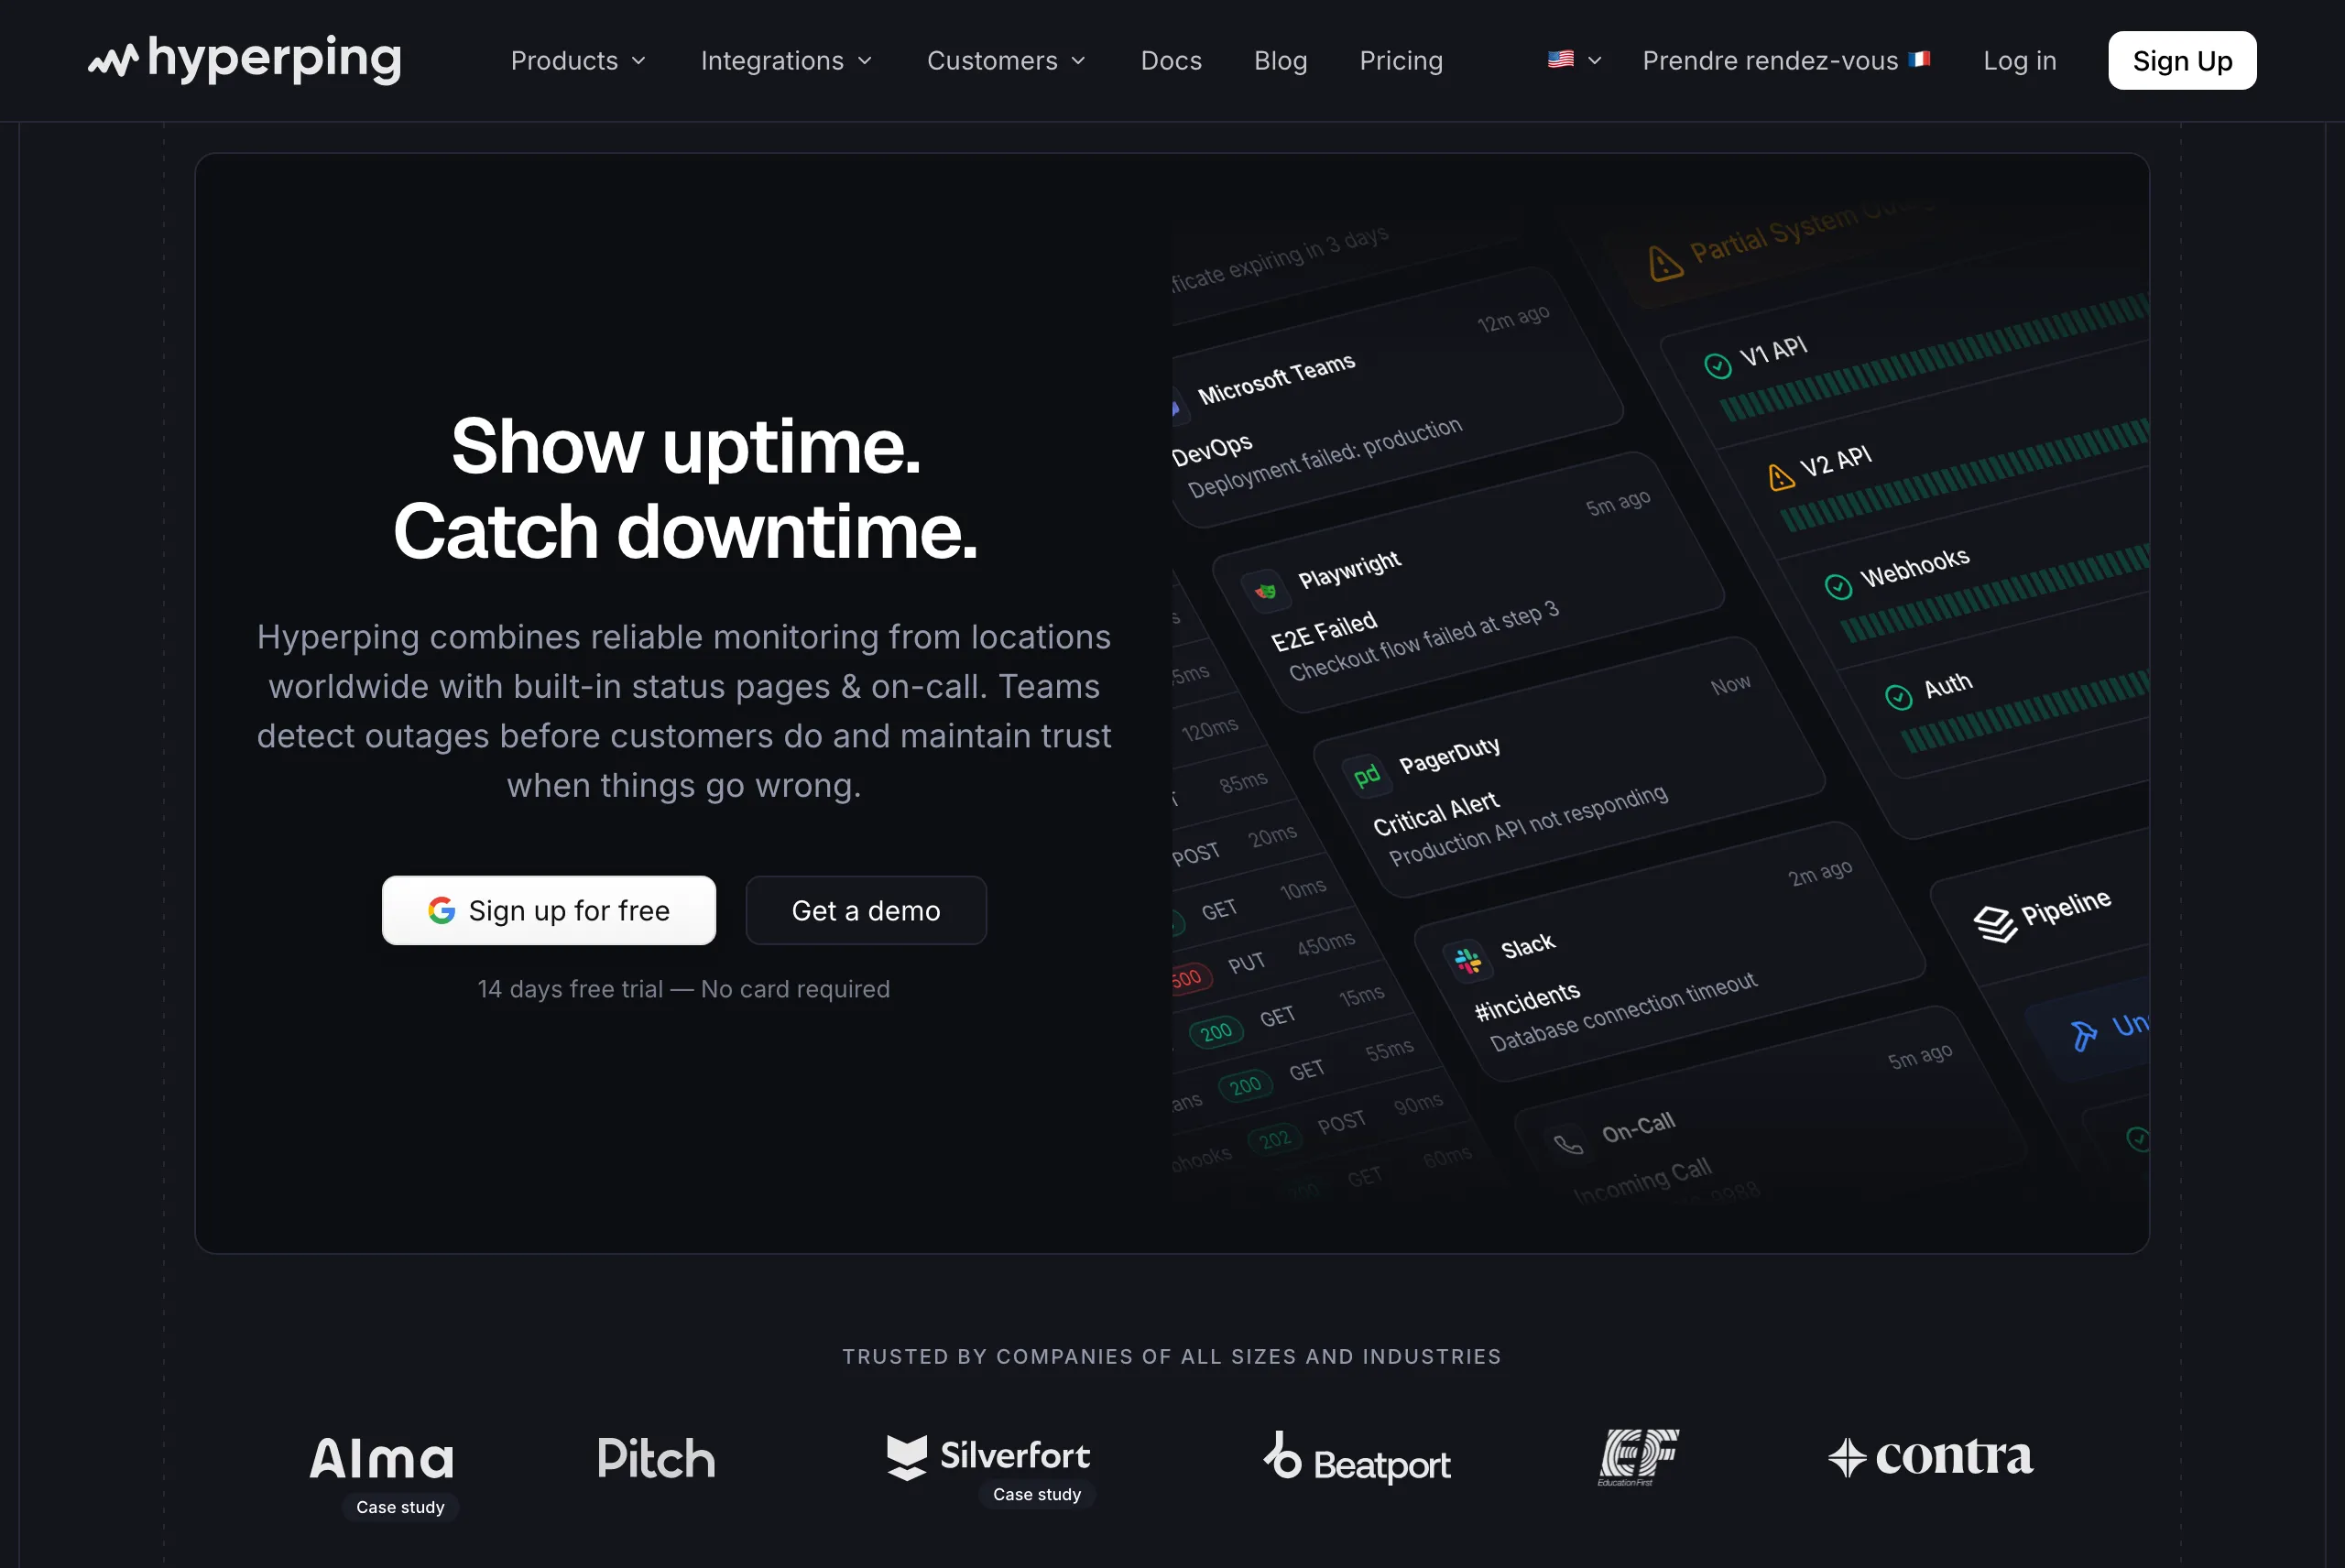
Hyperping: best for uptime, server monitoring, status pages, and on-call
Perfect for
Startups, SMBs, and growing SaaS teams that need external uptime checks, host-level server metrics, polished status pages, and on-call scheduling in one tool without unpredictable bills.
Notable features
- External monitoring from 18 global regions. Catch issues from your customers' perspective, not just from inside your VPC.
- Lightweight server monitoring agent. Install the agent on Linux or macOS hosts to stream CPU, load averages, memory, filesystem, disk I/O, network throughput, uptime, and host metadata into Hyperping.
- 30-second scrape cadence. The agent embeds an OpenTelemetry collector for host metrics and sends them over OTLP/HTTP. The dashboard usually updates a few seconds after each scrape.
- On-disk metric queue. Unsent batches are queued to disk and retried automatically, so short network blips, reboots, or ingest outages do not create immediate graph gaps.
- Server alerting through the same on-call flow. A server goes stale when metrics stop arriving, then offline after its threshold. That outage can trigger the same escalation policies as HTTP monitors.
- Playwright-based synthetic monitoring. End-to-end browser checks for login, checkout, and other critical flows.
- Full-featured status pages included. Public and private pages, custom domains, white-label branding, SSO protection, multi-language support, component grouping. No per-page fees.
- On-call scheduling and escalation policies. Timezone-aware rotations, automatic handoffs, multi-step escalation. Not something you usually see in "simple" monitoring tools.
- Auto-retry before alerting. Verifies failures from multiple regions before waking anyone up, which cuts false positives significantly.
- Multi-channel alerting. Slack, Teams, Discord, Telegram, PagerDuty, OpsGenie, SMS, voice calls, webhooks.
- EU hosting. GDPR-compliant, all data stored in EU data centers.
Why choose Hyperping
Predictable pricing. This is the main reason teams pick Hyperping over Better Stack, Datadog, or PagerDuty + Statuspage combos. A 100-monitor, 5-seat, 3-status-page setup is $74/month on Hyperping when paid yearly. A 100-server setup fits the Business plan at $249/month yearly or $299/month monthly. Datadog infrastructure monitoring alone starts around $1,500/month for 100 hosts, before logs, APM, or status pages.
Four tools in one. Uptime monitoring, server monitoring, status pages, and on-call scheduling are all in the same product. That's usually multiple SaaS bills, for example UptimeRobot + Statuspage.io + PagerDuty + an infrastructure monitoring tool.
Inside and outside context on one timeline. HTTP monitoring tells you a request failed from the outside. The Hyperping server monitoring agent tells you what the host was doing at that moment: CPU saturation, memory pressure, a full filesystem, disk I/O, or network throughput changes. That makes Hyperping more useful for small and mid-sized teams that do not want to keep a separate metrics dashboard open during every incident.
External perspective that complements internal monitoring. Alma, a French fintech processing millions of BNPL transactions, uses Hyperping as an independent safety net alongside their primary Datadog stack. Their SRE Fabrice Gregoire told me:
"Hyperping's reputation in our company is that it's more reactive than Datadog. We usually get notifications from Hyperping before Datadog. It's useful as a fallback, a lighter backup monitoring solution. It allows us to track Datadog's status page and see if Datadog itself goes down."
"Datadog charges per check. You [Hyperping] have a package, that's better. Pay per use is annoying and expensive."
Read the full Alma case study →
Where Hyperping falls short
Hyperping is not a full observability platform. You get uptime checks, synthetic checks, host-level server metrics, status pages, and on-call. You do not get integrated logs, APM, distributed tracing, service maps, or runtime security telemetry.
The server monitoring agent is also focused on host-level metrics today. It supports Linux with systemd and macOS with launchd on amd64 and arm64. Windows support is not available yet. Per-process CPU and memory, per-container and per-pod metrics, swap/paging, packet errors, and dropped-packet counters are not ingested today. The server monitoring docs and metrics collected reference list the current fields and units.
The synthetic monitoring is solid but less mature than Datadog's. If you need 50-step browser flows with complex assertions, a dedicated synthetic tool may be a better fit.
Reporting is more basic than Uptime.com's SLA reporting module.
What users say
"Hyperping has been a total game-changer for us. The service is reliable, easy to use, and incredibly feature-rich."
"We made our Hyperping status page publicly available and it became a crucial part of our sales pitches. We are proud of our uptime and we love that we can share it with prospects."
Pricing
- Free: 20 monitors, 1 status page, 1 server agent, 2 days of metric history
- Essentials: $24/month yearly or $29/month monthly for 50 monitors, 1 status page, 3 browser checks, 2 seats, 5 server agents, 7 days of metric history
- Pro: $74/month yearly or $89/month monthly for 100 monitors, 3 status pages, 10 browser checks, voice call alerts, 5 seats, 20 server agents, 14 days of metric history
- Business: $249/month yearly or $299/month monthly for 1,000 monitors, 10 status pages, 25 browser checks, 15 seats, 100 server agents, 30 days of metric history
- Additional servers: $2/month each on Essentials and Pro, $1.50/month each on Business
Paid plans include server alerting, on-call scheduling, and escalation policies. See the pricing page for the current plan table.
Is Hyperping right for you?
Choose Hyperping if you want uptime checks, server health metrics, status pages, and on-call without juggling several vendors or watching your bill climb every quarter. It's particularly strong for:
- European companies that value GDPR compliance and EU data hosting
- Teams that use their status page as a sales and trust asset
- Teams that want CPU, memory, filesystem, disk I/O, and network metrics next to their HTTP monitor history
- SRE teams that want an independent safety net alongside Datadog or similar
- Startups that do not need logs, APM, or distributed tracing yet
PRTG: best for Windows-heavy networks and mid-market IT
Perfect for
Small to mid-market IT departments, especially Windows-heavy environments, and MSPs monitoring multiple customer networks from one console.
Notable features
- Sensor-based monitoring. Each metric is a sensor (bandwidth, CPU, disk, HTTP check). Hundreds of sensor types built in.
- Auto-discovery. Scans subnets and builds monitoring automatically.
- Agentless by default. Uses SNMP, WMI, SSH, NetFlow, HTTP, and REST APIs. One Windows server can monitor thousands of sensors.
- Visual NOC maps. Drag-and-drop designer with 300+ map objects for custom dashboards.
- Distributed probes. Multi-site monitoring from a central console, popular with MSPs.
- AI-assisted anomaly detection. Recent addition to surface issues without manual thresholds.
Why choose PRTG
PRTG is the most frequently praised tool in the r/sysadmin Zabbix vs PRTG thread for Windows environments and mid-size teams that want one tool for servers, network, applications, and traffic analysis. Setup is famously quick. Auto-discovery gets you monitoring in under an hour for most SMB networks.
Where PRTG falls short
Sensor-based licensing gets expensive as you add metrics per device. The PRTG 500 tier ($1,899) covers roughly 50 devices, and you're pushed up the ladder quickly. Some reviewers on TrustRadius note the core server is Windows-only, which is a hard no for Linux-first shops.
It's also primarily a monitoring tool. No config management, no patching, limited log management. You'll pair it with other tools for those.
Pricing
- PRTG 500: $1,899 perpetual (500 sensors, ~50 devices)
- PRTG 1000: $3,599 perpetual (1,000 sensors, ~100 devices)
- PRTG 2500: $7,399 perpetual
- PRTG 5000: $12,999 perpetual
- PRTG XL: $16,899 perpetual (10,000 sensors, ~1,000 devices)
- Hosted SaaS tiers available at similar sensor counts.
Is PRTG right for you?
Choose PRTG if you run a Windows-heavy network, have 50 to 500 devices, and want one tool that covers servers, network, bandwidth, and cloud. Skip it if you are Linux-first, cloud-native, or already invested in Grafana-style dashboards.
Checkmk: best for hybrid IT with deep plugin coverage
Perfect for
Mid-size and large enterprises with hybrid IT estates (on-prem data centers plus cloud) that want strong control over a self-hosted monitoring stack.
Notable features
- 2,000+ vendor-maintained plugins. Covers enterprise hardware, databases, hypervisors, cloud services, containers.
- Agent Bakery and auto-discovery. Rule-based configuration and automated agent updates reduce manual setup significantly vs Nagios.
- Distributed and multi-site. Single pane of glass across many sites with HA support.
- Integrated log and event monitoring. Syslog, SNMP traps, Windows event logs in the event console.
- SLA reporting and capacity planning. Business-facing reports for IT leadership.
Why choose Checkmk
Checkmk hits a middle ground between Nagios-style control and Datadog-style usability. You get enterprise depth (plugin coverage, HA, distributed setups) without the SaaS lock-in or usage-based billing. For hybrid shops that refuse to put production metrics in someone else's cloud, Checkmk is the serious pick.
Where Checkmk falls short
The UI is better than Nagios but still feels dense compared to modern SaaS platforms. Observability depth (APM, distributed tracing, advanced ML) is behind cloud-native tools like Datadog. Service-based pricing can be confusing to size and may become expensive for metric-dense environments. Checkmk G2 reviewers note dashboards can feel overwhelming for smaller teams.
Pricing
- Raw Edition (OSS): Free, self-hosted, core monitoring capabilities.
- Enterprise Edition: ~$225/month (or ~€2,100/year) for 3,000 services (~100 hosts).
- Ultimate Edition: ~€3,300 to €3,600/year for 3,000 services with multi-tenancy.
- Custom tiers for 30,000+ services.
Is Checkmk right for you?
Choose Checkmk if you run hybrid IT, want on-prem control, have 200+ hosts, and need broad plugin coverage. Skip it if you are fully cloud-native (Prometheus is a better fit) or need APM and log analytics in the same tool (Datadog covers that).
Zabbix: best for open-source on-prem and network monitoring at scale
Perfect for
Mid-size to large organizations with on-prem or hybrid infrastructure, MSPs needing multi-tenant on-prem monitoring, and teams with in-house ops expertise.
Notable features
- Fully open-source, no feature gating. HA, proxies, templates, and multi-tenancy are included in the free core.
- Massive protocol coverage. SNMP, IPMI, JMX, HTTP, ICMP, Modbus, MQTT, Prometheus endpoints, VMware, and more.
- Flexible trigger expressions. Complex conditions over historical data, not just simple thresholds.
- Distributed monitoring via proxies. Proxy groups with auto load-balancing and failover.
- Large template library. Official and community templates for Linux, Windows, databases, network gear, cloud.
Why choose Zabbix
The most common sentiment in the r/sysadmin monitoring thread about Zabbix: it can monitor just about anything. For on-prem-heavy shops with legacy gear, SNMP devices, and hybrid setups, it's the most capable OSS option. No license cost, no per-host fees, no usage surprises.
Where Zabbix falls short
Steep learning curve. This is the universal complaint across Zabbix G2 reviews. Triggers, templates, macros, and proxies are powerful but require real time to master. UI feels dated compared to Grafana or SaaS platforms. Log management and APM are not there, if you need them, you'll layer on additional tools.
Post-upgrade issues that wipe customizations come up more than once in r/sysadmin threads. The cost of ownership is not the license, it's the headcount.
Pricing
- Core platform: Free, open source, no limits on hosts or metrics.
- Commercial support (Silver): Around €2,900/year per installation.
- Gold/Platinum/Enterprise tiers: Custom pricing, typically for large deployments.
- Managed Zabbix hosting: Third-party SaaS options available.
Is Zabbix right for you?
Choose Zabbix if you have on-prem or hybrid infrastructure, in-house Linux ops skills, and want zero license cost at scale. Skip it if your team is small, your stack is fully cloud-native, or you do not have someone who can own the Zabbix install full-time.
Prometheus + Grafana: best for Kubernetes and cloud-native metrics
Perfect for
Engineering-driven organizations running Kubernetes, microservices, or cloud-native stacks, from startups to large enterprises that are comfortable managing OSS infrastructure.
Notable features
- Pull-based metrics collection. Prometheus scrapes exporters and instrumented services via HTTP.
- PromQL. Powerful query language for aggregation, filtering, and math over time-series data. Core to SLO-driven workflows.
- Grafana dashboards. Data-source-agnostic visualization with rich panels and a library of community dashboards.
- Alertmanager. Rule-based alerting with routing to Slack, PagerDuty, email, webhooks.
- CNCF de facto standard. Shipped with most Kubernetes distributions. Exporters exist for virtually every common service.
Why choose Prometheus + Grafana
If you are running Kubernetes, this is the default. The CNCF ecosystem around Prometheus (kube-state-metrics, cAdvisor, exporters for databases and queues) means you can stand up production-grade monitoring in a day. Grafana dashboards for common stacks already exist. PromQL enables SLO-driven alerting that SRE teams actually want.
Where Prometheus + Grafana falls short
Operational overhead. Running, scaling, and backing up Prometheus, plus long-term storage (Thanos, Mimir, or Cortex), plus Grafana, plus Alertmanager, is real work. Vanilla Prometheus is single-node and not designed for long-term storage. PromQL and dashboard templating have a real learning curve.
It's metrics-only at the core. For logs and traces you add Loki and Tempo. That gives you full observability, but also three more things to operate.
Pricing
- Self-hosted: Free. You pay for compute, storage, and engineering time.
- Grafana Cloud: Starts around $29/month for entry tiers, priced on metric samples, log volume, and retention.
- Managed Prometheus (AWS AMP, Google Cloud): Per-million-samples ingest pricing.
Is Prometheus + Grafana right for you?
Choose Prometheus + Grafana if you are cloud-native, running Kubernetes, and have an engineering team comfortable with OSS infrastructure. Skip it if you need turnkey observability with support, or if your team is small and you'd rather pay for Datadog than operate the stack.
Uptime Kuma: best for free self-hosted uptime checks (homelabs and small teams)

Perfect for
Homelab enthusiasts, indie developers, and small teams that want free self-hosted uptime monitoring with a clean UI and a basic status page.
Notable features
- Deploys in minutes via Docker. Runs on a Raspberry Pi or small VPS.
- 20-second check intervals. Near real-time for a free tool.
- 90+ notification channels. Telegram, Discord, Slack, email, Pushover, Gotify, and many more.
- Public and private status pages. Custom domains supported.
- Multiple monitor types. HTTP, TCP, ping, DNS, Docker, keyword, JSON query, Steam servers.
- 2FA and optional proxy support.
Why choose Uptime Kuma
It's free, it looks good, and it runs on almost anything. r/selfhosted reviewers repeatedly call it "the most reliable thing you can find" for homelabs. For a small team that just needs to know when a site or API is down, Uptime Kuma covers it. 90+ notification channels is more than some paid tools offer.
Where Uptime Kuma falls short
This is where I need to be careful. Uptime Kuma is excellent at what it does, but it has real gaps that matter at scale. Looking at the top open GitHub issues (662 total, sorted by reactions), the most-requested features reveal the limitations:
- No proper REST API (issue #118, top request). You cannot programmatically manage monitors from Terraform or CI.
- No distributed or remote executors (issue #84). All checks run from one location, so you cannot verify incidents from multiple regions.
- No SSO or multi-user RBAC (issues #128 and #553). Basic multi-user support is one of the top requests.
- SQLite-only by default. Postgres support is still a feature request (#959).
- Limited status page customization. Graphs, subscriber emails, and layout options are all open requests.
- Not built for server health. Alerting on CPU, RAM, or disk usage is feature request #819, not a core capability.
It's also self-hosted, which means you own backups, security, upgrades, and the underlying host. For a homelab that's fine. For a customer-facing commercial service, the "free" comes with ongoing operational cost.
Pricing
Free. You pay for your own infrastructure (VPS, container, home server).
Is Uptime Kuma right for you?
Choose Uptime Kuma if you are monitoring a homelab, personal projects, or a small team's internal services and have zero budget. Skip it if you need multi-region checks, an API, SSO, or SLAs. For customer-facing SaaS, Hyperping's external checks and included status pages are usually a better fit even at the lowest paid tier.
Head-to-head decisions
Datadog vs Dynatrace: which for large enterprises?
Datadog wins on integration breadth (650+) and rapid time-to-value. Dynatrace wins on AI root-cause automation via Davis and auto-discovery via OneAgent. If your team is already mature in observability and you want more AI-driven incident reduction, Dynatrace. If you need broader tool coverage with a faster onboarding, Datadog.
Zabbix vs Prometheus + Grafana: which open-source stack?
Zabbix for legacy on-prem, SNMP devices, network gear, and hybrid data centers. Prometheus + Grafana for Kubernetes, microservices, and cloud-native metrics. If you have both, many teams run Zabbix for infrastructure and Prometheus for apps, with Grafana as the unified dashboard layer.
PRTG vs Checkmk: which for hybrid IT?
PRTG is easier to set up, Windows-first, and sensor-based (great for network-heavy shops). Checkmk is Linux-first, service-based, and has broader plugin coverage. If your environment is Windows-heavy with a strong network focus, PRTG. If it's Linux-heavy or very mixed with dense service coverage needs, Checkmk.
Do I need agent-based or agentless monitoring?
Agent-based tools (Datadog, Dynatrace, Zabbix, Checkmk, Prometheus exporters, Hyperping's server agent) give you visibility into the host: CPU, RAM, disk, load, network, process lists, or custom metrics depending on the tool. Agentless checks (PRTG via SNMP/WMI, Hyperping external checks, Uptime Kuma) are lower-friction to deploy but shallower. Most production environments need both: agents on hosts for internal metrics, external checks for customer-perspective uptime.
When to self-host vs buy SaaS
Self-host (Zabbix, Prometheus, Checkmk, Uptime Kuma) if you have dedicated ops headcount, compliance requirements that forbid external SaaS, or a large estate where SaaS pricing becomes prohibitive. Buy SaaS (Datadog, Dynatrace, Hyperping) if your team is lean, your runway is short on engineering time, and the monthly fee is cheaper than the headcount to operate the stack.
Decision framework
By team size:
- Solo or small team (1 to 10 people): Hyperping for uptime, host metrics, status pages, and on-call; Uptime Kuma for a free homelab.
- Mid-size (10 to 100): Hyperping if you want SaaS uptime and server monitoring without full observability overhead; Prometheus/Grafana if you already have ops time; PRTG for Windows-heavy shops.
- Large (100+): Datadog or Dynatrace for full-stack observability, Hyperping as an independent external and host-level safety net alongside.
By stack:
- Windows-heavy: PRTG.
- Linux and containerized: Prometheus + Grafana.
- Hybrid on-prem + cloud: Checkmk or Zabbix.
- Kubernetes-native: Prometheus + Grafana.
- External / customer-facing plus lightweight host metrics: Hyperping.
By budget:
- $0 and you have ops time: Uptime Kuma, Zabbix, or Prometheus + Grafana.
- Under $100/month: Hyperping Essentials or Pro.
- $100 to $500/month: Hyperping Business or Checkmk.
- $500 to $5,000/month: Datadog, Dynatrace, or larger self-hosted/managed setups.
- Enterprise: Dynatrace or Datadog Enterprise.
How to use Hyperping for server monitoring
If Hyperping fits your use case, you can cover the main server monitoring workflow in a few steps: add the host, install the agent, watch the host metrics, then connect alerts and status page components around the services that host runs.
1. Add your first server
Create a server in Hyperping and copy the install command. The agent supports Linux with systemd and macOS with launchd, on amd64 and arm64.
2. Install the agent
Run the one-line installer on the host. The installer enrolls the machine, exchanges the install token for a per-host agent token, writes the local config, and starts the agent service. The first metrics usually reach Hyperping within a few seconds of enrollment.
3. Watch host metrics next to uptime checks
Within about 30 seconds, the server view starts filling in with CPU utilization, load averages, memory usage, filesystem usage per mount, disk I/O, network throughput, uptime, and host metadata.
That is the main difference from a pure uptime monitor. If an HTTP check turns red, you can look at the same timeline and see whether the host was under CPU pressure, running out of memory, filling a disk, or losing network throughput.
4. Add external checks for the services on that host
Add HTTP, DNS, SSL, port, ping, API, or browser checks for the services running on the server. The agent tells you how the machine is behaving from the inside. External checks tell you whether customers can reach the service from the outside.
5. Route server alerts through on-call
Attach an escalation policy to the server and related monitors. When metrics stop arriving, Hyperping marks the server stale, then offline after its threshold. That outage can notify the same channels as your uptime monitors: Slack, Teams, PagerDuty, OpsGenie, SMS, phone calls, email, or webhooks. Resource thresholds are a separate concern: Hyperping pages on liveness, so if you also want to be woken up at 85% memory, that rule lives in whatever alerting layer you run on top of your metrics. For picking those numbers, see where to set server monitoring alert thresholds.
6. Connect monitors to your status page
Map critical monitors to status page components so customers can see service health during incidents or maintenance. For internal services, use a private status page and keep the same source of truth for engineering, support, and customer-facing updates.
For implementation details, read the server monitoring docs, the agent install reference, and the metrics collected reference.
The bottom line
There is no single best server monitoring tool, only the best tool for a specific slot in your stack. Datadog and Dynatrace own full-stack observability. Prometheus + Grafana owns Kubernetes. Zabbix and Checkmk own on-prem and hybrid. PRTG owns Windows and networks. Uptime Kuma owns free homelabs. Hyperping owns uptime monitoring, host-level server metrics, status pages, and on-call in one predictable SaaS tool.
If you want external checks, CPU, memory, disk, and network metrics, status pages that build customer trust, and on-call scheduling you can set up in minutes, try Hyperping free. If you would rather start with the raw commands on your own box, read the Linux server monitoring guide.
FAQ
What's the difference between server monitoring and observability? ▼
Server monitoring tracks whether your servers and services are healthy: CPU, RAM, disk, uptime, network. Observability (metrics + logs + traces) goes further, helping you understand why something is slow or failing, down to individual code paths. Datadog and Dynatrace are observability platforms. Zabbix, Checkmk, PRTG, and Hyperping are monitoring tools that often pair with log and tracing tools for full observability.
What's the best free server monitoring tool? ▼
Zabbix for on-prem and hybrid infrastructure monitoring at scale. Prometheus + Grafana for Kubernetes and cloud-native metrics. Uptime Kuma for simple uptime checks and homelabs. All three are free to self-host. Your cost is infrastructure and engineering time.
Is Datadog worth the cost? ▼
For teams running distributed microservices with 50+ hosts, yes. The ability to correlate metrics, logs, and traces in one UI saves real incident time. For smaller teams or simpler stacks, it's usually overkill, and the bill grows faster than expected as log and APM usage climbs.
What do sysadmins actually recommend on Reddit? ▼
From threads on r/sysadmin, r/devops, r/Monitoring, and r/homelab: PRTG for Windows-heavy SMBs, Zabbix for anyone who wants to monitor everything on-prem, Prometheus + Grafana for Kubernetes, Uptime Kuma for homelabs, Datadog when the team has budget but no SRE bandwidth. Nagios comes up mostly as something people are trying to migrate off.
Can one tool replace Prometheus + Grafana + Zabbix? ▼
Technically Datadog or Dynatrace can. Practically, many teams keep a mixed stack because Prometheus is free for metrics at scale and specialized for Kubernetes. The common pattern is Prometheus for in-cluster metrics, Zabbix or Checkmk for on-prem, and Datadog or Hyperping for the SaaS-side layers.
Do I still need a status page if I have Datadog? ▼
Yes. Datadog is for your internal team. A status page is for your customers. They serve different audiences and different purposes. Many Datadog users pair it with Statuspage.io or Hyperping (which includes status pages in the base plan, unlike buying them separately).
How much should a mid-sized team budget for monitoring? ▼
For a 100-host setup: $0 to $200/month if you self-host Zabbix or Prometheus (plus the infra cost). $249/month for Hyperping Business when paid yearly, or $299/month monthly. $1,500+ for Datadog Pro. $2,880+ for Dynatrace. Many mid-sized teams run a mix: OSS or SaaS host metrics plus external checks and status pages.