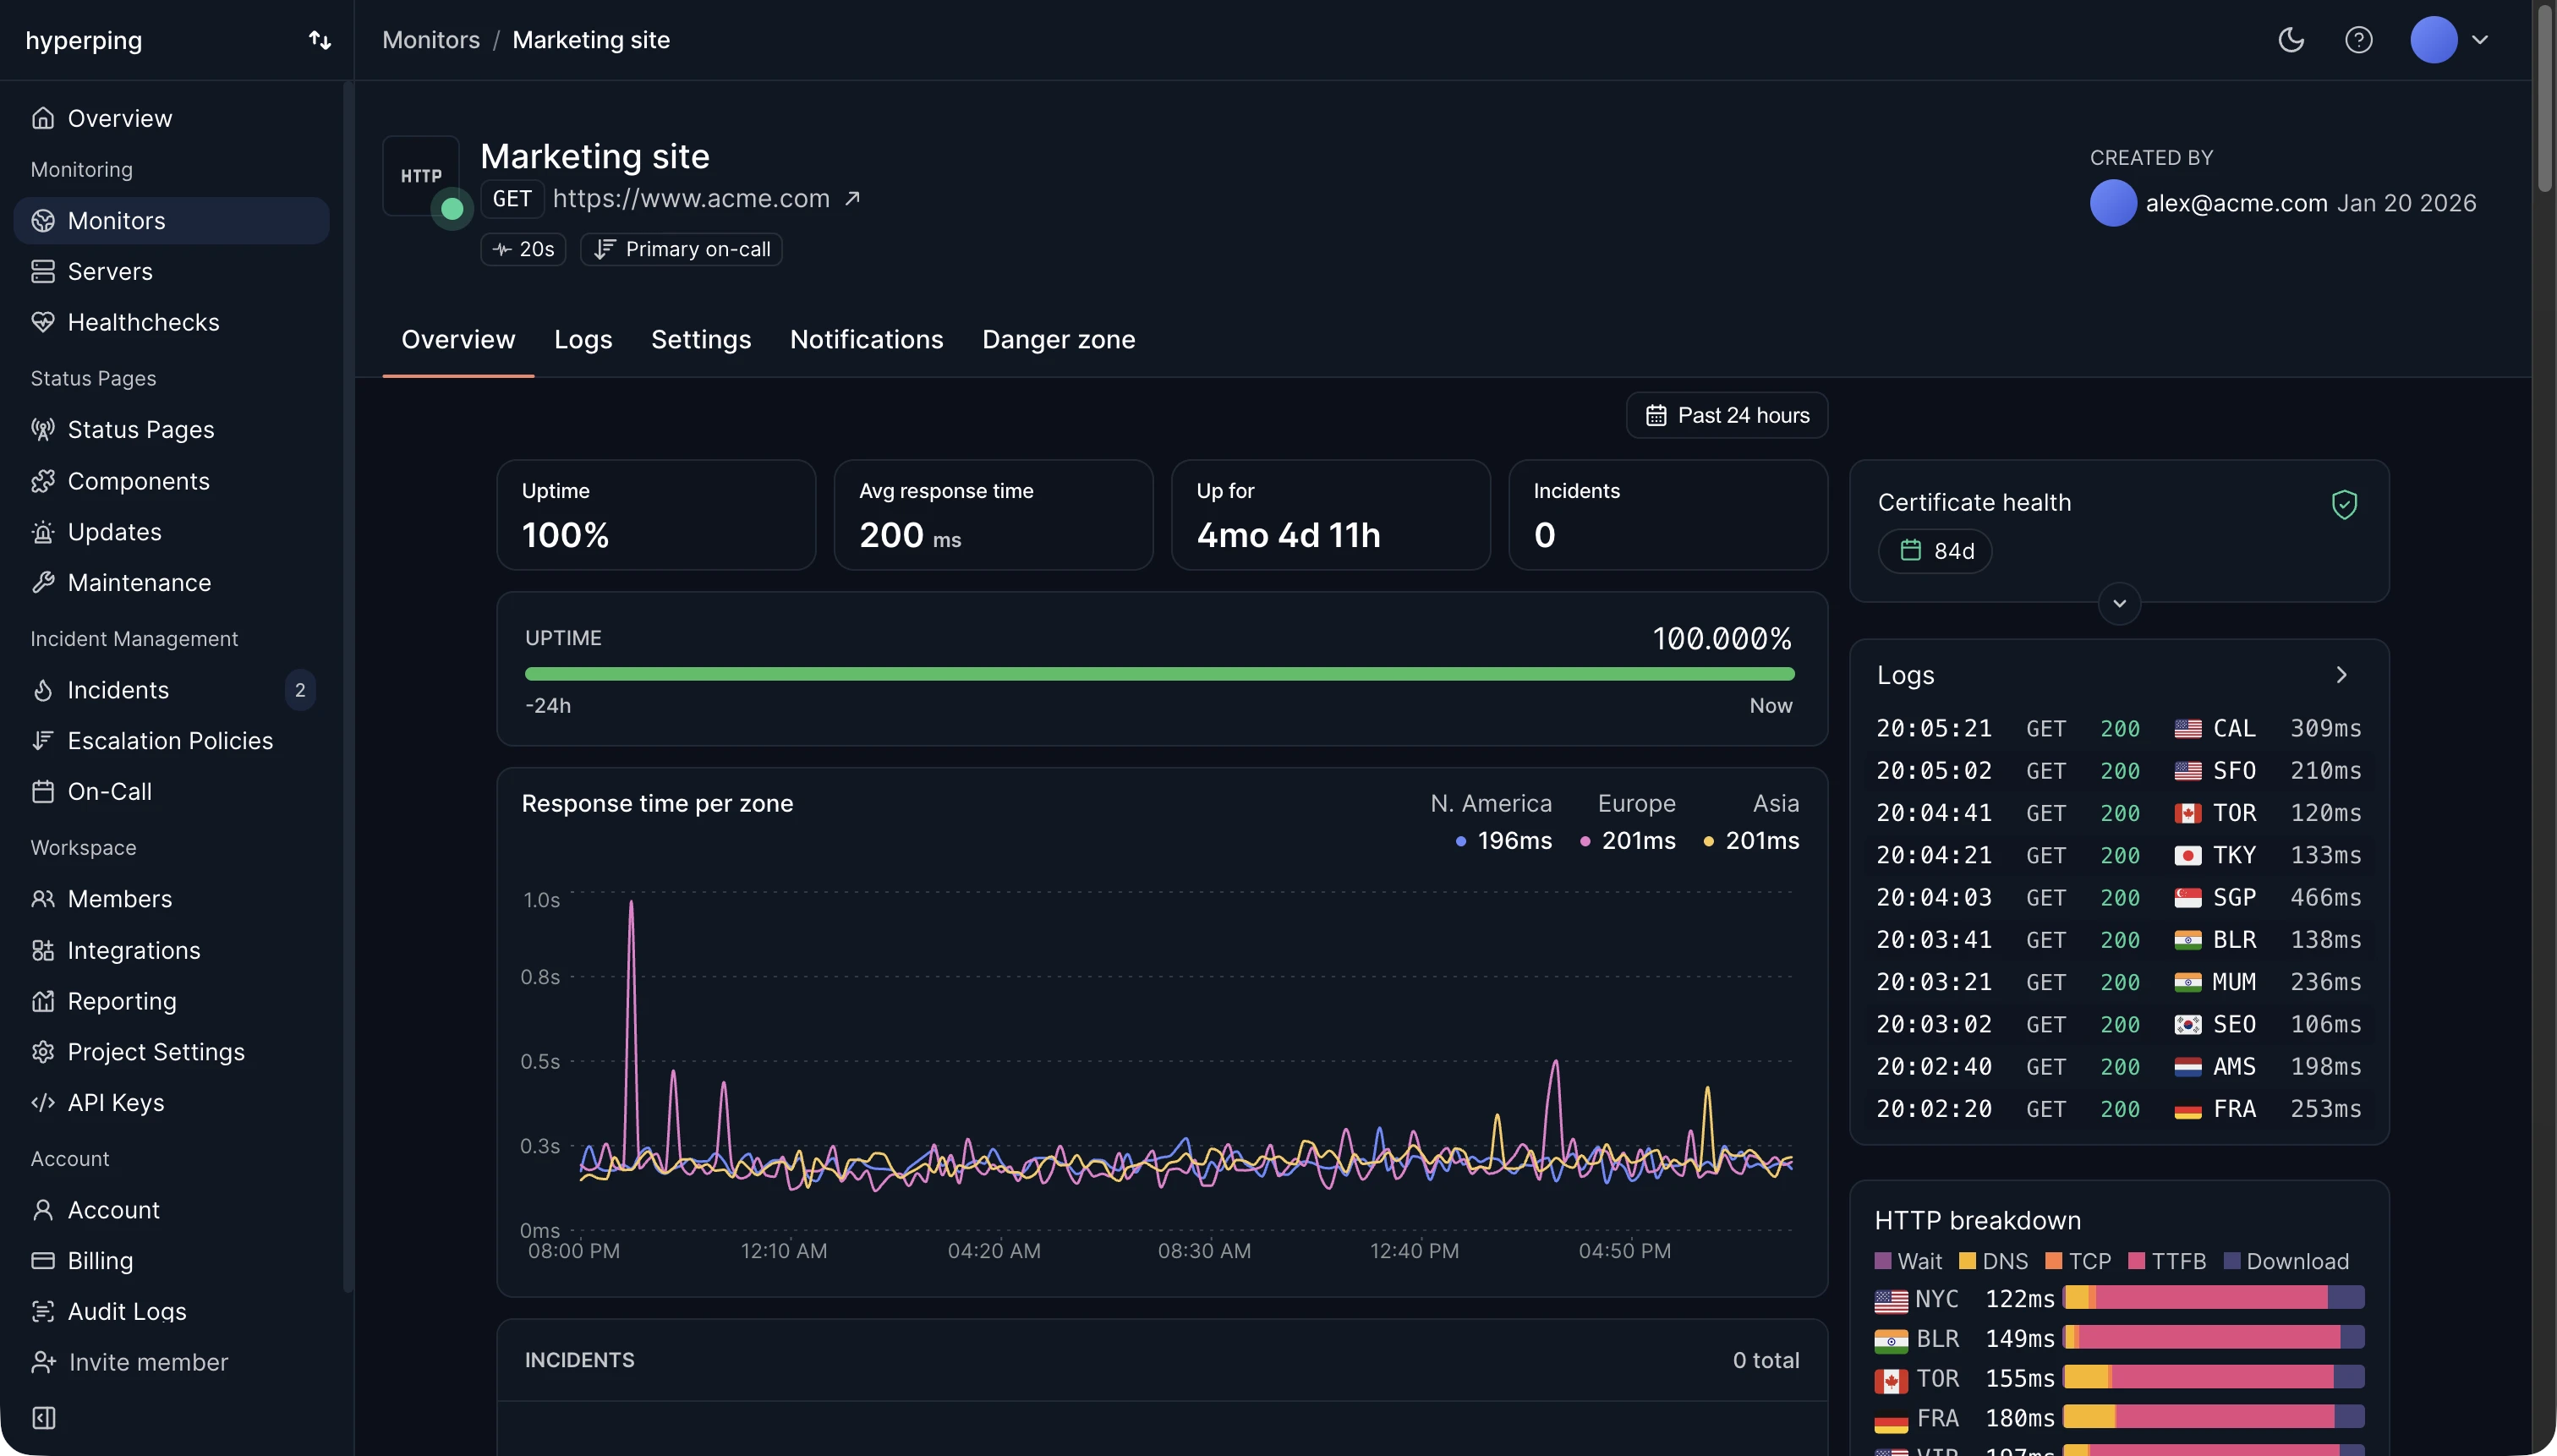
# Hyperping Documentation (full text) > Every page of the Hyperping documentation in Markdown, in the order of https://hyperping.com/docs/llms.txt. Each page starts with its source URL. --- Source: https://hyperping.com/docs/monitoring # What is Hyperping? Hyperping is an [uptime monitoring](https://hyperping.com/uptime-monitoring) and status page platform. It checks your websites, APIs and servers around the clock from 18 regions worldwide, alerts the right person the moment something breaks, and keeps your users informed through a status page you control. > **Set up your first monitor in under 2 minutes** > > Follow the [getting started guide](https://hyperping.com/docs/monitoring/getting-started) to create a monitor and wire up alerts. Free plan, no credit card required. ![Hyperping dashboard interface](https://hyperping.com/static/dashboard-2026-7545b9e193e40ce1f9443d91a09a801e.webp) ## How a check works Every monitor runs on a simple loop, built to catch real outages and ignore network noise: 1. A check runs from your regions Every 30 seconds by default, your monitor is queued and a server in one of your selected [regions](https://hyperping.com/docs/monitoring/datacenter-regions) runs the check: status code, response time, SSL, and any assertion you configured. 2. Failures are double-checked If the check fails, Hyperping immediately re-runs it from every other region you selected. A single server having a bad moment never pages you. 3. An outage opens and alerts go out Confirmed failures open an outage and notify your channels: email, Slack, SMS, phone calls, PagerDuty, webhooks and [more](https://hyperping.com/docs/projects/notification-channels). [Escalation policies](https://hyperping.com/docs/monitoring/escalation-policies) decide who gets paged, in what order. 4. Recovery is confirmed When your service responds again, the outage resolves and the same channels get the all-clear, with the outage duration and logs kept for review. > **No false positives** > > Checks run from a mix of hosting providers (AWS, Scaleway, DigitalOcean) across 18 regions. Multi-region double-checks and provider redundancy mean an isolated network blip never becomes a fake incident. See [false positives](https://hyperping.com/docs/monitoring/false-positives) for the full confirmation flow and the settings you can tune. ## Monitor anything Uptime is more than a 200 on your homepage. Each check type has its own guide: [ HTTP & API→ Status codes, redirects, custom headers and request bodies. ](https://hyperping.com/docs/monitoring/create-monitor)[ Keyword monitoring→ Assert the response body contains the content you expect. ](https://hyperping.com/docs/monitoring/keyword-monitoring)[ Ping & port→ ICMP reachability and TCP port checks for any service. ](https://hyperping.com/docs/monitoring/ping-port)[ DNS→ Validate records and catch propagation issues early. ](https://hyperping.com/docs/monitoring/dns)[ SSL certificates→ Expiration alerts and certificate error detection, built in. ](https://hyperping.com/docs/monitoring/ssl)[ Browser checks→ Playwright scripts for logins, checkouts and full user flows. ](https://hyperping.com/docs/monitoring/browser-checks)[ Healthchecks→ Cron jobs and scheduled tasks that must never fail silently. ](https://hyperping.com/docs/monitoring/healthchecks)[ Server monitoring→ CPU, memory, disk and network from a lightweight agent. ](https://hyperping.com/docs/server-monitoring) ## Create your first monitor Use the dashboard, the REST API, or Terraform. They all create the same monitor: ```bash curl -X POST https://api.hyperping.io/v1/monitors \ -H "Authorization: Bearer ${API_TOKEN}" \ -H "Content-Type: application/json" \ -d '{ "name": "Website", "url": "https://acme.com", "protocol": "http", "check_frequency": 30, "regions": ["paris", "frankfurt", "amsterdam", "london"] }' ``` **Response201 Created** ```json { "name": "Website", "url": "https://acme.com", "paused": false, "regions": ["paris", "frankfurt", "amsterdam", "london"], "http_method": "GET", "check_frequency": 30, "uuid": "mon_3GhAQMYGEQuyUH", "status": "up", "ssl_expiration": 90, "alerts_wait": 0 } ``` Grab an API key from your dashboard settings, then see the [Monitors API](https://hyperping.com/docs/api/monitors) for every available field, or the [Terraform provider](https://hyperping.com/docs/community/terraform) to manage monitoring as code. ## What should you monitor? Everything your users depend on deserves its own monitor. The usual starting point: - **Your main website** - https://acme.com - **Your dashboard** - https://app.acme.com - **Your API** - https://api.acme.com These are usually hosted differently, so each one deserves its own monitor. From there, add what would hurt if it silently broke: static assets, third-party dependencies like your payment provider, individual microservices, and scheduled jobs via [healthchecks](https://hyperping.com/docs/monitoring/healthchecks). ## When something breaks Detection is half the job. Hyperping also handles who gets paged and what your users see: [ Escalation policies→ Route alerts in order, with delays, until resolved. ](https://hyperping.com/docs/monitoring/escalation-policies)[ On-call schedules→ Page whoever is on shift, across rotations and timezones. ](https://hyperping.com/docs/monitoring/on-call)[ Status pages→ Publish incidents automatically and notify your subscribers. ](https://hyperping.com/docs/status-page/create-status-page) ## Next steps [ Getting started→ Create your first monitor and wire up alerts in 2 minutes. ](https://hyperping.com/docs/monitoring/getting-started)[ Notification channels→ Connect Slack, Teams, SMS, phone calls, PagerDuty and more. ](https://hyperping.com/docs/projects/notification-channels)[ Create a status page→ A branded status page on your own domain, live in minutes. ](https://hyperping.com/docs/status-page/create-status-page)[ MCP server→ Query your monitoring from Claude, Cursor or any MCP client. ](https://hyperping.com/docs/mcp) [Getting started →](https://hyperping.com/docs/monitoring/getting-started) [](https://x.com/hyperping)[](https://www.linkedin.com/company/hyperping) © 2026 Hyperping --- Source: https://hyperping.com/docs/monitoring/api-rate-limits # API Rate Limits Stay within Hyperping's API rate limits and handle 429 responses gracefully. To ensure fair usage and maintain service reliability, Hyperping rate limits all API endpoints. The limits are designed to allow normal usage patterns while preventing abuse. ## Default Rate Limits By default, all projects are limited to **800 requests per hour** per project. This limit is calculated on a rolling window basis. > **Rate limits are per project** > > Each project in your account has its own separate rate limit quota. ## How Rate Limiting Works Rate limits are enforced using the following mechanism: - **Time window:** 1 hour rolling window - **Identification:** Requests are tracked per project using your API token - **Fallback:** If no valid token is provided, limits are applied per IP address - **Response:** When exceeded, the API returns a `429 Too Many Requests` status ## Authentication To make API requests, you need your API token, available at [app.hyperping.io/project/developers](https://app.hyperping.io/project/developers). Include it in the Authorization header: ```bash Authorization: Bearer your-api-token-here ``` ## Rate Limit Headers API responses include rate limit information in the `ratelimit` header to help you track your usage: ```bash ratelimit: "2000-in-1hr"; r=1992; t=3481 ``` The header format includes: - `"2000-in-1hr"`: your rate limit (2000 requests per hour in this example) - `r=1992`: remaining requests in the current window - `t=3481`: time until reset (in seconds) When the rate limit is exceeded, you also receive a `retry-after` header indicating how many seconds to wait before making another request. ## Increased Limits for Paid Plans If you are on a paid plan and need higher rate limits for your use case, we can increase them for your project. Simply contact our support team with your requirements. Common scenarios for increased limits include: - High-frequency monitoring applications - Bulk data synchronization - Integration with third-party systems - Automated reporting tools ## Best Practices To make the most efficient use of your API quota: - **Implement exponential backoff:** when you receive a 429 response, wait before retrying - **Cache responses:** avoid unnecessary repeated calls for the same data - **Batch operations:** use bulk endpoints when available - **Monitor your usage:** keep track of rate limit headers in your responses - **Use webhooks:** for real-time updates, consider webhooks instead of polling ## Error Response Example When you exceed the rate limit, you receive a response like this: ```bash HTTP/1.1 429 Too Many Requests ratelimit: "800-in-1hr"; r=0; t=3590 retry-after: 3590 Rate limit exceeded ``` ## Requesting Higher Limits To request increased rate limits for your paid plan: 1. Contact support Reach out via chat or email at [hello@hyperping.io](mailto:hello@hyperping.io). 2. Share your project and usage Let us know which project needs increased limits and your current usage patterns. 3. Explain your use case Describe what you are building and the limits you need. 4. We apply the new limits We review your request and apply the increased limits to your project. ## Need Help? If you have questions about rate limits or need assistance optimizing your API usage, reach out via chat or email at [hello@hyperping.io](mailto:hello@hyperping.io). ## Next steps [ API overview→ Get started with the Hyperping REST API. ](https://hyperping.com/docs/api/overview)[ Authentication→ Create an API key and authenticate your requests. ](https://hyperping.com/docs/api/authentication)[ Monitors API→ Create, update and manage monitors programmatically. ](https://hyperping.com/docs/api/monitors)[ Healthchecks→ Cron job monitoring, with its own ping rate limits. ](https://hyperping.com/docs/monitoring/healthchecks) [← Uptime reports](https://hyperping.com/docs/monitoring/reports) [](https://x.com/hyperping)[](https://www.linkedin.com/company/hyperping) © 2026 Hyperping --- Source: https://hyperping.com/docs/monitoring/browser-check-templates /\* Shared docs metrics: crisp at documentation size, without font swapping. \*/ .mcp-doc .bc-tpl-code pre, .mcp-doc .bc-tpl-code pre code { font-family: var(--docs-font-mono, "IBM Plex Mono", "SFMono-Regular", Consolas, monospace) !important; font-size: 13px !important; line-height: 1.7 !important; font-weight: 400 !important; letter-spacing: -0.006em !important; font-variant-ligatures: none !important; font-feature-settings: "liga" 0, "calt" 0 !important; } /\* Dark: Claude Platform's Dark+ TypeScript palette. \*/ html\[theme="dark"\] .mcp-doc .bc-tpl-code { background: var(--docs-code-bg, #0b0e12) !important; border: 1px solid var(--docs-code-border, #252a33) !important; } html\[theme="dark"\] .mcp-doc .bc-tpl-code .api-code-header { background: var(--docs-code-header, #101318) !important; border-bottom: 1px solid var(--docs-code-border, #252a33); } html\[theme="dark"\] .mcp-doc .bc-tpl-code pre { background: transparent !important; } html\[theme="dark"\] .mcp-doc .bc-tpl-code pre code { color: var(--docs-code-text, #f3f7f6) !important; text-shadow: none !important; } html\[theme="dark"\] .mcp-doc .bc-tpl-code .token { background: none !important; text-shadow: none !important; } html\[theme="dark"\] .mcp-doc .bc-tpl-code .token.comment, html\[theme="dark"\] .mcp-doc .bc-tpl-code .token.prolog, html\[theme="dark"\] .mcp-doc .bc-tpl-code .token.doctype, html\[theme="dark"\] .mcp-doc .bc-tpl-code .token.cdata { color: var(--docs-code-comment, #6a9955) !important; font-style: italic; } html\[theme="dark"\] .mcp-doc .bc-tpl-code .token.keyword, html\[theme="dark"\] .mcp-doc .bc-tpl-code .token.keyword.module, html\[theme="dark"\] .mcp-doc .bc-tpl-code .token.keyword.control, html\[theme="dark"\] .mcp-doc .bc-tpl-code .token.important { color: var(--docs-code-keyword, #569cd6) !important; } html\[theme="dark"\] .mcp-doc .bc-tpl-code .token.keyword.control-flow { color: var(--docs-code-control, #c586c0) !important; } html\[theme="dark"\] .mcp-doc .bc-tpl-code .token.string, html\[theme="dark"\] .mcp-doc .bc-tpl-code .token.template-string, html\[theme="dark"\] .mcp-doc .bc-tpl-code .token.template-string .token.string, html\[theme="dark"\] .mcp-doc .bc-tpl-code .token.regex, html\[theme="dark"\] .mcp-doc .bc-tpl-code .token.attr-value { color: var(--docs-code-string, #ce9178) !important; } html\[theme="dark"\] .mcp-doc .bc-tpl-code .token.function, html\[theme="dark"\] .mcp-doc .bc-tpl-code .token.method { color: var(--docs-code-function, #dcdcaa) !important; } html\[theme="dark"\] .mcp-doc .bc-tpl-code .token.class-name, html\[theme="dark"\] .mcp-doc .bc-tpl-code .token.builtin, html\[theme="dark"\] .mcp-doc .bc-tpl-code .token.tag { color: var(--docs-code-function, #dcdcaa) !important; } html\[theme="dark"\] .mcp-doc .bc-tpl-code .token.number, html\[theme="dark"\] .mcp-doc .bc-tpl-code .token.boolean, html\[theme="dark"\] .mcp-doc .bc-tpl-code .token.constant, html\[theme="dark"\] .mcp-doc .bc-tpl-code .token.null, html\[theme="dark"\] .mcp-doc .bc-tpl-code .token.symbol { color: var(--docs-code-number, #b5cea8) !important; } html\[theme="dark"\] .mcp-doc .bc-tpl-code .token.punctuation, html\[theme="dark"\] .mcp-doc .bc-tpl-code .token.operator, html\[theme="dark"\] .mcp-doc .bc-tpl-code .token.parameter { color: var(--docs-code-text, #f3f7f6) !important; } html\[theme="dark"\] .mcp-doc .bc-tpl-code .token.property, html\[theme="dark"\] .mcp-doc .bc-tpl-code .token.attr-name { color: var(--docs-code-property, #9cdcfe) !important; } html\[theme="dark"\] .mcp-doc .bc-tpl-code .token.interpolation-punctuation { color: var(--docs-code-control, #c586c0) !important; } /\* Light: Monaco hp-light (GitHub Light) \*/ html\[theme="light"\] .mcp-doc .bc-tpl-code { background: #FAFBFC !important; border: 1px solid rgba(0,0,0,0.08) !important; } html\[theme="light"\] .mcp-doc .bc-tpl-code .api-code-header { background: #F3F5F7 !important; border-bottom: 1px solid rgba(0,0,0,0.06); color: #24292F !important; } html\[theme="light"\] .mcp-doc .bc-tpl-code .api-code-header .api-code-lang { color: #57606A !important; background: rgba(0,0,0,0.04) !important; border-color: rgba(0,0,0,0.08) !important; } html\[theme="light"\] .mcp-doc .bc-tpl-code .mcp-copy { color: #57606A !important; border-color: rgba(0,0,0,0.12) !important; } html\[theme="light"\] .mcp-doc .bc-tpl-code .mcp-copy:hover { color: #24292F !important; background: rgba(0,0,0,0.04) !important; border-color: rgba(0,0,0,0.2) !important; } html\[theme="light"\] .mcp-doc .bc-tpl-code pre { background: transparent !important; } html\[theme="light"\] .mcp-doc .bc-tpl-code pre code { color: #24292F !important; text-shadow: none !important; } html\[theme="light"\] .mcp-doc .bc-tpl-code .token { background: none !important; text-shadow: none !important; } html\[theme="light"\] .mcp-doc .bc-tpl-code .token.comment, html\[theme="light"\] .mcp-doc .bc-tpl-code .token.prolog, html\[theme="light"\] .mcp-doc .bc-tpl-code .token.doctype, html\[theme="light"\] .mcp-doc .bc-tpl-code .token.cdata { color: #6E7781 !important; font-style: italic; } html\[theme="light"\] .mcp-doc .bc-tpl-code .token.keyword, html\[theme="light"\] .mcp-doc .bc-tpl-code .token.operator, html\[theme="light"\] .mcp-doc .bc-tpl-code .token.keyword.module, html\[theme="light"\] .mcp-doc .bc-tpl-code .token.keyword.control, html\[theme="light"\] .mcp-doc .bc-tpl-code .token.important { color: #CF222E !important; } html\[theme="light"\] .mcp-doc .bc-tpl-code .token.string, html\[theme="light"\] .mcp-doc .bc-tpl-code .token.template-string, html\[theme="light"\] .mcp-doc .bc-tpl-code .token.template-string .token.string, html\[theme="light"\] .mcp-doc .bc-tpl-code .token.regex, html\[theme="light"\] .mcp-doc .bc-tpl-code .token.attr-value { color: #0A3069 !important; } html\[theme="light"\] .mcp-doc .bc-tpl-code .token.function, html\[theme="light"\] .mcp-doc .bc-tpl-code .token.method { color: #8250DF !important; } html\[theme="light"\] .mcp-doc .bc-tpl-code .token.class-name, html\[theme="light"\] .mcp-doc .bc-tpl-code .token.builtin, html\[theme="light"\] .mcp-doc .bc-tpl-code .token.tag { color: #953800 !important; } html\[theme="light"\] .mcp-doc .bc-tpl-code .token.number, html\[theme="light"\] .mcp-doc .bc-tpl-code .token.boolean, html\[theme="light"\] .mcp-doc .bc-tpl-code .token.constant, html\[theme="light"\] .mcp-doc .bc-tpl-code .token.null, html\[theme="light"\] .mcp-doc .bc-tpl-code .token.symbol { color: #0550AE !important; } html\[theme="light"\] .mcp-doc .bc-tpl-code .token.punctuation, html\[theme="light"\] .mcp-doc .bc-tpl-code .token.parameter { color: #24292F !important; } html\[theme="light"\] .mcp-doc .bc-tpl-code .token.property, html\[theme="light"\] .mcp-doc .bc-tpl-code .token.attr-name { color: #24292F !important; } html\[theme="light"\] .mcp-doc .bc-tpl-code .token.interpolation-punctuation { color: #CF222E !important; } # Playwright templates for Browser Checks Updated April 23, 2026 Twelve ready-to-paste Playwright scripts, each chosen to cover a distinct slice of real-world browser monitoring. Copy any of them into your Browser Check editor, adjust the URLs and selectors for your own application, and save. For the wider picture of what browser checks cover, see [synthetic monitoring](https://hyperping.com/synthetic-monitoring). > **Runtime compatibility** > > These templates target the **2026.05** runtime (Playwright 1.59.1, Node 24) and pick up [Web Vitals](https://hyperping.com/docs/monitoring/browser-checks#runtime-202605) on every navigation. Runtime 2023.04 works for most of them, except the ones that rely on `test.step` reporting, `toHaveScreenshot`, or `devices` presets. See [Browser Checks](https://hyperping.com/docs/monitoring/browser-checks) for runtime details. ## How to use a template 1. Create a browser check In [app.hyperping.io](https://app.hyperping.io) click **New monitor**, pick **Browser** as the protocol, and give it a name. 2. Paste a template Replace the default script with any template below. Update the target URL, selectors, and assertions to match your app. 3. Add secrets and run Put tokens and credentials in **Environment variables**, reference them as `process.env.NAME`, then click **Run** to test before saving. ## Choosing the right angle Each template teaches a different Playwright primitive. Pick the one closest to what you actually need to watch, then mix techniques across scripts as your coverage grows. Smoke [01 Homepage health check](#template-01): the one-minute starter. Auth [02 Login flow](#template-02), [11 Storage state](#template-11): secrets vs. session reuse. Data [03 Signup](#template-03), [06 API probe](#template-06): dynamic inputs and JSON assertions. Journey [04 Search](#template-04), [05 Checkout](#template-05): single action and multi-step with `test.step`. Quality [07 Broken links](#template-07), [08 Performance budget](#template-08), [09 Visual snapshot](#template-09). Platform [10 Mobile viewport](#template-10), [12 File download](#template-12). ## Templates Template 01 ### Homepage health check The baseline. Navigate to a URL, confirm the page rendered, and exit. Use this as a cheap heartbeat when you only need to know that the origin is reachable and not serving a blank or error shell. 01-homepage.spec.tsTS ```typescript import { test, expect } from '@playwright/test'; test('homepage loads and renders', async ({ page }) => { await page.goto('https://hyperping.io'); await expect(page).toHaveTitle(/Hyperping/); await expect(page.getByRole('heading', { level: 1 })).toBeVisible(); }); ``` Template 02 ### Login flow Form authentication with credentials pulled from environment variables. The check fails the moment login breaks, whether the cause is a bad deploy, expired session cookies, or a misconfigured OAuth provider. 02-login.spec.tsTS ```typescript import { test, expect } from '@playwright/test'; test('user can log in', async ({ page }) => { await page.goto('https://app.example.com/login'); await page.getByLabel('Email').fill(process.env.EMAIL); await page.getByLabel('Password').fill(process.env.PASSWORD); await page.getByRole('button', { name: 'Sign in' }).click(); await expect(page).toHaveURL(/\/dashboard/); await expect(page.getByTestId('user-menu')).toBeVisible(); }); ``` Template 03 ### Signup with dynamic data Build a unique email per run from a timestamp so the signup endpoint never collides with a previous run. Useful for verifying the full account-creation pipeline, including downstream welcome emails. 03-signup.spec.tsTS ```typescript import { test, expect } from '@playwright/test'; test('new user can sign up', async ({ page }) => { const stamp = Date.now(); const email = `qa+${stamp}@example.com`; await page.goto('https://app.example.com/signup'); await page.getByLabel('Work email').fill(email); await page.getByLabel('Password').fill(`Test-${stamp}!`); await page.getByRole('button', { name: 'Create account' }).click(); await expect(page.getByText(/check your inbox/i)).toBeVisible(); }); ``` Template 04 ### Search and result verification Keyboard input, Enter submission, and a count assertion on the result grid. Covers the common case where the failure mode is an empty result page rather than an HTTP error. 04-search.spec.tsTS ```typescript import { test, expect } from '@playwright/test'; test('search returns matching results', async ({ page }) => { await page.goto('https://example-shop.com'); const box = page.getByPlaceholder('Search products'); await box.fill('running shoes'); await box.press('Enter'); await expect(page).toHaveURL(/q=running\+shoes/); const results = page.getByTestId('product-card'); await expect(results.first()).toBeVisible(); expect(await results.count()).toBeGreaterThan(0); }); ``` Template 05 ### Multi-step checkout Wraps each stage in `test.step` so the Browser Check run view shows each step as it passes or fails. The step tree gives on-call engineers the exact breakpoint instead of a wall of logs. 05-checkout.spec.tsTS ```typescript import { test, expect } from '@playwright/test'; test('guest can complete a checkout', async ({ page }) => { await test.step('open product', async () => { await page.goto('https://example-shop.com/p/classic-tee'); await expect(page.getByRole('heading', { name: /classic tee/i })).toBeVisible(); }); await test.step('add to cart', async () => { await page.getByRole('button', { name: 'Add to cart' }).click(); await expect(page.getByTestId('cart-count')).toHaveText('1'); }); await test.step('open cart and checkout', async () => { await page.getByRole('link', { name: 'Cart' }).click(); await page.getByRole('button', { name: 'Checkout' }).click(); }); await test.step('enter shipping details', async () => { await page.getByLabel('Email').fill('qa@example.com'); await page.getByLabel('Full name').fill('QA Runner'); await page.getByLabel('Address').fill('1 Test Street'); await page.getByRole('button', { name: 'Continue to payment' }).click(); }); await test.step('confirm order', async () => { await expect(page.getByText(/order summary/i)).toBeVisible(); }); }); ``` Template 06 ### API endpoint probe Uses `page.request` to call a JSON endpoint directly, without rendering HTML. Faster than a UI test and useful for backends you want to check behind Hyperping’s probe regions. 06-api-probe.spec.tsTS ```typescript import { test, expect } from '@playwright/test'; test('public status API is healthy', async ({ request }) => { const res = await request.get('https://api.example.com/v1/status', { headers: { Authorization: `Bearer ${process.env.API_TOKEN}` }, }); expect(res.status()).toBe(200); expect(res.headers()['content-type']).toContain('application/json'); const body = await res.json(); expect(body).toMatchObject({ status: 'ok', version: expect.any(String), }); expect(body.uptime_seconds).toBeGreaterThan(0); }); ``` Template 07 ### Broken-link audit Extracts every nav href, issues HEAD-style GETs, and fails on the first 4xx or 5xx. A lightweight way to catch dead blog links, rotated CDN paths, or accidental release of draft content. 07-broken-links.spec.tsTS ```typescript import { test, expect } from '@playwright/test'; test('no broken links in the main navigation', async ({ page, request }) => { await page.goto('https://example.com'); const hrefs = await page.locator('nav a').evaluateAll( links => links.map(a => a.href).filter(h => h.startsWith('http')) ); const broken = []; for (const url of hrefs) { const res = await request.get(url, { failOnStatusCode: false }); if (res.status() >= 400) broken.push(`${res.status()} ${url}`); } expect(broken, `broken links: \n${broken.join('\n')}`).toEqual([]); }); ``` Template 08 ### Performance budget Reads `PerformanceNavigationTiming` from the page and fails when TTFB, DOMContentLoaded, or load exceed a budget. Logs the numbers on every run so you can watch them trend in the run logs. 08-perf-budget.spec.tsTS ```typescript import { test, expect } from '@playwright/test'; test('homepage meets performance budget', async ({ page }) => { await page.goto('https://example.com', { waitUntil: 'load' }); const timing = await page.evaluate(() => { const [nav] = performance.getEntriesByType('navigation'); return { ttfb: nav.responseStart - nav.requestStart, domContentLoaded: nav.domContentLoadedEventEnd - nav.startTime, loadEvent: nav.loadEventEnd - nav.startTime, }; }); console.log('perf', timing); expect(timing.ttfb).toBeLessThan(800); expect(timing.domContentLoaded).toBeLessThan(2500); expect(timing.loadEvent).toBeLessThan(4000); }); ``` Template 09 ### Visual snapshot Pixel-compares a single critical region against a golden snapshot. Waits for `document.fonts.ready` and disables animations so the diff does not flicker between runs. 09-visual.spec.tsTS ```typescript import { test, expect } from '@playwright/test'; test('hero section matches golden snapshot', async ({ page }) => { await page.goto('https://example.com'); await page.evaluate(() => document.fonts.ready); const hero = page.getByTestId('hero'); await expect(hero).toHaveScreenshot('hero.png', { maxDiffPixelRatio: 0.02, animations: 'disabled', }); }); ``` Template 10 ### Mobile viewport Uses Playwright’s `devices` preset to emulate an iPhone, including viewport, user agent, and touch events. Catches responsive regressions that desktop runs never see. 10-mobile.spec.tsTS ```typescript import { test, expect, devices } from '@playwright/test'; test.use({ ...devices['iPhone 14'] }); test('mobile nav opens and navigates', async ({ page }) => { await page.goto('https://example.com'); await page.getByRole('button', { name: 'Open menu' }).tap(); await expect(page.getByRole('navigation')).toBeVisible(); await page.getByRole('link', { name: 'Pricing' }).tap(); await expect(page).toHaveURL(/\/pricing/); }); ``` Template 11 ### Authenticated via storage state Injects a session cookie from an environment variable so the check never logs in. Faster, less brittle against auth provider changes, and easier to rotate than a scripted login. 11-storage-state.spec.tsTS ```typescript import { test, expect } from '@playwright/test'; test.use({ storageState: { cookies: [ { name: 'session', value: process.env.SESSION_COOKIE, domain: 'app.example.com', path: '/', httpOnly: true, secure: true, sameSite: 'Lax', expires: -1, }, ], origins: [], }, }); test('dashboard renders for an authenticated user', async ({ page }) => { await page.goto('https://app.example.com/dashboard'); await expect(page.getByTestId('workspace-name')).toBeVisible(); await expect(page.getByRole('navigation')).toContainText('Settings'); }); ``` Template 12 ### File download Waits for the `download` event, inspects the filename, and reads the stream to confirm the file is not empty. Covers invoice, report, and export flows that tend to silently break. 12-download.spec.tsTS ```typescript import { test, expect } from '@playwright/test'; test('invoice PDF downloads successfully', async ({ page }) => { await page.goto('https://app.example.com/billing'); const [download] = await Promise.all([ page.waitForEvent('download'), page.getByRole('button', { name: 'Download latest invoice' }).click(), ]); expect(download.suggestedFilename()).toMatch(/invoice.*\.pdf$/i); const stream = await download.createReadStream(); let bytes = 0; for await (const chunk of stream) bytes += chunk.length; expect(bytes).toBeGreaterThan(1024); }); ``` ## Good habits across every template - **Prefer role and label locators** over CSS. `getByRole('button', { name: 'Save' })` survives a stylesheet rewrite; `.btn-primary.save` does not. - **Keep secrets in environment variables.** Reference them with `process.env.NAME` so they never appear in the script body. - **Stay under the 2-minute global timeout.** Split long journeys into multiple checks rather than one mega-test, or call `test.setTimeout` explicitly. - **Let the browser settle** before asserting. `await expect(locator).toBeVisible()` already retries, so most `waitForTimeout` calls are unnecessary. - **Log the values you care about.** A `console.log` for latency, counts, or IDs shows up in run logs and makes post-mortem analysis far easier. ## Next steps [ Browser Checks→ Runtime versions, timeouts, environment variables, and the run-log format. ](https://hyperping.com/docs/monitoring/browser-checks)[ Local Playwright setup→ Mirror the Hyperping runtime on your machine so scripts behave the same locally and in production. ](https://hyperping.com/docs/monitoring/local-playwright-setup)[ Datacenter regions→ Pick which probe regions run each check to cover the geographies that matter to your users. ](https://hyperping.com/docs/monitoring/datacenter-regions)[ Monitor logs→ Inspect the details of every check Hyperping performs on your monitors. ](https://hyperping.com/docs/monitoring/logs) For locators, assertions, fixtures, and everything these templates lean on, see the upstream [Playwright docs](https://playwright.dev/docs/writing-tests). [← Browser Checks](https://hyperping.com/docs/monitoring/browser-checks)[Local Playwright setup →](https://hyperping.com/docs/monitoring/local-playwright-setup) [](https://x.com/hyperping)[](https://www.linkedin.com/company/hyperping) © 2026 Hyperping --- Source: https://hyperping.com/docs/monitoring/browser-checks # Browser Checks Updated April 28, 2026 Browser Checks run a Playwright script in headless Chromium on a schedule. The check fails when an assertion breaks or the global timeout fires, and every run keeps logs, screenshots, video, and a Playwright trace for replay. They are Hyperping's implementation of [synthetic monitoring](https://hyperping.com/synthetic-monitoring). ![Browser Check overview with the Playwright editor, Web Vitals chart, and run logs](https://hyperping.com/static/browser-check-detail-5e5ee669d0d7bf4193cba3a3f6166d71.webp) A Browser Check: the Playwright script, Web Vitals, run history, and per-step logs in one view Default runtime 2026.05 · Node 24 · Playwright 1.59.1 Legacy runtime 2023.04 · Node 16 · Playwright 1.33 Browser Chromium, headless Run timeout 2 minutes per run Test timeout 30 seconds, configurable Retention Logs kept indefinitely > **When to use Browser Checks over an HTTP monitor** > > Use a Browser Check when the failure mode is in the rendered page, not the HTTP response. Login flows, search results, multi-step checkouts, and broken JavaScript all return 200 to a plain GET but break for real users. ## Create a browser check 1. Open the dashboard Go to [app.hyperping.io](https://app.hyperping.io) and click **New monitor**. 2. Pick the Browser protocol Select **Browser** as the ping protocol and give the monitor a name. Pick the runtime from the runtime card, the default is 2026.05. 3. Write the script and save Paste a Playwright script into the editor, add any secrets as environment variables, click **Run** to test, then save to schedule the monitor. ## Runtime 2026.05 The 2026.05 runtime is the default for new browser checks. It runs on Node 24 with Playwright 1.59.1 and adds three capabilities on top of the script API. ### What 2026.05 adds 3 features `Web Vitals`LCP / CLS / TBT / FCP / TTFB Core Web Vitals are collected from each navigation in your script with no code changes. The dashboard plots them as a time-series chart on the overview, and shows per-run values on every log row. `Step reporting`test.step() Every `test.step('...')` call shows up in the run view with a green or red status and its own duration. A failed multi-step check points at the exact stage that broke instead of dropping a wall of logs on the on-call engineer. `Trace and video`retain-on-failure Failed runs attach a Playwright trace and a video of the run, alongside the screenshot already captured today. The trace deep-links into [trace.playwright.dev](https://trace.playwright.dev) for step-by-step replay. ### Web Vitals The runtime injects a `PerformanceObserver` into every page your script opens. After each navigation it captures the five Core Web Vitals and stores them on the run, so you can watch them trend without writing any custom timing code. **LCP** ≤ 2,500 ms Largest Contentful Paint. Time to render the largest visible element. High values mean users wait too long before the most useful part of the page loads. **CLS** ≤ 0.1 Cumulative Layout Shift. Visual stability score. Low values mean the layout doesn't jump around as the page loads. **TBT** ≤ 200 ms Total Blocking Time. How long the main thread was blocked from handling user input. High values mean sluggish interactions. **FCP** ≤ 1,800 ms First Contentful Paint. Time until any content is rendered. Large values mean users see a white screen for too long. **TTFB** ≤ 800 ms Time to First Byte. Server response time for the navigation request. Varies by region and network conditions. > **Where Web Vitals show up** > > The browser-check overview averages each metric across the picked window into a Web Vitals chart, and every log row shows a vitals strip with the snapshot for that single run. Each value is colored against the thresholds above. Runs that never call `page.goto` have nothing to report. FID and INP need real user input and are not collected by synthetic checks. ### Packages available in 2026.05 ### Bundled libraries 12 packages `playwright`1.59.1 Browser automation API. `@playwright/test`1.59.1 Test runner with fixtures, locators, and expect. `typescript`^5.6 TypeScript compiler. Use `.spec.ts` files directly. `expect`^29 Standalone Jest-style assertion library. `uuid`^9.0.1 RFC4122 UUID generator. `lodash`4.17.21 Utility functions for arrays, objects, and collections. `moment`^2.30.1 Date and time parsing, formatting, and arithmetic. `axios`^1.13.2 HTTP client. Useful for hitting APIs alongside the UI flow. `btoa`1.2.1 Base64 encoding helper for Node. `jsonwebtoken`^9.0.2 Sign and verify JWTs. `date-fns`^2.30.0 Modular date utilities, lighter alternative to moment. `crypto-js`^4.2.0 Hashes, HMAC, and symmetric ciphers. ## Runtime 2023.04 The 2023.04 runtime runs on Node 16 with Playwright 1.33 and is kept around for existing checks. New checks default to 2026.05 and there's no automatic migration, switch the runtime on the monitor's settings page when you're ready. Node 16.x Playwright `playwright ^1.33.0`, `@playwright/test 1.33` TypeScript `typescript ^5.0.4` Same package set Lodash, moment, axios, date-fns, crypto-js, jsonwebtoken, uuid, btoa, expect, on the older versions that shipped at the time. Web Vitals Not collected on this runtime. Switch to 2026.05 to enable them. ## Environment variables Secrets, tokens, and per-monitor configuration belong in environment variables, not in the script. Add them in the monitor's settings panel below the editor and reference them from the script as `process.env.NAME`. ## Double check Double check is enabled by default. When a run fails, the runtime immediately retries from a different region before opening an outage. This filters out network blips and one-shot flake without making you wait for the next scheduled run. ## Timeouts Each browser check has a 2-minute global timeout for the entire run. Individual tests inherit Playwright's 30-second default. Override the per-test timeout when you have a slow flow: test.setTimeoutJS ``` test.setTimeout(120_000); // 2 minutes in milliseconds ``` Long flows are usually better split into separate checks, one per critical path, rather than packed into a single 2-minute run. ## Run logs and storage Every run keeps its logs, screenshots, video, and trace indefinitely. Failed runs in 2026.05 attach a video of the run and a Playwright trace to the log row, so you can replay exactly what the browser did. ## Example script A login flow with two assertions, using `process.env` for credentials: login.spec.tsTS ``` import { test, expect } from '@playwright/test'; test.beforeEach(async ({ page }) => { await page.goto('https://app.acme.com/login'); await page.locator('input[type="text"]').type(process.env.EMAIL); await page.locator('input[type="password"]').type(process.env.PASSWORD); await page.getByRole('button', { name: 'Sign in', exact: true }).click(); }); test('has title', async ({ page }) => { await expect(page).toHaveTitle(/Acme/); }); test('is logged in', async ({ page }) => { const content = page.locator('#project-id'); await expect(content).toHaveText('project_12345'); }); ``` ## Troubleshooting **The check fails with 'Test timeout of 30000ms exceeded'** One step in the test never completed, usually a locator that matches nothing or a page that never finished loading. Open the trace on the failed run to see where time was spent. If the flow is legitimately slow, raise the limit with `test.setTimeout`, and keep the whole run under the 2-minute cap. **A locator that works locally fails in the check** The page often renders differently in headless Chromium: cookie banners, geo popups, and A/B variants show up for a fresh session in a datacenter region. Watch the video of the failed run to see what the browser saw, then dismiss the overlay in the script or use a locator that doesn't depend on it. Prefer `getByRole` over CSS selectors so a class rename doesn't break the check. **The check is flaky, alternating pass and fail** Most flake comes from racing the app: asserting before data loads, or a hard `waitForTimeout` that is sometimes too short. Replace sleeps with web-first assertions like `await expect(locator).toBeVisible()`, which retry until the condition is met. Double check already retries failures from a second region before opening an outage, so a persistent alternation points at the script or the app, not the network. **Login works in the browser but not in the script** Check that the credentials are set as environment variables on the monitor and read with `process.env`, they are not copied from your local `.env`. Bot protection and captchas also trigger more often for datacenter IPs, so whitelist the probe regions or use a dedicated test account on a captcha-free path. **The run passes but takes most of the 2-minute budget** Split the flow into separate checks, one per critical path. Shorter checks give clearer alerts, and a slow step in one flow won't push another into the global timeout. ## Next steps [ Playwright templates→ Twelve ready-to-paste scripts for login, signup, search, checkout, performance budgets, and more. ](https://hyperping.com/docs/monitoring/browser-check-templates)[ Run Playwright locally→ Mirror the runtime on your machine so scripts behave the same locally and in production. ](https://hyperping.com/docs/monitoring/local-playwright-setup)[ Datacenter regions→ Pick which probe regions run each check to cover the geographies your users are in. ](https://hyperping.com/docs/monitoring/datacenter-regions)[ Monitor logs→ Inspect the details of every check Hyperping performs on your monitors. ](https://hyperping.com/docs/monitoring/logs) New to Playwright? The [Learn Playwright guides](https://hyperping.com/learn/playwright) cover locators, assertions, waits, and codegen from scratch. For the full API, see the upstream [Playwright docs](https://playwright.dev/docs/writing-tests). [← Getting started](https://hyperping.com/docs/monitoring/getting-started)[Browser check templates →](https://hyperping.com/docs/monitoring/browser-check-templates) [](https://x.com/hyperping)[](https://www.linkedin.com/company/hyperping) © 2026 Hyperping --- Source: https://hyperping.com/docs/monitoring/bulk-edit-monitors # Edit monitors in bulk Select several monitors from the list and change their check interval, locations, escalation policy, status or group in one save. You can also mute alerts on the whole selection while you deploy. Bulk edit is useful when a change applies to more than one monitor at a time: - You created a new escalation policy and want every production monitor to use it. - You upgraded your plan and want a group of monitors checked every 30 seconds instead of every 5 minutes. - You are about to deploy and want to silence alerts on the affected services for the next hour. - You added a datacenter region and want your customer-facing monitors checked from there too. ![Monitors list with three monitors selected and the bulk edit toolbar at the bottom](https://hyperping.com/static/bulk-edit-toolbar-40b368dccb5f621f081b228cdc6598ab.webp) The bulk edit toolbar appears at the bottom of the Monitors page once at least one monitor is selected > **Before you start** > > You need the Owner, Admin or Member role in the project. Viewers can browse monitors but cannot edit them. See [Roles and permissions](https://hyperping.com/docs/projects/roles-permissions). ## Select monitors 1. Open the Monitors page In the sidebar, click **Monitors**. Use the search field or **Filter** first if you want to narrow the list to a group, a protocol or a status. 2. Tick the monitors you want to change Hover a row and the status dot turns into a checkbox. Click it to add the monitor to the selection. Click it again to remove it. 3. Select a range with Shift Hold **Shift** and click a checkbox to select every monitor between the last one you ticked and this one. Shift-click again on a fully selected range to deselect it. 4. Use the toolbar A toolbar appears at the bottom of the page with the number of monitors selected. Click the **×** next to it to clear the selection. ![Three monitors ticked in the list, with the bulk edit toolbar below](https://hyperping.com/static/bulk-edit-selection-077381f253b6b1c8561f261304ec709e.webp) Hover a row to reveal its checkbox. Selected monitors keep a blue checkbox. > **Browser checks are edited separately** > > A selection holds either regular monitors (HTTP, ping, port, DNS) or [browser checks](https://hyperping.com/docs/monitoring/browser-checks), never both. Once you tick one type, checkboxes of the other type stop responding until you clear the selection. Browser checks have their own intervals and run from Frankfurt and San Francisco only. ## Apply a change Each dropdown in the toolbar stages one change. Pick the values you want, then click **Save**. Anything you leave untouched keeps its current value on every monitor. 1. Pick the new values Open a dropdown, for example **Check interval**, and choose a value. The button shows the value you picked. You can stage several changes before saving. 2. Click Save **Save** stays disabled until at least one change is staged. Once saved, the selection is cleared and the list refreshes with the new settings. ![Check interval dropdown open in the bulk edit toolbar](https://hyperping.com/static/bulk-edit-check-interval-26f693fc4961b874af73bed6d084cb03.webp) Choosing a check interval for the selected monitors ### What you can change | Option | What it does | Notes | | --- | --- | --- | | **Locations** | Replaces the datacenter regions the selected monitors check from. | Multi-select, with **Select all**. The new list replaces the old one, it is not merged. | | **Check interval** | Sets how often each monitor runs, from every 10 seconds to once a day. | Browser checks go from every 5 minutes to every 24 hours. The lowest intervals depend on your plan. | | **Escalation policy** | Attaches an escalation policy, or removes it with **No escalation policy**. | See [Escalation policies](https://hyperping.com/docs/monitoring/escalation-policies). | | **Status** | Sets the monitors to **Active** or **Paused**. | Paused monitors stop checking and stop alerting. To keep checking but stop alerting, use **Mute alerts** instead. | | **Group** | Moves the monitors into a group, or out of any group with **No group**. | Groups are the folders you see on the Monitors page. | When every selected monitor already shares the same interval, policy or status, the button shows that value. When they differ, it shows a generic label such as **Check interval** until you pick one. ## Mute alerts on a selection **Mute alerts** works differently from the other dropdowns: it applies as soon as you pick a duration, without clicking **Save**. A mute is a timer, and a timer that only starts on a later click is hard to reason about. - Choose **For 15 minutes**, **For 1 hour**, **For 4 hours**, **Until tomorrow 9am** or **For 24 hours**. - The monitors keep being checked. Uptime and response times are still recorded, only the notifications stop. - A mute is project-wide. Nobody on the team gets paged for those monitors until the timer runs out. - When every monitor in the selection is muted, the button reads **Muted** and offers **Unmute for everyone**. It never unmutes a monitor you did not select. > **Muting versus pausing** > > Mute when you expect noise you do not need to hear about, like a deploy. Pause when you want the checks to stop entirely, for example on a decommissioned service. For a planned window with a public announcement, use a [maintenance window](https://hyperping.com/docs/maintenance/create-maintenance) instead. ## Examples **Rolling out a new on-call rotation.** A team creates an escalation policy for its platform squad, filters the Monitors page on the _Platform_ group, selects everything with Shift-click and attaches the policy in one save. **Deploying at lunch.** Before shipping a change to the checkout service, an engineer selects the four monitors covering it and mutes alerts for 1 hour. The checks keep running, so they can still watch the response times during the deploy. **Tightening intervals after an upgrade.** After moving to a plan with 30-second checks, an admin selects the customer-facing monitors and switches them from every 5 minutes to every 30 seconds, leaving internal tools on their slower cadence. ## Troubleshooting **A checkbox does not respond.** Your selection already contains the other kind of monitor. Clear it with the **×** in the toolbar, then start again with monitors of the same type. **Save is disabled.** No change is staged yet. Pick a value in at least one dropdown. Muting alerts does not enable **Save**, because it is applied immediately. **The locations I added replaced the existing ones.** This is expected. The **Locations** dropdown sets the full list of regions for the selected monitors. Tick every region you want, not only the new one. **A monitor was left out of the shift-click range.** Shift-click only selects monitors of the same type as your selection. Browser checks in the range are skipped when you started with regular monitors, and the other way round. ## Next steps [ Edit a monitor→ Change the URL, headers, assertions and alert delay of a single monitor. ](https://hyperping.com/docs/monitoring/edit-monitor)[ Escalation policies→ Route alerts in order, with delays, until resolved. ](https://hyperping.com/docs/monitoring/escalation-policies)[ Datacenter regions→ Where checks run from, and how regions rotate. ](https://hyperping.com/docs/monitoring/datacenter-regions)[ Maintenance windows→ Schedule downtime and pause alerts on a status page. ](https://hyperping.com/docs/maintenance/create-maintenance) [← Edit a monitor](https://hyperping.com/docs/monitoring/edit-monitor)[Delete a monitor →](https://hyperping.com/docs/monitoring/delete-monitor) [](https://x.com/hyperping)[](https://www.linkedin.com/company/hyperping) © 2026 Hyperping --- Source: https://hyperping.com/docs/monitoring/create-monitor # How to create a monitor Monitors are the building block of [Hyperping's uptime monitoring](https://hyperping.com/uptime-monitoring): every alert, report and status page starts from one. This page covers every setting. If you just want the fast path, take the [quickstart](https://hyperping.com/docs/monitoring/quickstart). From your [dashboard](https://app.hyperping.io), click [**New monitor**](https://app.hyperping.io/monitors/new). ![Create monitor interface](https://hyperping.com/static/create-monitor-c69f8b52fdd33fd5ca0538cae710f846.webp) ## Choose a name A human readable name, like "API" or "Website". It appears in your dashboard, alert notifications and reports, and can be renamed on a status page without touching the monitor. ## Choose a protocol The most common protocol is **HTTP**, but Hyperping monitors more than web endpoints: - **HTTP**: monitors websites and APIs through their status code. Any response between 200 and 299 counts as up by default. - **ICMP (ping)**: sends echo requests to check that a host is alive. See [Ping and port monitoring](https://hyperping.com/docs/monitoring/ping-port). - **Port**: checks that a TCP port accepts connections, for databases, mail servers or any network service. - **DNS**: queries a record (A, AAAA, CNAME, MX, TXT and more) and verifies the answer matches what you expect. See [DNS monitoring](https://hyperping.com/docs/monitoring/dns). - **Browser check**: runs a Playwright script in a headless browser to test full user flows. See [Browser checks](https://hyperping.com/docs/monitoring/browser-checks). ## Set a host or endpoint For HTTP, the endpoint must start with `http://` or `https://`. For ICMP and port checks, use a hostname or an IP address. ## Choose regions Pick where checks run from. Checks rotate through your selected [regions](https://hyperping.com/docs/monitoring/datacenter-regions), one region at a time: 1. Check from Paris: OK 2. Check from Frankfurt: OK 3. Check from London: failure. Hyperping immediately double-checks from your other selected regions, and only confirmed failures open an outage and trigger alerts. > **Regions affect response times** > > Response times are measured from the checking region. If your service is hosted in the US and you only check from Europe, expect higher numbers. Pick regions close to your users. ## Pick a check interval The frequency at which your monitor is checked. The default is every 30 seconds. > **Plan availability** > > Intervals below 30 seconds are available on the Business and Enterprise plans. See [pricing](https://hyperping.com/pricing). ## IP version By default, monitors reach your target over IPv4. To check that your service answers over IPv6, open **Advanced settings** and switch **IP version** to **IPv6** in the **Network** block. An IPv6 monitor is checked over IPv6 only: if the target has no AAAA record or doesn't answer on IPv6, the check fails, even when IPv4 works. ![IP version setting set to IPv6, with the Middle East region greyed out](https://hyperping.com/static/ip-version-ipv6-483ce780c420b58faff9fb6db9c245b2.webp) An IPv6 monitor: regions without an IPv6 probe are greyed out - **Protocols**: HTTP, port and ping (ICMP). DNS and browser checks don't have the setting. - **Regions**: every region has an IPv6 probe except Bahrain. In IPv6 mode, regions without one are greyed out in the picker. - **Shortcut**: **New monitor** → **Website / API (IPv6)** opens the form directly on IPv6. > **Monitoring both IPv4 and IPv6** > > A monitor uses one IP version, never both. To cover a dual-stack service, create two monitors on the same URL, one per version: each one alerts on its own, so you know which path broke. Through the API, set `ip_version` to `6`. See the [Create monitor API](https://hyperping.com/docs/api/monitors/create). ## HTTP advanced settings ### Redirects Choose whether your monitor should follow HTTP redirects or treat them as final responses. ### Expected status code By default, any status code between 200 and 299 counts as up. If your endpoint is supposed to answer differently, an auth-protected route returning 401 or a forbidden route returning 403, select that expected status code instead: the monitor is then up only when it answers exactly as intended. ### Text body assertion Set a text that the response body must include. This catches error pages served with a 200 and empty renders. See [Keyword monitoring](https://hyperping.com/docs/monitoring/keyword-monitoring) for patterns and use cases. ### Custom HTTP parameters Customize the request headers and body, for authenticated endpoints or POST requests. ## Create via API or Terraform Everything above is scriptable: ```bash curl -X POST https://api.hyperping.io/v1/monitors \ -H "Authorization: Bearer ${API_TOKEN}" \ -H "Content-Type: application/json" \ -d '{ "name": "Website", "url": "https://acme.com", "protocol": "http", "check_frequency": 30, "regions": ["paris", "frankfurt", "amsterdam", "london"], "request_headers": [ { "name": "X-Request-Header", "value": "Header value" } ] }' ``` **Response201 Created** ```json { "name": "Website", "url": "https://acme.com", "paused": false, "regions": ["paris", "frankfurt", "amsterdam", "london"], "http_method": "GET", "check_frequency": 30, "uuid": "mon_3GhAQMYGEQuyUH", "status": "up", "ssl_expiration": 90, "alerts_wait": 0 } ``` Full field reference in the [Create monitor API](https://hyperping.com/docs/api/monitors/create). ## Finalize and save Click **Save**. The first check runs immediately, metrics start computing, and you land on the monitor's detailed view with its graphs and logs. ## Troubleshooting **The monitor shows down, but the service works in my browser** Open the monitor's [logs](https://hyperping.com/docs/monitoring/logs) to see the response we actually received. Common causes: a status code outside your expected range, redirects not followed, or a text body assertion that no longer matches the page. **Response times look higher than expected** Response times are measured from the checking regions. Check them against the regions you selected; a US-hosted service checked only from Asia and Europe will read slower. See [Response times](https://hyperping.com/docs/monitoring/response-times). **No alerts fired during an outage** Verify the monitor's [escalation policy](https://hyperping.com/docs/monitoring/escalation-policies) assignment and test your [notification channels](https://hyperping.com/docs/projects/notification-channels) with a monitor pointing at a 404 page. ## Next steps [ Datacenter regions→ The 18 regions your checks can run from. ](https://hyperping.com/docs/monitoring/datacenter-regions)[ Escalation policies→ Decide who gets paged, in what order, until resolved. ](https://hyperping.com/docs/monitoring/escalation-policies)[ Keyword monitoring→ Catch error pages that still return a 200. ](https://hyperping.com/docs/monitoring/keyword-monitoring)[ Grouped alerts→ One alert instead of ten during a widespread outage. ](https://hyperping.com/docs/monitoring/grouped-alerts) [← Getting started](https://hyperping.com/docs/monitoring/getting-started)[Datacenter regions →](https://hyperping.com/docs/monitoring/datacenter-regions) [](https://x.com/hyperping)[](https://www.linkedin.com/company/hyperping) © 2026 Hyperping --- Source: https://hyperping.com/docs/monitoring/datacenter-regions # Datacenter regions Check your services from 18 regions across 7 global zones, so you catch outages wherever your users are. Hyperping performs HTTP, port and ICMP pings from multiple regions, one region at a time per minute. ![Datacenter regions interface](https://hyperping.com/static/datacenter-regions-1dae96997ddf086df1148fe17cf42c61.webp) Selecting regions for a monitor > **What happens when a region fails a check?** > > Checks rotate through your selected regions one region at a time. A failure is immediately double-checked from your other selected regions, and only confirmed failures open an outage and trigger alerts. See [Create a monitor](https://hyperping.com/docs/monitoring/create-monitor). > **IPv6** > > Every region can check over IPv6 except Bahrain. Monitors use IPv4 by default; switch a monitor to IPv6 in its advanced settings. See [IP version](https://hyperping.com/docs/monitoring/create-monitor#ip-version). There are currently 18 available regions across 7 global zones: ## North America - **🇺🇸 San Francisco**, United States - **🇺🇸 N. Virginia**, United States - **🇺🇸 N. California**, United States - **🇺🇸 New York City**, United States - **🇨🇦 Toronto**, Canada ## South America - **🇧🇷 São Paulo**, Brazil ## Europe - **🇬🇧 London**, United Kingdom - **🇫🇷 Paris**, France - **🇩🇪 Frankfurt**, Germany - **🇳🇱 Amsterdam**, Netherlands ## Asia - **🇰🇷 Seoul**, South Korea - **🇮🇳 Mumbai**, India - **🇮🇳 Bangalore**, India - **🇸🇬 Singapore**, Singapore - **🇯🇵 Tokyo**, Japan ## Australia - **🇦🇺 Sydney**, Australia ## Middle East - **🇧🇭 Bahrain**, Bahrain ## Africa - **🇿🇦 Cape Town**, South Africa To ensure the highest uptime among all pingers with redundancy, we use a mix of different leading hosting providers. ## Next steps [ All monitor settings→ Pick regions, intervals and protocols for each monitor. ](https://hyperping.com/docs/monitoring/create-monitor)[ Response times→ Track latency as measured from each checking region. ](https://hyperping.com/docs/monitoring/response-times)[ Ping and port monitoring→ Monitor hosts and services that don't speak HTTP. ](https://hyperping.com/docs/monitoring/ping-port)[ DNS monitoring→ Catch expired domains and hijacked records before your users do. ](https://hyperping.com/docs/monitoring/dns) [← Create a monitor](https://hyperping.com/docs/monitoring/create-monitor)[False positives →](https://hyperping.com/docs/monitoring/false-positives) [](https://x.com/hyperping)[](https://www.linkedin.com/company/hyperping) © 2026 Hyperping --- Source: https://hyperping.com/docs/monitoring/delete-monitor # Delete a monitor Remove a monitor you no longer need, and know exactly what you lose when you do. > **Deleting cannot be undone** > > Deleting permanently removes the monitor and all of its historical data: response times, outage records, and logs. Only need to stop checks temporarily? [Pause the monitor instead](#pause-vs-delete). You might want to delete a monitor when: - The service or endpoint being monitored has been decommissioned - You created a duplicate monitor by mistake - You are cleaning up monitors that are no longer relevant ## How to delete a monitor 1. Open the monitor Open the [Hyperping dashboard](https://app.hyperping.io) and click on the monitor you want to delete. 2. Go to the Danger zone tab It sits on the monitor's detail page. 3. Click the delete button Checks and notifications stop immediately. ![Monitor settings tab with the delete option](https://hyperping.com/static/delete-monitor-068353b5181be5ba624a398ed01cdcd4.webp) The delete option is in the Danger zone tab of the monitor's detail page ## What gets deleted | Data | Result | | --- | --- | | Monitor configuration | Permanently removed | | Response time history | Permanently removed | | Outage records | Permanently removed | | Check logs | Permanently removed | | Notifications | Stopped immediately, no further alerts sent | | Status page services | Removed from any status page that used this monitor | ## Pause vs. delete If you are unsure whether you will need the monitor again, pause it instead. Pausing stops all checks and notifications but keeps the monitor's configuration and history intact. You can resume a paused monitor at any time. Delete only when you are certain the monitor is no longer needed. Pausing is also scriptable: set the `paused` field with the [Update monitor API](https://hyperping.com/docs/api/monitors/update). ```bash curl -X PUT https://api.hyperping.io/v1/monitors/mon_3GhAQMYGEQuyUH \ -H "Authorization: Bearer ${API_TOKEN}" \ -H "Content-Type: application/json" \ -d '{ "paused": true }' ``` ## Delete via the API Send a `DELETE` request with the monitor's UUID. The same warning applies: all monitoring data and historical metrics are permanently deleted. ```bash curl -X DELETE https://api.hyperping.io/v1/monitors/mon_3GhAQMYGEQuyUH \ -H "Authorization: Bearer ${API_TOKEN}" ``` **Response204 No Content** ```json (empty response body) ``` Full reference in the [Delete monitor API](https://hyperping.com/docs/api/monitors/delete). ## Troubleshooting **I accidentally deleted a monitor** Deleted monitors cannot be recovered. You will need to [create a new monitor](https://hyperping.com/docs/monitoring/create-monitor) with the same settings. Historical data from the deleted monitor is not recoverable. **The delete option is not available** Make sure you are on the monitor's **Danger zone** tab, not the overview or notifications tab. Both Owners and Teammates with project access can delete monitors. ## Next steps [ Create a monitor→ Protocols, regions, check intervals, advanced HTTP options. ](https://hyperping.com/docs/monitoring/create-monitor)[ Edit a monitor→ Change settings or alert timing without recreating anything. ](https://hyperping.com/docs/monitoring/edit-monitor)[ Monitors API→ List, create, update, and delete monitors programmatically. ](https://hyperping.com/docs/api/monitors) [← Edit a monitor](https://hyperping.com/docs/monitoring/edit-monitor)[Escalation policies →](https://hyperping.com/docs/monitoring/escalation-policies) [](https://x.com/hyperping)[](https://www.linkedin.com/company/hyperping) © 2026 Hyperping --- Source: https://hyperping.com/docs/monitoring/dns # DNS Monitoring Get alerted when a DNS record stops resolving or resolves to the wrong value, before your users notice. DNS problems are easy to miss: your servers stay up, your HTTP checks may keep passing from cached resolvers, yet part of your audience can no longer reach you. A DNS monitor queries your records on a schedule and treats a wrong or missing answer as downtime, so it goes through the same alerting pipeline as any other monitor. ## What DNS monitoring catches - **Expired domains**: When a domain registration lapses, its records stop resolving. A DNS monitor fails immediately instead of waiting for someone to report that your site is unreachable. To be warned before that happens, turn on [domain expiry alerts](https://hyperping.com/docs/monitoring/domain-expiry). - **Hijacked or misconfigured records**: The record still resolves, but to a value you didn't set. Pair the monitor with an expected answer so any unexpected change triggers an alert. - **Propagation failures**: After a DNS change, some resolvers keep serving stale answers. Point monitors at specific nameservers to confirm the new value is live where it matters. > **Plan availability** > > DNS monitoring is included in the Essentials, Pro and Business plans. See the [pricing page](https://hyperping.com/pricing) for details. ## Create a DNS monitor 1. Open the new monitor form From your [dashboard](https://app.hyperping.io), click the **New monitor** card. 2. Choose the DNS protocol Select **DNS** in the protocol list. 3. Enter the hostname For example `example.com`. Unlike HTTP monitors, you enter a bare hostname rather than a full URL. 4. Pick the record type Optionally set an expected answer and a nameserver, both covered below. 5. Save the monitor Checks start right away at your chosen frequency. DNS monitors share the rest of their configuration with other monitor types: check frequency, [regions](https://hyperping.com/docs/monitoring/datacenter-regions), and alert settings all work the same way. See [Create a monitor](https://hyperping.com/docs/monitoring/create-monitor) for the general workflow. ![The create monitor form in DNS mode with hostname, record type, and expected answer](https://hyperping.com/static/create-monitor-dns-1bb4cb7e5873f325d9796bf453ae75cf.webp) A DNS monitor: hostname, record type, expected answer, and optional nameserver ## Choose a record type Each DNS monitor checks one record type on the hostname. The default is `A`. Supported types: - **A**: IPv4 address of the hostname. - **AAAA**: IPv6 address of the hostname. - **CNAME**: Alias pointing to another hostname. - **MX**: Mail servers for the domain. Useful to catch email delivery breakage early. - **NS**: Authoritative nameservers for the domain. - **TXT**: Text records, such as SPF, DKIM, or domain verification entries. - **SOA**: Start of authority record for the zone. - **SRV**: Service locator records. - **CAA**: Certificate authority authorization, controlling who can issue certificates for the domain. - **PTR**: Reverse DNS lookup. To watch several record types on the same domain, create one monitor per record type. ## Validate answers with an expected value By default, a DNS monitor is up as long as the query returns an answer. To also verify _what_ it returns, set an expected answer. The monitor fails when no record contains the expected string. For example, an `A` record monitor with the expected answer `192.0.2.1` stays up while the hostname resolves to that address, and goes down if the record is deleted or changed to point somewhere else. This is how you detect hijacked or accidentally edited records rather than just missing ones. The match is a substring check that ignores case, and one matching record is enough, so for records with multiple values (like `MX` or `TXT`) you can validate that one specific entry is present. `MX` and `SRV` records are compared on their host (not the priority), `SOA` on its primary nameserver and `CAA` on its value. ## Query a specific nameserver By default, each monitoring region queries through its own resolver, which reflects what a typical visitor experiences. You can instead point a monitor at a specific nameserver, by IP address or hostname, for example `8.8.8.8` or `ns1.example.net`. Querying a specific nameserver is useful when you want to: - Check your authoritative nameservers directly, bypassing resolver caches, so you see record changes the moment they're published. - Verify propagation on a public resolver after a DNS change. - Compare answers across resolvers by creating one monitor per nameserver with the same expected answer. > **Also worried about certificates and registrations?** > > SSL monitoring is enabled by default on every HTTPS monitor, with expiry reminders at the threshold you choose. Domain expiry alerts warn you before the registration itself lapses. See [SSL monitoring](https://hyperping.com/docs/monitoring/ssl) and [domain expiry monitoring](https://hyperping.com/docs/monitoring/domain-expiry). ## Alerting and escalation DNS monitors plug into the same alerting as HTTP monitors. When a check fails, you're notified on your configured channels, and you can attach an [escalation policy](https://hyperping.com/docs/monitoring/escalation-policies) so DNS incidents escalate through your team like any other outage. Alert delay settings apply too, so you can wait a few minutes before alerting or route failures straight to your on-call. ## Create DNS monitors via the API DNS monitors can be managed programmatically. With the [monitors API](https://hyperping.com/docs/api/monitors/create), set `protocol` to `dns` and use the `dns_record_type`, `dns_expected_answer`, and `dns_nameserver` fields: ```bash curl -X POST https://api.hyperping.io/v1/monitors \ -H "Authorization: Bearer ${API_TOKEN}" \ -H "Content-Type: application/json" \ -d '{ "name": "Website DNS", "url": "example.com", "protocol": "dns", "dns_record_type": "A", "dns_expected_answer": "192.0.2.1", "dns_nameserver": "8.8.8.8" }' ``` The same fields are available when [updating a monitor](https://hyperping.com/docs/api/monitors/update), and through the [MCP server](https://hyperping.com/docs/mcp). The [Terraform provider](https://hyperping.com/docs/community/terraform) doesn't manage DNS monitors yet. ## Next steps [ SSL monitoring→ Certificate checks and expiry reminders on every HTTPS monitor. ](https://hyperping.com/docs/monitoring/ssl)[ Ping and port monitoring→ Monitor hosts and services that don't speak HTTP. ](https://hyperping.com/docs/monitoring/ping-port)[ Escalation policies→ Route alerts in order, with delays, until resolved. ](https://hyperping.com/docs/monitoring/escalation-policies)[ Create monitor API→ Every monitor field, scriptable from your own tooling. ](https://hyperping.com/docs/api/monitors/create) [← Domain expiry monitoring](https://hyperping.com/docs/monitoring/domain-expiry)[Browser checks →](https://hyperping.com/docs/monitoring/browser-checks) [](https://x.com/hyperping)[](https://www.linkedin.com/company/hyperping) © 2026 Hyperping --- Source: https://hyperping.com/docs/monitoring/domain-expiry # Domain Expiry Monitoring Get warned before a domain registration lapses. When a domain expires, its website, email and certificates stop working at once, and an expired domain can be bought by someone else. Hyperping reads the expiry date from the registry and reminds you ahead of time, like it does for [SSL certificates](https://hyperping.com/docs/monitoring/ssl). ## How it works - **Which domain.** The registered domain behind the monitor's host: `api.status.example.co.uk` is checked as `example.co.uk`. It works for HTTP, ping, port and DNS monitors. - **Where the date comes from.** The registry itself, over RDAP, the successor of WHOIS. For the extensions without RDAP whose WHOIS still publishes an expiry date (`.io`, `.co`, `.me` and others), WHOIS is used instead. - **How often.** Once a day for domains expiring within 45 days, once a week otherwise. Many monitors on the same domain share one lookup. - **Shown on the monitor.** The certificate details on the monitor's overview include the domain, its expiry date and the registrar. > **Extensions without published dates** > > Some registries don't publish expiry dates at all, for example `.de`, `.eu`, `.ch`, `.be` and `.nl`. Domains under them show "not published by this registry" and don't get reminders. Subdomains of hosting platforms (`*.github.io`, `*.vercel.app`) aren't registrations you own, so they're skipped too. ## Alerts In the monitor's **Notifications** tab, **Domain expiry alerts** sets when the first reminder goes out: 7, 14, 30, 60 or 90 days before the registration ends, or never. Reminders then follow at each step below it: 60, 30, 15, 7, 3 and 1 days. - **New monitors** created from the dashboard start at 14 days. Monitors created with the API or the MCP server stay off unless you send `domain_alert_days`, and monitors created before the feature launched stay off until you pick a threshold. - **One reminder per domain.** Ten monitors on the same domain in a project send one reminder, not ten. The earliest threshold among them wins. - **Who gets them.** Everyone on the project by email, plus the SSL notification channels of those monitors. PagerDuty and Opsgenie are only paged in the last 24 hours. - **Renewals.** Registrars often renew in the last days, so the registry is asked again right before a reminder goes out: a domain renewed meanwhile gets no reminder. If you had already been warned, a **renewed** notice goes to the SSL notification channels (not by email), and any PagerDuty or Opsgenie page is resolved. ## API and Terraform On [monitors in the API](https://hyperping.com/docs/api/monitors/update), `domain_alert_days` sets the threshold (-1 for never) and the read-only `domain_expiration` gives the whole days left before the registration expires, or `null` when the registry doesn't publish it. The Terraform provider's `hyperping_monitor` resource takes `domain_alert_days` too. ```bash curl -X PUT https://api.hyperping.io/v1/monitors/mon_3GhAQMYGEQuyUH \ -H "Authorization: Bearer ${API_TOKEN}" \ -H "Content-Type: application/json" \ -d '{ "domain_alert_days": 30 }' ``` Webhooks added as SSL channels receive `domain_expiring` and `domain_renewed` events. See [webhook payloads](https://hyperping.com/docs/monitoring/ssl). ## Troubleshooting **My domain is on auto-renew but I still got a reminder** Auto-renewal usually happens close to the end date, and the registry only shows the new date once the registrar has paid it. The reminder means the renewal hasn't reached the registry yet. Check that auto-renew is on and the payment method on file is valid. **The expiry date is missing** Either the registry doesn't publish it (see the extensions above), or the first lookup hasn't run yet. Lookups run when you turn alerts on, then daily. ## Next steps [ SSL monitoring→ Certificate checks and expiry reminders on every HTTPS monitor. ](https://hyperping.com/docs/monitoring/ssl)[ DNS monitoring→ Catch hijacked or broken records before your users do. ](https://hyperping.com/docs/monitoring/dns) [← SSL monitoring](https://hyperping.com/docs/monitoring/ssl)[DNS monitoring →](https://hyperping.com/docs/monitoring/dns) [](https://x.com/hyperping)[](https://www.linkedin.com/company/hyperping) © 2026 Hyperping --- Source: https://hyperping.com/docs/monitoring/edit-monitor # How to edit a monitor Change a monitor's name, URL, request headers, or any other check setting without recreating it. Everything lives in the monitor's **Settings** tab. > **Before you start** > > You need an existing monitor. [Create a monitor](https://hyperping.com/docs/monitoring/create-monitor) walks through every setting and what it does. To change the interval, regions, escalation policy or group of several monitors at once, see [Edit monitors in bulk](https://hyperping.com/docs/monitoring/bulk-edit-monitors). ## Open the monitor settings 1. Open the monitor From your dashboard, click the monitor you want to edit. 2. Go to the Settings tab Adjust the name, URL, check interval, regions, [IP version](https://hyperping.com/docs/monitoring/create-monitor#ip-version), and HTTP options, then save. ![Edit monitor interface in the Settings tab](https://hyperping.com/static/edit-monitor-view-613114147eaa4e63560cc0f776a721a8.webp) Edit monitor interface in the Settings tab See [Create a monitor](https://hyperping.com/docs/monitoring/create-monitor) for what each parameter does. ## Change when alerts trigger By default, you are alerted as soon as a downtime is confirmed. If you prefer to ignore short blips, add a delay: open the monitor's **Notifications** tab and set how long the check must stay down before you are notified. ![Notification delay setting in the Notifications tab](https://hyperping.com/static/edit-monitor-change-time-trigger-f003a02acc63108e35d1b366f38d5820.webp) Notification delay setting in the Notifications tab For example, with a 5 minute delay, a downtime that recovers after 2 minutes will not trigger any alert. > **Need alerts to escalate through your team?** > > Link an [escalation policy](https://hyperping.com/docs/monitoring/escalation-policies) to the monitor to route alerts in order, with delays, until the outage resolves. ## Edit via the API Every setting is scriptable with a `PUT` on the monitor. The alert delay is the `alerts_wait` field, in minutes, and `-1` disables alerts entirely. ```bash curl -X PUT https://api.hyperping.io/v1/monitors/mon_3GhAQMYGEQuyUH \ -H "Authorization: Bearer ${API_TOKEN}" \ -H "Content-Type: application/json" \ -d '{ "name": "Website", "url": "https://acme.com", "regions": ["paris", "frankfurt", "amsterdam", "london"], "http_method": "GET", "check_frequency": 30, "request_headers": [ { "name": "X-Request-Header", "value": "Header value" } ], "protocol": "http" }' ``` **Response200 OK** ```json { "name": "Website", "url": "https://acme.com", "paused": false, "regions": ["paris", "frankfurt", "amsterdam", "london"], "http_method": "GET", "check_frequency": 30, "protocol": "http", "follow_redirects": true, "ip_version": 4, "expected_status_code": "2xx", "uuid": "mon_3GhAQMYGEQuyUH", "status": "up", "ssl_expiration": 90, "alerts_wait": 0 } ``` Full field reference in the [Update monitor API](https://hyperping.com/docs/api/monitors/update). ## Next steps [ Delete a monitor→ Pause vs delete, and what happens to your data. ](https://hyperping.com/docs/monitoring/delete-monitor)[ Monitor logs→ Inspect every check: status code, response time, region. ](https://hyperping.com/docs/monitoring/logs)[ Escalation policies→ Route alerts in order, with delays, until resolved. ](https://hyperping.com/docs/monitoring/escalation-policies)[ Datacenter regions→ Where checks run from, and how regions rotate. ](https://hyperping.com/docs/monitoring/datacenter-regions) [← Create a monitor](https://hyperping.com/docs/monitoring/create-monitor)[Delete a monitor →](https://hyperping.com/docs/monitoring/delete-monitor) [](https://x.com/hyperping)[](https://www.linkedin.com/company/hyperping) © 2026 Hyperping --- Source: https://hyperping.com/docs/monitoring/escalation-policies # Escalation policies Route alerts through the right channels in the right order when an incident occurs. Instead of paging every channel at once, define a sequence of steps with delays: each step fires after its delay, until the outage resolves. Acknowledging an outage stops its repeat alerts, not the escalation, so a second responder still hears about an outage that lasts. > **Before you start** > > Connect the channels you plan to page in your [notification channels](https://hyperping.com/docs/projects/notification-channels), and make sure teammates have their email and phone number set in their [account settings](https://app.hyperping.io/settings/general) so they can receive email, SMS, and phone call alerts. Escalation policies are useful when: - You want Slack notifications first, then SMS or phone calls if no one responds - Different people need to be contacted at different stages of an incident - You have on-call rotations and want alerts sent to whoever is currently on duty - You need to reduce alert noise while still making sure critical issues get attention ![Escalation policies overview with coverage stats and the list of policies](https://hyperping.com/static/escalation-policies-bc2b3ccb5cff69639c6419da18ab5192.webp) Your escalation policies, with the channels and monitors each one covers. ## Create an escalation policy 1. Open Escalation Policies Go to [Escalation Policies](https://app.hyperping.io/escalation-policies) in the sidebar and click **New escalation policy**. 2. Name the policy Give it a descriptive name, for example "Production Critical" or "Business Hours". 3. Configure your first escalation step Set the delay and pick the notification channels for the first step. The settings are detailed in the next section. 4. Save Click **Save** at the top-right when you are done. ## Configure escalation steps Each escalation policy consists of one or more steps. A step defines which channels receive alerts and how long Hyperping waits before moving to the next step. ### Set the delay Set the delay in minutes for when the step triggers. A delay of 0 means the step fires instantly when the incident starts. For the second step onward, the delay is counted from the previous step. ### Add notification channels You can add multiple channels to a single step. When the step triggers, all channels in that step receive the alert at the same time. Available channels include email, SMS, phone call, Slack, Microsoft Teams, and any other [configured integrations](https://hyperping.com/docs/projects/notification-channels). For email, SMS, or phone call notifications, you can select individual recipients or use the "Everyone" option to notify all teammates in the project. ### Add more steps Click **\+ Add another escalation step** at the bottom of the policy. Each additional step acts as a fallback if the incident is not yet resolved after the previous step's delay. ![Escalation policy editor with an immediate step and a follow-up step after three minutes](https://hyperping.com/static/escalation-policy-editor-712976a169782f61aefac0094fb6c4c2.webp) A two-step policy: page one channel immediately, then more channels three minutes later. ## Use on-call schedules For email, SMS, or phone call notifications, you can select an on-call schedule instead of a specific recipient. This sends alerts only to the team member who is actively on-call at the time of the incident. On-call schedules appear in the recipient dropdown under the **On-Call Schedules** section when configuring these notification types. For more details, see the [On-call documentation](https://hyperping.com/docs/monitoring/on-call). ## Assign a policy to a monitor 1. Open the monitor Go to a monitor's detail page. 2. Go to the Notifications tab Alert settings for that monitor live here. 3. Select the policy Pick an escalation policy from the **Escalation Policy** dropdown. > **Policies replace the default behavior** > > Without an escalation policy, a monitor sends alerts to all configured channels simultaneously. Assigning a policy overrides this behavior and follows the step-by-step sequence instead. ## Example setup 1. Step 1, at 0 minutes Send a Slack message to the #incidents channel. 2. Step 2, after 5 minutes Send an SMS to the on-call engineer. 3. Step 3, after 15 minutes Call the engineering lead and send an email to the team. This setup gives the team five minutes to respond in Slack before the alert escalates to SMS, and another ten minutes before triggering phone calls. > **Want a single alert during a widespread outage?** > > When several monitors fail at once, [grouped alerts](https://hyperping.com/docs/monitoring/grouped-alerts) collapse them into one notification instead of paging your team for each monitor. ## Troubleshooting **Alerts are skipping escalation steps** Check that the delay between steps is long enough. If the incident is resolved before the next step triggers, remaining steps are cancelled. **A teammate is not receiving alerts** Verify they are added as a recipient in the correct escalation step, or that they are part of the assigned on-call schedule. Also check that their notification channel (email, phone number) is configured in their [account settings](https://app.hyperping.io/settings/general). **All channels still fire at once** Make sure the escalation policy is assigned to the monitor. Go to the monitor's **Notifications** tab and confirm a policy is selected. ## Next steps [ On-call schedules→ Rotations across timezones, so policies page whoever is on duty. ](https://hyperping.com/docs/monitoring/on-call)[ Grouped alerts→ One alert when multiple monitors fail within a time window. ](https://hyperping.com/docs/monitoring/grouped-alerts)[ Notification channels→ Slack, Teams, SMS, phone calls, webhooks and more. ](https://hyperping.com/docs/projects/notification-channels)[ Edit a monitor→ Alert delays and per-monitor notification settings. ](https://hyperping.com/docs/monitoring/edit-monitor) [← Delete a monitor](https://hyperping.com/docs/monitoring/delete-monitor)[On-call →](https://hyperping.com/docs/monitoring/on-call) [](https://x.com/hyperping)[](https://www.linkedin.com/company/hyperping) © 2026 Hyperping --- Source: https://hyperping.com/docs/monitoring/false-positives # False positives A false positive is an alert for an outage that never happened: your service was up, but the check said otherwise. Hyperping confirms every failure from multiple regions before it opens an outage, and this page covers the rest of what you can tune. Most fake alerts come from one of three places: - A network blip between one probe and your server, not an outage on your side - A monitor configured more strictly than your service actually behaves - Something between you and the internet, like a WAF or a rate limiter, blocking the probe ## How a failure gets confirmed Checks rotate through your selected [regions](https://hyperping.com/docs/monitoring/datacenter-regions), one region at a time. When one of them fails, the failure is not trusted on its own: ```text check from London | v FAILURE | v +-----------------------+ | instant double check | | from your other | | regions | +-----------------------+ | +-------+-------+ | | all fail any succeeds | | v v outage opens no outage alerts sent no alert kept in the logs ``` 1. One region reports a failure Bad status code, a broken assertion, an unreachable host, or a timeout. Nothing is sent to your team yet. 2. Every other selected region re-checks immediately The double check runs at once, not on the next interval, so a confirmed outage still reaches you in seconds. 3. Only a confirmed failure opens an outage If the other regions answer normally, no outage opens and no alert goes out. The failed check stays visible in the monitor's [logs](https://hyperping.com/docs/monitoring/logs). The probes also run on a mix of hosting providers (AWS, Scaleway, DigitalOcean) across 18 regions, so a routing problem at one provider cannot fail every check at once. > **Select at least three regions** > > A monitor with a single region has nothing to double-check against. Three or four regions close to your users give the confirmation step enough independent paths to your service. ## Settings that cut the remaining noise | Setting | What it prevents | | --- | --- | | Alert delay (`alerts_wait`) | Alerts on blips that resolve on their own. With a 5 minute delay, a 2 minute outage never pages anyone. | | Expected status code | Down alerts on endpoints that legitimately answer 401, 403 or 404. | | Follow redirects | Down alerts on a 301 or 302 that is the intended response. | | Regions | Single-path failures. More regions mean more independent confirmations. | | Maintenance windows | Alerts during a planned deploy or migration. | | [Grouped alerts](https://hyperping.com/docs/monitoring/grouped-alerts) | Ten notifications for one widespread incident. | The alert delay lives in the monitor's **Notifications** tab, or in the `alerts_wait` field of the [update monitor API](https://hyperping.com/docs/api/monitors/update), in minutes. Everything else is in [the monitor settings](https://hyperping.com/docs/monitoring/edit-monitor). > **A delay is not free** > > Every minute you add to the alert delay is a minute of real downtime your team does not know about. Start at 0, and only add a delay for monitors that have proven noisy. ## When an alert still looks wrong Open the monitor's [logs](https://hyperping.com/docs/monitoring/logs) first. They show the status code, the response time and the region for every check, which usually points straight at the cause. **The service works in my browser but the check fails** Your browser is not the probe. Look for a status code outside your expected range, a redirect that is not followed, or a text assertion that no longer matches the page. Logs show what Hyperping actually received. **Checks get 403 or 429 responses** A WAF, a bot filter or a rate limiter is blocking the probes. Datacenter IPs trigger these rules more often than residential traffic. Allow the probe regions in your firewall, or raise the rate limit for them, and lengthen the check interval if the endpoint is expensive. **A keyword assertion fails after a copy change** Text assertions break when the page text changes. Assert on something stable, like an element that only renders on a healthy page, rather than marketing copy. See [keyword monitoring](https://hyperping.com/docs/monitoring/keyword-monitoring). **The alert fires every time we deploy** Schedule a [maintenance window](https://hyperping.com/docs/maintenance) for planned work, or pause the monitor for the duration of the migration. For rolling deploys that drop a few requests, an alert delay of 2 to 3 minutes is usually enough. **A browser check fails but the flow works manually** Browser checks fail on any broken assertion or on the 2-minute run timeout. Open the run's screenshot, video and Playwright trace to see where the script stopped. Failed runs are already retried from a different region before an outage opens. See [browser checks](https://hyperping.com/docs/monitoring/browser-checks). **Only one region ever fails** That is a regional problem, not a false positive, and it is worth investigating: a CDN edge, a DNS record or a peering route can be broken for part of the world while the rest is fine. Compare response times per region in the logs. ## Next steps [ Monitor logs→ Inspect every check: status code, response time, region. ](https://hyperping.com/docs/monitoring/logs)[ Datacenter regions→ The 18 regions your checks run from, and how they rotate. ](https://hyperping.com/docs/monitoring/datacenter-regions)[ Edit a monitor→ Change the alert delay, expected status code and regions. ](https://hyperping.com/docs/monitoring/edit-monitor)[ Alert triage→ What to do in the first minutes of an alert. ](https://hyperping.com/docs/playbooks/alert-triage) [← Datacenter regions](https://hyperping.com/docs/monitoring/datacenter-regions)[Grouped Alerts →](https://hyperping.com/docs/monitoring/grouped-alerts) [](https://x.com/hyperping)[](https://www.linkedin.com/company/hyperping) © 2026 Hyperping --- Source: https://hyperping.com/docs/monitoring/getting-started # Getting started with monitoring Everything you need to detect downtime before your customers do: one monitor, the right alert channels, and a place to watch it all. Three steps. If you are still evaluating, the [uptime monitoring overview](https://hyperping.com/uptime-monitoring) covers what Hyperping checks and how alerting works. 1. Create your first monitor Head to your [dashboard](https://app.hyperping.io) and click the **New monitor** card. Give it a name, enter its URL, and save. That's enough: your monitor is checked every 30 seconds from multiple regions, and its uptime and response times start filling the graphs immediately. For protocols, regions, intervals and advanced HTTP options, see [Create a monitor](https://hyperping.com/docs/monitoring/create-monitor). 2. Choose where alerts go Down and up alerts go to your signup email by default. Add the channels your team actually watches: - **SMS and phone calls**: set your number in your [account settings](https://app.hyperping.io/settings/general). - **Slack, Teams, Discord**: connect a channel at the [project level](https://app.hyperping.io/project). - **Teammates**: [invite them](https://hyperping.com/docs/projects/teammates) so they receive alerts too, with their own preferences. - **Webhooks, PagerDuty, OpsGenie**: see all [notification channels](https://hyperping.com/docs/projects/notification-channels). 3. Watch it live Open your monitor to see uptime, [response times](https://hyperping.com/docs/monitoring/response-times) per region, and the [logs](https://hyperping.com/docs/monitoring/logs) of every check. Your dashboard becomes the single view of everything you run. ![Hyperping monitor list](https://hyperping.com/static/monitor-list-ff25c409f53836e5004064fd55421cf2.webp) Your monitors, at a glance ![Monitor detail view with uptime, response time per region, and recent checks](https://hyperping.com/static/monitor-detail-8ab2e80e12faf64cedaada3fb66e0cd0.webp) A single monitor: uptime, response time per region, certificate health, and every check. > **You're monitoring** > > From here, two things make the difference on real incidents: an [escalation policy](https://hyperping.com/docs/monitoring/escalation-policies) so the right people are paged in order until the outage resolves, and a [status page](https://hyperping.com/docs/status-page/create-status-page) so your users hear it from you first. > **Prefer to do all this in code?** > > Monitors can be created via the [REST API](https://hyperping.com/docs/api/monitors) or the [Terraform provider](https://hyperping.com/docs/community/terraform). The [quickstart](https://hyperping.com/docs/monitoring/quickstart) shows a complete cURL example with its response. ## Troubleshooting **I didn't receive an alert during a real outage** Check that the monitor is assigned the right [escalation policy](https://hyperping.com/docs/monitoring/escalation-policies), and test your [notification channels](https://hyperping.com/docs/projects/notification-channels). An easy end-to-end test: create a monitor pointing at a 404 page, which triggers the alerts. **I'm getting alerts for blips that resolve themselves** Select several regions on the monitor so failures are double-checked before alerting, and consider [grouped alerts](https://hyperping.com/docs/monitoring/grouped-alerts) to reduce noise during widespread issues. ## Next steps [ All monitor settings→ Protocols, regions, check intervals, advanced HTTP options. ](https://hyperping.com/docs/monitoring/create-monitor)[ Escalation policies→ Route alerts in order, with delays, until resolved. ](https://hyperping.com/docs/monitoring/escalation-policies)[ Create a status page→ A branded status page on your own domain, live in minutes. ](https://hyperping.com/docs/status-page/create-status-page)[ Browser checks→ Test logins and checkouts with Playwright scripts. ](https://hyperping.com/docs/monitoring/browser-checks) [← What is Hyperping?](https://hyperping.com/docs/monitoring)[Create a monitor →](https://hyperping.com/docs/monitoring/create-monitor) [](https://x.com/hyperping)[](https://www.linkedin.com/company/hyperping) © 2026 Hyperping --- Source: https://hyperping.com/docs/monitoring/grouped-alerts # Grouped alerts Group related incidents together to reduce noise and prevent notification fatigue. When multiple monitors in the same project or escalation policy fail within a configured time window, Hyperping sends one alert instead of many. ## Configuration You can enable grouped alerts at two levels. ### Project level 1. Open Project Settings Go to your project settings. 2. Find the Alert grouping section The setting applies to all monitors in the project. 3. Select a time window Pick one from the dropdown: - Never (disabled) - Within 10 seconds - Within 30 seconds - Within 1 minute - Within 3 minutes - Within 5 minutes - Within 10 minutes - Within 15 minutes - Within 30 minutes - Within 1 hour ### Escalation policy level 1. Open the escalation policy settings Go to the [escalation policy](https://hyperping.com/docs/monitoring/escalation-policies) you want to configure. 2. Find the Alert grouping section The same time window options are available as at the project level. 3. Select a time window Pick one from the dropdown. > **Escalation policy settings win** > > When both are configured, the escalation policy's alert grouping overrides the project setting. ## Rules and examples ### Down alerts 1. When the first monitor goes down, an alert is sent 2. Any other monitors that go down within the time window won't trigger alerts 3. The first monitor's UUID is stored to track which monitor initiated the alert group #### Example Monitor A goes down → Alert sent Monitor B goes down (within window) → No alert Monitor C goes down (within window) → No alert ### Up alerts #### Within the time window - Only the first alerted monitor can send an up alert - Other monitors going up won't trigger alerts #### Outside the time window - First monitor to go up gets the alert - Other monitors going up within the new window won't trigger alerts #### Example Monitor A goes down → Alert sent Monitor B goes down (within window) → No alert Monitor A goes up (within window) → Up alert sent Monitor B goes up (within window) → No up alert Monitor C goes up (after window) → Up alert sent ## Time window behavior - Each alert type (up/down) has its own independent window - Windows are tracked separately for each project/escalation policy #### Example with 60-second window 10:00:00 - Monitor A goes down → Alert sent 10:00:30 - Monitor B goes down → No alert 10:01:00 - Monitor A goes up → Up alert sent 10:01:30 - Monitor B goes up → No up alert 10:02:00 - Monitor C goes down → New down alert sent (window expired) ## Benefits - Reduces alert noise during widespread issues - Maintains visibility of the first affected monitor - Prevents alert fatigue for teams - Configurable at both project and escalation policy levels - Independent windows for up and down alerts ## Best practices - Set window duration based on your team's response time - Consider enabling at escalation policy level for more granular control - Monitor alert patterns to optimize window duration - Use in conjunction with other alerting features like [alert delays](https://hyperping.com/docs/monitoring/edit-monitor) and repeat intervals > **Want the grouped alert to escalate until someone responds?** > > Pair alert grouping with an [escalation policy](https://hyperping.com/docs/monitoring/escalation-policies) so the single alert still moves through Slack, SMS, and phone calls step by step. ## Next steps [ Escalation policies→ Route alerts step by step until someone responds. ](https://hyperping.com/docs/monitoring/escalation-policies)[ On-call schedules→ Page whoever is on duty across rotations and timezones. ](https://hyperping.com/docs/monitoring/on-call)[ Edit a monitor→ Alert delays and per-monitor notification settings. ](https://hyperping.com/docs/monitoring/edit-monitor)[ Notification channels→ Email, SMS, phone calls, Slack, Teams and more. ](https://hyperping.com/docs/projects/notification-channels) [](https://x.com/hyperping)[](https://www.linkedin.com/company/hyperping) © 2026 Hyperping --- Source: https://hyperping.com/docs/monitoring/healthchecks # Healthchecks Monitor your cron jobs and scheduled tasks, and get alerted when they fail to run. Each healthcheck gives your job a unique URL to ping when it runs. If the ping does not arrive on schedule, Hyperping alerts you. Typical candidates: backups, system updates, log rotation, database maintenance, report generation, email jobs, automated tests, file cleanup, SSL renewal, and data synchronization. Healthchecks watch jobs that run on a schedule. For a service that should answer continuously, use an [uptime monitor](https://hyperping.com/uptime-monitoring) instead. ![Healthchecks interface](https://hyperping.com/static/healthcheck-general-view-63a19ccaf938664a0d1329f9a81898a2.webp) A healthcheck's ping URL, status and execution history ## HTTP pings Each healthcheck provides a unique endpoint upon creation, in this format: `https://hc.hyperping.io/TOKEN_ID` At the end of your task, send a HEAD, GET or POST HTTP request to this endpoint to log the run. Any tool that can make an HTTP request works: ```bash # Ping when your job completes successfully curl -fsS https://hc.hyperping.io/TOKEN_ID ``` > **Ping only on success** > > In shells and crontabs, chain the ping after your command with `&&` so it only fires when the job exits successfully. A failing job never pings, and Hyperping alerts you once the grace period passes. ### Measure your job execution time You can append `/start` to the URL to measure the job execution time. Hit this endpoint with a HEAD, GET or POST request at the beginning of your script, then ping the regular URL at the end: ```bash # Signal the start of the job curl -fsS https://hc.hyperping.io/TOKEN_ID/start /usr/local/bin/backup.sh # Signal completion curl -fsS https://hc.hyperping.io/TOKEN_ID ``` ## Grace period Each healthcheck has a grace period: how long Hyperping waits from the moment it expects a ping before alerting you. Use it to absorb normal variance in run time. If a script is expected to take 5 minutes, a 10 minute grace period avoids alerts for runs that are just a little slow. ## Schedules: simple or cron Each healthcheck expects pings on a schedule. Two modes are supported: ### Simple mode Set the interval at which you expect a ping: every 10 minutes, every hour, every day. If no ping arrives within the interval plus the grace period, you get alerted. ### Cron mode For jobs that run on a precise schedule, use the same cron expression as the job itself, together with its timezone. Hyperping computes the expected run times from the expression and alerts you when a run is missed. For example, a nightly backup running at 2:00 AM in Paris would use the expression `0 2 * * *` with the `Europe/Paris` timezone. Both modes are also available programmatically via the [Healthchecks API](https://hyperping.com/docs/api/healthchecks). ## Integrations When a healthcheck misses its ping, Hyperping opens an incident (_Name missed its scheduled ping_) and alerts every channel at once: email and SMS to every member of the project, Slack, Discord, Telegram, PagerDuty and Opsgenie. When the next ping arrives, the incident resolves and a recovery goes out on the same channels, and PagerDuty and Opsgenie alerts close on their own. See [Integrations](https://hyperping.com/docs/integrations) for setup. > **Monitors only** > > Escalation policies, on-call schedules, Microsoft Teams, phone calls and webhooks apply to monitors, not to healthchecks. To page whoever is on call for a missed job, send healthcheck alerts to PagerDuty or Opsgenie. ## Rate limits Healthcheck pings are limited in two ways: ### IP Rate limit You cannot ping from the same IP more than 300 times per minute. ### Token Rate limit You cannot ping a single check more than 10 times per minute. ## Guides by scheduler Where the ping goes, and how each scheduler fails silently, depends on what runs the job. These guides give a tested setup for each: - On a server: [systemd timers](https://hyperping.com/blog/how-to-monitor-systemd-timers), [Windows Task Scheduler](https://hyperping.com/blog/how-to-monitor-windows-task-scheduler), [Kubernetes CronJobs](https://hyperping.com/blog/how-to-monitor-kubernetes-cronjobs) - On a platform: [GitHub Actions scheduled workflows](https://hyperping.com/blog/how-to-monitor-github-actions-scheduled-workflows), [Vercel cron jobs](https://hyperping.com/blog/how-to-monitor-vercel-cron-jobs), [Cloudflare Workers cron triggers](https://hyperping.com/blog/how-to-monitor-cloudflare-workers-cron-triggers) - In the app: [Laravel scheduler](https://hyperping.com/blog/how-to-monitor-laravel-scheduler), [Rails scheduled jobs](https://hyperping.com/blog/how-to-monitor-rails-scheduled-jobs), [Node.js cron jobs](https://hyperping.com/blog/how-to-monitor-nodejs-cron-jobs), [Celery beat](https://hyperping.com/blog/how-to-monitor-celery-beat), [Sidekiq cron jobs](https://hyperping.com/blog/how-to-monitor-sidekiq-cron-jobs), [pg\_cron](https://hyperping.com/blog/how-to-monitor-pg-cron) - By job: [database backups](https://hyperping.com/blog/how-to-monitor-database-backups), [a dead man's switch for Prometheus Alertmanager](https://hyperping.com/blog/how-to-monitor-prometheus-alertmanager), [scheduled AI agents](https://hyperping.com/blog/how-to-monitor-scheduled-ai-agents) Coming from Opsgenie heartbeats? The [Opsgenie migration guide](https://hyperping.com/docs/migrate/from-opsgenie) recreates each one as a healthcheck. To write or check a schedule, use the [cron expression generator](https://hyperping.com/cron-expression-generator). ## Next steps [ Healthchecks API→ Create, update, pause and resume healthchecks programmatically. ](https://hyperping.com/docs/api/healthchecks)[ Alert integrations→ Send healthcheck alerts to Slack, Discord, Telegram, PagerDuty and Opsgenie. ](https://hyperping.com/docs/integrations)[ Healthchecks on status pages→ Show a scheduled job next to your websites and APIs, with its uptime. ](https://hyperping.com/docs/status-page/add-services)[ Uptime monitors→ Monitor websites and APIs alongside your scheduled jobs. ](https://hyperping.com/docs/monitoring/create-monitor) [](https://x.com/hyperping)[](https://www.linkedin.com/company/hyperping) © 2026 Hyperping --- Source: https://hyperping.com/docs/monitoring/keyword-monitoring # Keyword monitoring Keyword monitoring verifies that a page or API response actually contains the content you expect, not just that it responds. A monitor can return a 200 status code while serving an error page, an empty template, or a broken deploy. Checking for a keyword catches these silent failures. This page covers the setup in Hyperping. For the wider picture, which failures a keyword check catches, where it stops being enough, and when to reach for a browser check instead, read [keyword monitoring: check content, not just uptime](https://hyperping.com/blog/keyword-monitoring). > **Keyword check or browser check?** > > A keyword check asserts on the raw response body of an HTTP monitor, without executing JavaScript. If the text you want to verify only renders client-side, in a real browser, use a [browser check](https://hyperping.com/docs/monitoring/browser-checks) instead. ## How it works On every check, Hyperping fetches the response body of your HTTP monitor and verifies that it includes the text you configured. If the text is missing, the monitor is considered down: we double-check from your other selected regions to rule out a false positive, then open an outage and alert your channels, exactly like a failed status code. ## Set up a keyword check 1. Create a new HTTP monitor or edit an existing one. See [Create a monitor](https://hyperping.com/docs/monitoring/create-monitor). 2. Open the advanced HTTP settings. 3. In **Text body assertion**, enter the text that the response body must include. 4. Save the monitor. The check runs at your monitor's regular interval, from all the regions you selected. ## Choosing a good keyword - **Pick stable text.** A footer mention, a product name in the hero, or a fixed JSON field name are good candidates. - **Avoid dynamic content.** Timestamps, usernames, cart counts, or A/B tested copy will cause false alarms. - **Keep it exact.** The response body must include the text exactly as you typed it. - **For APIs, assert on structure.** A key like `"status":"ok"` validates that your endpoint returns real data, not an error payload. ## Common use cases - **Soft errors:** catch error pages served with a 200 status code. - **Deploy regressions:** detect a page that renders empty after a bad release. - **CMS issues:** verify critical content is still published. - **API contracts:** confirm an endpoint returns the expected payload, not just a response. ## Plan availability Keyword monitoring is included on every plan, including the Free plan. ## Troubleshooting If a keyword check fails unexpectedly, open the monitor's [logs](https://hyperping.com/docs/monitoring/logs) to inspect the actual response we received. Frequent causes are localized content, cookie or consent walls, and pages that only render the keyword client-side with JavaScript. For content that requires a real browser to render, use a [browser check](https://hyperping.com/docs/monitoring/browser-checks) instead. ## Next steps [ Create a monitor→ All monitor settings: protocols, regions, intervals, and the Text body assertion field. ](https://hyperping.com/docs/monitoring/create-monitor)[ Monitor logs→ Inspect the exact response Hyperping received on every check. ](https://hyperping.com/docs/monitoring/logs)[ Browser checks→ Run Playwright scripts for content that only renders with JavaScript. ](https://hyperping.com/docs/monitoring/browser-checks)[ DNS monitoring→ Query a DNS record and verify the answer matches what you expect. ](https://hyperping.com/docs/monitoring/dns) [← Ping and port monitoring](https://hyperping.com/docs/monitoring/ping-port)[Browser checks →](https://hyperping.com/docs/monitoring/browser-checks) [](https://x.com/hyperping)[](https://www.linkedin.com/company/hyperping) © 2026 Hyperping --- Source: https://hyperping.com/docs/monitoring/local-playwright-setup # Run Playwright locally Updated April 28, 2026 Mirror the Hyperping browser-check runtime on your laptop. Same Playwright version, same package set, same timeout cap, so a script that passes locally runs the same way in production. Pick the runtime that matches your monitor and follow the install for that version. Default runtime 2026.05 · Node 24 · Playwright 1.59.1 Legacy runtime 2023.04 · Node 16 · Playwright 1.33 Browser Chromium, headless Run cap 2 minutes per run > **Pick the runtime first** > > Open the monitor in Hyperping and check the runtime card. Install Playwright at the version that matches it, otherwise locator behavior, fixture syntax, and reporter output can drift between local and production. ## Install ### Runtime 2026.05 Node 24 with Playwright 1.59.1. Web Vitals are collected by the runtime, so they only appear once the check runs in Hyperping. TerminalBASH ``` mkdir hyperping-browser-checks cd hyperping-browser-checks npm init -y # Playwright versions used by the 2026.05 runtime npm install playwright@1.59.1 @playwright/test@1.59.1 # Same package set as the runtime npm install typescript@^5.6 expect@^29 uuid@^9.0.1 \ lodash@4.17.21 moment@^2.30.1 axios@^1.13.2 \ btoa@1.2.1 jsonwebtoken@^9.0.2 date-fns@^2.30.0 crypto-js@^4.2.0 # Download Chromium npx playwright install chromium ``` ### Runtime 2023.04 Node 16 with Playwright 1.33. Use this only if the monitor is still on the 2023.04 runtime. TerminalBASH ``` mkdir hyperping-browser-checks cd hyperping-browser-checks npm init -y # Playwright versions used by the 2023.04 runtime npm install playwright@1.33.0 @playwright/test@1.33.0 # Same package set as the runtime npm install typescript@^5.0.4 expect@^27.5.1 uuid@^9.0.0 \ lodash@4.17.21 moment@^2.29.4 axios@^1.4.0 \ btoa@1.2.1 jsonwebtoken@^9.0.0 date-fns@^2.30.0 crypto-js@^4.1.1 # Download Chromium npx playwright install chromium ``` ## Configure Playwright Match the run cap and the workers count Hyperping uses. The 2-minute global timeout is the most common gotcha, scripts that pass locally with no cap will fail in production when they sneak past 120 seconds. playwright.config.jsJS ``` // playwright.config.js const config = { globalTimeout: 120 * 1000, // match Hyperping's 2-minute run cap workers: 1, expect: { timeout: 30 * 1000 }, projects: [ { name: 'chromium', use: { viewport: { width: 1280, height: 720 }, deviceScaleFactor: 1, defaultBrowserType: 'chromium', }, }, ], }; export default config; ``` ## Write your first test Drop a script under `tests/` and run it. Playwright auto-detects `.spec.ts` and `.spec.js` files in that directory. tests/example.spec.tsTS ``` // tests/example.spec.ts import { test, expect } from '@playwright/test'; test('homepage renders', async ({ page }) => { await page.goto('https://example.com'); await expect(page).toHaveTitle(/Example Domain/); await expect(page.locator('h1')).toContainText('Example Domain'); }); ``` ## Run with a visible browser Hyperping runs scripts headless. Locally you'll usually want a visible browser while you're authoring, so you can see exactly what the script does. HeadedBASH ``` npx playwright test --headed ``` For step-by-step debugging, open the Playwright Inspector: DebugBASH ``` npx playwright test --debug ``` After a run, the HTML report shows traces, screenshots, and the step tree: ReportBASH ``` npx playwright show-report ``` ## Environment variables Hyperping injects environment variables at run time and exposes them as `process.env.NAME`. Mirror that locally with a `.env` file or shell exports so the same script works in both places. .envBASH ``` # .env EMAIL=test@example.com PASSWORD=changeme API_TOKEN=... BASE_URL=https://staging.your-app.com ``` ## Use the bundled package set Lodash, moment, axios, date-fns, and the other libraries that ship with the runtime are all available in your script. Importing them locally with the same versions keeps the behavior identical. cart.spec.tsTS ``` import { test, expect } from '@playwright/test'; import axios from 'axios'; test('cart roundtrip', async ({ page }) => { test.setTimeout(120_000); await page.goto(process.env.BASE_URL); await page.click('[data-testid="add-to-cart"]'); await expect(page.locator('.cart-count')).toHaveText('1'); // Cross-check via the API const { data } = await axios.get(`${process.env.BASE_URL}/api/cart`, { headers: { Authorization: `Bearer ${process.env.API_TOKEN}` }, }); expect(data.items).toHaveLength(1); }); ``` ## Available packages ### Runtime 2026.05 12 packages `playwright`1.59.1 Browser automation API. `@playwright/test`1.59.1 Test runner with fixtures, locators, and expect. `typescript`^5.6 TypeScript compiler. `expect`^29 Standalone Jest-style assertion library. `uuid`^9.0.1 RFC4122 UUIDs. `lodash`4.17.21 Array, object, and collection utilities. `moment`^2.30.1 Date and time parsing and arithmetic. `axios`^1.13.2 HTTP client for API cross-checks. `btoa`1.2.1 Base64 encoding for Node. `jsonwebtoken`^9.0.2 Sign and verify JWTs. `date-fns`^2.30.0 Modular date utilities. `crypto-js`^4.2.0 Hashes, HMAC, and symmetric ciphers. ### Runtime 2023.04 12 packages `playwright`^1.33.0 Browser automation API. `@playwright/test`1.33 Test runner. `typescript`^5.0.4 TypeScript compiler. `expect`^27.5.1 Standalone assertion library. `uuid`^9.0.0 RFC4122 UUIDs. `lodash`4.17.21 Utility functions. `moment`^2.29.4 Date and time helpers. `axios`^1.4.0 HTTP client. `btoa`1.2.1 Base64 encoding for Node. `jsonwebtoken`^9.0.0 JWT sign and verify. `date-fns`^2.30.0 Modular date utilities. `crypto-js`^4.1.1 Hashes, HMAC, ciphers. ## Move the script to Hyperping 1. Create a Browser monitor In [app.hyperping.io](https://app.hyperping.io) click **New monitor**, pick **Browser**, and select the matching runtime. 2. Paste the script and add secrets Copy the test body straight into the editor. Add every `process.env.NAME` reference under **Environment variables** in the settings panel. 3. Run, then schedule Click **Run** to execute the script once on a Hyperping droplet. When it passes, save the monitor to put it on the schedule. ## Best practices ### Habits that survive the move to production 5 rules `Stable selectors`role / data-testid Use `getByRole` and `getByTestId` instead of CSS classes. Stylesheet rewrites won't break them. `Auto-waiting assertions`expect() `await expect(locator).toBeVisible()` retries on its own. Most `waitForTimeout` calls are unnecessary and add flake. `Stay under 2 minutes`run cap Split long journeys into separate checks. One mega-test fails the whole flow when one step times out. `Secrets in env vars`process.env Never paste tokens into the script body. Anything sensitive belongs in **Environment variables**. `Log the values you watch`console.log A `console.log` for latency, counts, or IDs lands in the run logs and makes post-mortem analysis easier. ## Next steps [ Browser Checks→ Runtimes, Web Vitals, timeouts, environment variables, and the run-log format. ](https://hyperping.com/docs/monitoring/browser-checks)[ Playwright templates→ Twelve ready-to-paste scripts covering smoke, auth, search, checkout, performance, and more. ](https://hyperping.com/docs/monitoring/browser-check-templates)[ Datacenter regions→ Pick which probe regions run each check to cover the geographies that matter to your users. ](https://hyperping.com/docs/monitoring/datacenter-regions)[ Monitor logs→ Inspect the details of every check Hyperping performs on your monitors. ](https://hyperping.com/docs/monitoring/logs) For locators, fixtures, expect, and the rest of the API, see the upstream [Playwright docs](https://playwright.dev/docs/writing-tests). [← Browser Checks](https://hyperping.com/docs/monitoring/browser-checks)[Browser check templates →](https://hyperping.com/docs/monitoring/browser-check-templates) [](https://x.com/hyperping)[](https://www.linkedin.com/company/hyperping) © 2026 Hyperping --- Source: https://hyperping.com/docs/monitoring/logs # Monitor logs Inspect every check Hyperping performs on a monitor: status code, response time, and the region it ran from. Use logs to see exactly what Hyperping received when an alert looks wrong. Logs are useful when: - You need to investigate a false positive and see what Hyperping actually received - You want to compare response times across different regions - You are debugging intermittent errors or slow responses - You need to verify that a fix or deployment resolved an issue ![Monitor logs interface showing individual check results](https://hyperping.com/static/monitor-logs-94dfadee7938b6b89a03f76f3f1ec2de.webp) The logs view shows each check with its status code, response time, and region ## Access logs 1. Open a monitor Open the [Hyperping dashboard](https://app.hyperping.io) and click on a monitor. 2. Go to the Logs tab It sits on the monitor's report page, at **/logs**. ## What logs capture | Field | Description | | --- | --- | | Status code | The HTTP status code returned by the endpoint | | Response time | Time in milliseconds from request to response | | Location | The datacenter region that performed the check | | Method | The HTTP method used for the request | | Timestamp | When the check was performed | ## Use cases ### Debug false positives If a monitor triggered an alert but your service seemed fine, check the logs to see what status code and headers Hyperping received. This often reveals issues like rate limiting, firewall blocks, or CDN errors that only affect external checks. See [false positives](https://hyperping.com/docs/monitoring/false-positives) for the common causes and their fixes. ### Verify monitor behavior After changing a monitor's configuration (expected status code, regions, or assertions), use logs to confirm the checks are returning what you expect. ### Track regional performance Compare response times across different regions to identify latency issues. If checks from one region consistently show higher response times, it could indicate a routing or infrastructure problem in that area. > **Looking for trends instead of individual checks?** > > Logs show one check at a time. For latency graphs and spotting degradation over time, see [Response times](https://hyperping.com/docs/monitoring/response-times). ## Troubleshooting **Logs show a different status code than expected** Your endpoint may be returning redirects (301/302) or your server could be rate limiting Hyperping's requests. Check the response headers for `Location` or rate limit headers. **Response times vary widely between regions** This is normal if your server is located in a specific region. Checks from nearby datacenters will be faster. Consider adjusting your [selected regions](https://hyperping.com/docs/monitoring/datacenter-regions) to match where your users are. **I do not see logs for a monitor** Logs are generated with each check. If the monitor was just created, wait for the first check interval to pass. If the monitor is paused, no new logs will be generated. ## Next steps [ Response times→ Track latency from your users' perspective and spot degradation. ](https://hyperping.com/docs/monitoring/response-times)[ Datacenter regions→ Where checks run from, and how regions rotate. ](https://hyperping.com/docs/monitoring/datacenter-regions)[ Uptime reports→ Uptime, outages, MTTA and MTTR across your monitors. ](https://hyperping.com/docs/monitoring/reports)[ Edit a monitor→ Change check settings or alert timing at any time. ](https://hyperping.com/docs/monitoring/edit-monitor) [← Healthchecks](https://hyperping.com/docs/monitoring/healthchecks)[Response times →](https://hyperping.com/docs/monitoring/response-times) [](https://x.com/hyperping)[](https://www.linkedin.com/company/hyperping) © 2026 Hyperping --- Source: https://hyperping.com/docs/monitoring/on-call # On-call Create on-call schedules so alerts reach whoever is on duty, not the whole team. Each schedule can contain multiple rotations with their own timezones, so teams across regions like the US, Europe, and India fit in a single schedule view. > **Before you start** > > Rotations are built from the teammates in your project. [Invite your teammates](https://hyperping.com/docs/projects/teammates) first so you can add them to a rotation. ![On-call schedules interface](https://hyperping.com/static/on-call-asset-59f1d04d8911244d4ce289b789093ad3.png) The on-call schedules list, with escalation policy indicators. ## Accessing On-call Go to [On-Call](https://app.hyperping.io/oncall-schedules) in the left sidebar of the Hyperping app. You'll see a list of existing schedules with indicators showing which ones are linked to escalation policies. **URL:** `https://app.hyperping.io/oncall-schedules` ## Create a new on-call schedule 1. Start a new schedule Click **New on-call schedule** at the top right. 2. Name your schedule The schedule will contain all your rotations. 3. Add a rotation Each rotation has its own settings: - **Rotation name:** E.g., "US Team", "Europe Team", "India Team" - **Timezone:** Each rotation has its own timezone setting - **Add users:** Select teammates for this specific rotation - **Start date & time:** When this rotation begins - **Handoff time:** The daily time when shifts change for this rotation - **Concurrent shifts:** Number of people on-call simultaneously in this rotation - **Rotation type:** Daily, weekly, etc. - **Time restrictions:** (Optional) Hours when this rotation is active - **Rotation order:** Drag and drop to set user order within this rotation 4. Add more rotations Repeat for each team or timezone that needs its own rotation. 5. Preview See a unified calendar view of all rotations before saving. 6. Save Click **Save Schedule** to activate. ![Hyperping rotation editor showing handoff cadence, handoff time, concurrent coverage, and live preview](https://hyperping.com/static/rotation-editor-42f7913397fc7c397415e3af7814a151.png) Rotation settings for cadence, handoff time, concurrent coverage, and the live two-week preview. ![On-call calendar showing Sydney, London, and New York rotations with full coverage](https://hyperping.com/static/global-reliability-calendar-d705c68e1c86d4256c0867de9cf7d070.png) A global schedule with three regional rotations, a two-week timeline, and full coverage. ## Managing on-call schedules After creating a schedule, you can view all rotations in a unified timeline, see who is currently on-call across all teams, and manage individual rotations independently. - **On call now:** See which users are currently on-call across all rotations. - **Escalation policy indicator:** Schedules show whether they're linked to any escalation policies. - **Add/remove rotations:** Create new rotations or delete existing ones. - **Edit individual rotations:** Each rotation can be configured independently with its own timezone, users, and settings. - **Unified timeline view:** See all rotations from different timezones in one calendar view. - **Preview:** Always check the updated rotation schedule before saving changes. ## Using on-call schedules in escalation policies Connect a schedule to an [escalation policy](https://hyperping.com/docs/monitoring/escalation-policies) so alerts go to whoever is currently on-call: 1. Open Escalation Policies Go to **Escalation Policies** in the sidebar, then create a new policy or edit an existing one. 2. Pick the notification type When setting up escalation steps, you can select an on-call schedule for email, SMS, or phone call notifications. 3. Select the schedule In the recipient dropdown, your on-call schedules are listed under the "On-Call Schedules" section. Notifications will be sent to whoever is currently on-call across all rotations in that schedule. With this setup, alerts are sent to the team members who are actively on-call at the time of the incident, automatically coordinating across different timezones and rotations. > **Paged once per monitor during a widespread outage?** > > Enable [grouped alerts](https://hyperping.com/docs/monitoring/grouped-alerts) so related incidents within a time window send a single alert instead of one page per monitor. ## Multi-timezone coordination The multi-rotation feature is particularly powerful for global teams: - **Regional handoffs:** Set up rotations for different regions with appropriate local times. - **Unified view:** See all rotations in one timeline while respecting individual timezone settings. ## Overrides and substitutions Vacations, sick days, and swapped shifts happen. **A teammate is unavailable for their shift** Temporarily reassign the shift to another teammate, without rebuilding the whole rotation. **Who gets paged after I change the schedule?** Escalation policies resolve the schedule at alert time: whoever is on call after your change is the one who gets paged. ## Best practices - Use **multiple rotations** to organize teams by region or expertise area. - Set appropriate **timezones** for each rotation to match local business hours. - Use **concurrent shifts** within rotations for critical services to ensure redundancy. - Regularly review rotation orders and team assignments as your organization grows. - Use **time restrictions** per rotation to avoid alerting during regional off-hours. ## Next steps [ Escalation policies→ Route alerts step by step until someone responds. ](https://hyperping.com/docs/monitoring/escalation-policies)[ Grouped alerts→ One alert when multiple monitors fail within a time window. ](https://hyperping.com/docs/monitoring/grouped-alerts)[ Invite teammates→ Add the people you want in your rotations. ](https://hyperping.com/docs/projects/teammates)[ Notification channels→ Email, SMS, phone calls, Slack, Teams and more. ](https://hyperping.com/docs/projects/notification-channels) [](https://x.com/hyperping)[](https://www.linkedin.com/company/hyperping) © 2026 Hyperping --- Source: https://hyperping.com/docs/monitoring/operational-faq # Operational FAQ Quick answers to the operational questions our support team hears most often. Regions, false positives, phone numbers, rate limits, and check behavior, all in one place. ## From which regions do checks run? Checks run from 18 regions across 7 global zones: North America, South America, Europe, Asia, Australia, the Middle East, and Africa. See the full list in [Datacenter regions](https://hyperping.com/docs/monitoring/datacenter-regions). Each check runs from one region at a time, rotating through the regions you selected for the monitor. The probes run on a mix of hosting providers (AWS, Scaleway, DigitalOcean) for redundancy. **See all 18 regions by zone** - **North America**: San Francisco, N. Virginia, N. California, New York City, Toronto - **South America**: São Paulo - **Europe**: London, Paris, Frankfurt, Amsterdam - **Asia**: Seoul, Mumbai, Bangalore, Singapore, Tokyo - **Australia**: Sydney - **Middle East**: Bahrain - **Africa**: Cape Town ## How does Hyperping avoid false positives? Every failure is double-checked before you hear about it. When a check fails, Hyperping immediately re-runs it from every other region you selected, and only confirmed failures open an outage and trigger alerts. The probes also run on a mix of hosting providers (AWS, Scaleway, DigitalOcean), so an isolated network blip at one provider never becomes a fake incident. > **A single server having a bad moment never pages you** > > Multi-region double-checks plus provider redundancy mean alerts only fire on real, confirmed outages. See [false positives](https://hyperping.com/docs/monitoring/false-positives) for the confirmation flow and what to check when an alert still looks wrong. ## What phone numbers do alert calls come from? If you have a European phone number, calls come from **+31 970 10 25 72 04**. For US and non-EU countries, calls come from **(424) 325-7650** (+14243257650). Save both numbers as a contact named Hyperping so on-call engineers recognize the call and their phone does not silence it. Phone calls are enabled through an [escalation policy](https://hyperping.com/docs/monitoring/escalation-policies), see the [phone call integration](https://hyperping.com/docs/integrations/phonecall) for setup and throttling details. ## How often can I ping a healthcheck? Healthcheck endpoints have two rate limits: - **Per IP**: you cannot ping from the same IP more than 300 times per minute. - **Per check**: you cannot ping a single check more than 10 times per minute. Each healthcheck gets a unique endpoint in the format `https://hc.hyperping.io/TOKEN_ID`. Hit it with a HEAD, GET or POST request at the end of your job. See [Healthchecks](https://hyperping.com/docs/monitoring/healthchecks) for schedules and grace periods. ```bash # Ping your healthcheck at the end of a job (HEAD, GET or POST) curl https://hc.hyperping.io/TOKEN_ID ``` ## What SSL errors are detected? SSL monitoring is enabled by default for all HTTPS monitors, with expiry reminders at the threshold you choose. Hyperping automatically detects and reports these certificate issues: - **Expired** or **not yet valid**: the certificate, or an intermediate it relies on, is outside its validity dates. - **Hostname mismatch**: none of the names in the certificate covers the monitored host. - **Self-signed**, **untrusted root** or **invalid chain**: browsers can't trace the certificate back to an authority they trust. - **Incomplete chain**: the server doesn't send the intermediate certificates. - **Revoked**: the issuer revoked the certificate (checked with OCSP and revocation lists). - **Outdated TLS**, **weak signature** or **weak key**: TLS 1.0/1.1 only, SHA-1/MD5 signatures, short keys. Certificates are checked daily, and you can recheck one from the monitor's certificate details after renewing. See [SSL monitoring](https://hyperping.com/docs/monitoring/ssl). For the registration itself, see [domain expiry monitoring](https://hyperping.com/docs/monitoring/domain-expiry). ## What are the API rate limits? By default, every project is limited to 800 API requests per hour, calculated on a rolling window. Each project has its own separate quota, tracked by API token, with a per-IP fallback when no valid token is provided. When you exceed the limit, the API returns `429 Too Many Requests` with a `retry-after` header, and every response includes a `ratelimit` header so you can track your usage. Paid plans can request higher limits from support. Full details in [API rate limits](https://hyperping.com/docs/monitoring/api-rate-limits). ## What are the browser check limits? Each browser check runs a Playwright script in headless Chromium with a 2-minute global timeout per run. Individual tests inherit Playwright's 30-second default timeout, which you can override with `test.setTimeout`. Double check is enabled by default: a failed run is immediately retried from a different region before an outage opens. Every run keeps its logs, screenshots, video, and trace indefinitely. Long flows are usually better split into separate checks, one per critical path. See [Browser checks](https://hyperping.com/docs/monitoring/browser-checks). ## Next steps [ Datacenter regions→ The full list of 18 regions and how checks rotate through them. ](https://hyperping.com/docs/monitoring/datacenter-regions)[ Escalation policies→ Route alerts in order, with delays, until resolved. ](https://hyperping.com/docs/monitoring/escalation-policies)[ Healthchecks→ Monitor cron jobs and scheduled tasks that must never fail silently. ](https://hyperping.com/docs/monitoring/healthchecks)[ How we calculate uptime→ What counts as up, what counts as down, and the math behind the number. ](https://hyperping.com/docs/status-page/uptime-calculation) [← Monitoring overview](https://hyperping.com/docs/monitoring)[Datacenter regions →](https://hyperping.com/docs/monitoring/datacenter-regions) [](https://x.com/hyperping)[](https://www.linkedin.com/company/hyperping) © 2026 Hyperping --- Source: https://hyperping.com/docs/monitoring/ping-port # Ping (ICMP) and TCP port monitoring Monitor any host or network service that doesn't speak HTTP, and get alerted the moment it stops responding. [HTTP monitors](https://hyperping.com/uptime-monitoring) cover websites and APIs, but plenty of infrastructure never answers an HTTP request: bare servers, databases, mail servers, game servers, VPN endpoints. Ping and port monitors cover these cases. (ICMP itself has no port number; if you are configuring a firewall for it, see [why ping has no port and what to open](https://hyperping.com/blog/icmp-port-number).) A ping (ICMP) monitor tells you whether a host is reachable at all. A port monitor tells you whether a specific service on that host is accepting connections. Use them when you want to know that: - A server or network appliance is up and reachable, independently of any web service it runs. - A database, cache, or mail server is accepting connections on its port. - A game server or any custom TCP service is listening where clients expect it. ## Create a ping (ICMP) monitor 1. Open the new monitor form Go to your [dashboard](https://app.hyperping.io) and click the **New monitor** card. 2. Name the monitor Give it a readable name, for example "DB server" or "Office gateway". 3. Select the ICMP protocol Choose **ICMP** in the protocol list. 4. Enter a hostname or IP address For example `db.example.com` or `203.0.113.10`. Don't include `http://` or `https://`, those prefixes are for HTTP monitors. 5. Save The first check runs immediately and you're redirected to the monitor's detailed view. ICMP performs a simple echo request, commonly called a ping. The host either returns an echo response, in which case it's considered up, or it doesn't, in which case the check fails. There's nothing else to configure: no status codes, no request bodies. > **Host up but pings failing?** > > Some networks and cloud firewalls block ICMP entirely. If your host is up but pings are filtered, the monitor will report it as down. In that case, monitor a TCP port instead. ![The create monitor form in ping mode with an IP address and regions](https://hyperping.com/static/create-monitor-ping-0e26799f743f6b679c20e3d212262974.webp) A ping monitor: name, IP address, and the ICMP protocol selected ## Create a port monitor 1. Open the new monitor form Go to your [dashboard](https://app.hyperping.io) and click the **New monitor** card. 2. Select the Port protocol Choose **Port** in the protocol list. 3. Enter a hostname or IP address The same way as for ICMP. 4. Enter the port number For example `5432` for PostgreSQL. The port is required for this protocol. 5. Save Checks start right away. A port monitor attempts a TCP connection to the given host and port. If the connection is accepted, the service is considered up. If it's refused or times out, the check fails and, once confirmed, alerts go out. ## Regions and check intervals Ping and port monitors use the same regions and scheduling as every other monitor. Checks are performed from one selected region at a time, rotating between them: 1. Minute 1: check from Paris: OK 2. Minute 2: check from Frankfurt: OK 3. Minute 3: check from London: not OK. Hyperping immediately double-checks from the other selected regions. If they all fail too, the downtime is confirmed and alerts are sent. This double-checking matters for network-level monitors: a single region can lose a route to your host while the rest of the internet reaches it fine. Requiring confirmation from other regions filters out these localized blips. The default check interval is 30 seconds. Selecting [regions](https://hyperping.com/docs/monitoring/datacenter-regions) close to your infrastructure keeps latency measurements meaningful, since checks from far away include the round trip in their timings. Ping and port monitors can also run over IPv6: switch **IP version** to **IPv6** in the monitor's advanced settings, or pass `"ip_version": 6` through the API. See [IP version](https://hyperping.com/docs/monitoring/create-monitor#ip-version). > **Plan availability** > > Going lower than 30 seconds requires a Business or Enterprise plan. ## Common examples | Service | Protocol | Port | | --- | --- | --- | | SMTP (mail server) | Port | 25 or 587 | | PostgreSQL | Port | 5432 | | Redis | Port | 6379 | | SSH | Port | 22 | | Server or gateway reachability | ICMP | n/a | Only expose and monitor ports that are meant to be reachable from the internet. If your database only listens on a private network, Hyperping's pingers won't be able to reach it, and it's usually better kept that way. ## Limitations compared to HTTP monitors Ping and port monitors check reachability, not correctness. The HTTP advanced settings don't apply here: there's no expected status code and no text body assertion. A port monitor will happily report your database as up as long as something accepts the TCP connection, even if the service behind it is misbehaving. Two ways to close that gap: - If the service has any HTTP surface, such as an admin endpoint or a health endpoint, prefer an HTTP monitor with an [expected status code or body assertion](https://hyperping.com/docs/monitoring/create-monitor). - For correctness checks that only your own code can perform, run a periodic script that queries the service and pings a [healthcheck](https://hyperping.com/docs/monitoring/healthchecks) on success. You get alerted when the script stops reporting in. ## API and Terraform Both monitor types are available through the [create monitor API](https://hyperping.com/docs/api/monitors/create). Set `protocol` to `icmp` or `port`, pass the hostname in `url`, and include the `port` number when the protocol is `port`: ```bash curl -X POST https://api.hyperping.io/v1/monitors \ -H "Authorization: Bearer ${API_TOKEN}" \ -H "Content-Type: application/json" \ -d '{ "name": "PostgreSQL primary", "url": "db.example.com", "protocol": "port", "port": 5432, "regions": ["paris", "frankfurt", "london"], "check_frequency": 30 }' ``` If you manage your monitoring as code, the [Terraform provider](https://hyperping.com/integrations/terraform) exposes the same fields on the `hyperping_monitor` resource. ## Next steps [ Healthchecks→ Get alerted when a cron job or background script stops reporting in. ](https://hyperping.com/docs/monitoring/healthchecks)[ DNS monitoring→ Catch expired domains and hijacked records before your users do. ](https://hyperping.com/docs/monitoring/dns)[ Escalation policies→ Route alerts in order, with delays, until resolved. ](https://hyperping.com/docs/monitoring/escalation-policies)[ Create monitor API→ Every monitor field, scriptable from your own tooling. ](https://hyperping.com/docs/api/monitors/create) [← How to create a monitor](https://hyperping.com/docs/monitoring/create-monitor)[Datacenter regions →](https://hyperping.com/docs/monitoring/datacenter-regions) [](https://x.com/hyperping)[](https://www.linkedin.com/company/hyperping) © 2026 Hyperping --- Source: https://hyperping.com/docs/monitoring/quickstart # Monitoring quickstart Create your first monitor and get alerted on downtime, in under 2 minutes. > **Before you start** > > You need a Hyperping account. [Create one for free](https://app.hyperping.io/register): no credit card required. 1. Create a monitor From your [dashboard](https://app.hyperping.io), click **New monitor**. Give it a name (like "Website") and enter the URL to check. An IP address works too. Hit **Save**. 2. You're already covered Your monitor is now checked every 30 seconds from multiple regions, and down or up alerts go to your signup email automatically. Nothing else to configure. 3. Add the channels your team actually watches Connect Slack, SMS, phone calls or webhooks from your [notification channels](https://hyperping.com/docs/projects/notification-channels), and invite [teammates](https://hyperping.com/docs/projects/teammates) so they get alerted too. ## Prefer the API? The same monitor, created programmatically: ```bash curl -X POST https://api.hyperping.io/v1/monitors \ -H "Authorization: Bearer ${API_TOKEN}" \ -H "Content-Type: application/json" \ -d '{ "name": "Website", "url": "https://acme.com", "protocol": "http", "check_frequency": 30, "regions": ["paris", "london", "virginia"] }' ``` **Response201 Created** ```json { "name": "Website", "url": "https://acme.com", "paused": false, "regions": ["paris", "london", "virginia"], "http_method": "GET", "check_frequency": 30, "uuid": "mon_3GhAQMYGEQuyUH", "status": "up", "ssl_expiration": 90, "alerts_wait": 0 } ``` See the [Monitors API](https://hyperping.com/docs/api/monitors) for every field, or the [Terraform provider](https://hyperping.com/docs/community/terraform) to manage monitors as code. ## Manage your monitor Everything is editable after creation: [edit its settings](https://hyperping.com/docs/monitoring/edit-monitor), pause its checks, or [delete it](https://hyperping.com/docs/monitoring/delete-monitor) along with its history. ## Troubleshooting **My monitor shows down, but the site loads in my browser** Open the monitor's [logs](https://hyperping.com/docs/monitoring/logs) to see the exact response we received. The usual causes: the endpoint returns a status code outside 200-299 (set an [expected status code](https://hyperping.com/docs/monitoring/create-monitor)), redirects are not followed, or a text body assertion no longer matches. **No data after saving** Saving triggers the first check immediately. If nothing shows after a minute, verify the URL is reachable from the public internet and includes http:// or https://. ## Next steps [ All monitor settings→ Protocols, regions, intervals, and advanced HTTP options. ](https://hyperping.com/docs/monitoring/create-monitor)[ Escalation policies→ Decide who gets paged, in what order, until acknowledged. ](https://hyperping.com/docs/monitoring/escalation-policies)[ Create a status page→ Show your uptime to users on your own domain. ](https://hyperping.com/docs/status-page/create-status-page)[ Monitor cron jobs→ Catch scheduled tasks that fail silently. ](https://hyperping.com/docs/monitoring/healthchecks) [](https://x.com/hyperping)[](https://www.linkedin.com/company/hyperping) © 2026 Hyperping --- Source: https://hyperping.com/docs/monitoring/reports # Uptime reports Track uptime, outages, MTTA and MTTR across your monitors, and export the numbers for SLA reviews. To convert an SLA percentage into the downtime it allows, use the [SLA and uptime calculator](https://hyperping.com/sla-calculator). The reporting dashboard aggregates your monitoring data into per-monitor statistics: uptime percentage, outage counts, total downtime, and recovery metrics like [MTTR and MTTA](https://hyperping.com/glossary/mttr). It gives you both a high-level view across all monitors and the ability to drill down into specific incidents or timeframes. Reports are useful when: - You need to prove uptime to a customer or auditor as part of an [SLA](https://hyperping.com/glossary/sla) - You run a monthly or quarterly reliability review with your team - You are writing a postmortem and need exact outage counts and durations - You want to track how quickly your on-call team acknowledges and resolves incidents ## Access the reporting dashboard 1. Open the Reporting section Open the [Hyperping dashboard](https://app.hyperping.io/reporting/outages) and click **Reporting** in the left sidebar. 2. Set the period and filters Adjust the report period to the timeframe you want to review, and filter down to the monitors or incidents you care about. ![The reporting dashboard showing incident counts, total downtime, MTTR, and the incident table](https://hyperping.com/static/reporting-incidents-bd7d404d1be4ccac5dc8bab3c8563465.webp) The Incidents report: daily incident counts, totals, and the incident log ## What the report shows | Metric | Description | | --- | --- | | Uptime (SLA) | Percentage of time the monitor was up during the selected period | | Outages | Number of outages, total downtime, and the longest outage in the period | | MTTR | Mean Time to Recovery: how long it takes on average to resolve an outage | | MTTA | Mean Time to Acknowledge: how long it takes on average for a team member to acknowledge an alert | The dashboard also keeps a complete outage history you can browse and filter, so every number in the report can be traced back to the individual incidents behind it. ## Uptime SLA reporting If your contracts include an availability commitment, the report gives you the evidence. Set the report period to your contractual reporting window, typically a calendar month or quarter, and read the uptime percentage per monitor. A 99.9% monthly target allows roughly 43 minutes of downtime, so the outage breakdown shows exactly where that budget went. Because Hyperping checks your services from the outside, these numbers reflect what your customers actually experienced, which is what auditors and customers ask for in SLA reviews. > **Plan availability** > > The reporting dashboard, the MTTA, MTTR and other KPIs, CSV export, and uptime SLA reporting are included in all paid plans, starting with Essentials. See the [pricing page](https://hyperping.com/pricing) for details. ## Weekly email reports Hyperping can also send you a weekly report by email: a recurring summary of how your monitors performed over the past week, so your team gets the numbers without opening the dashboard. Weekly reports are available on every plan, including Free. If you would rather not receive them, you can turn them off from your settings in the dashboard. ## Export to CSV You can download your metrics in CSV format for custom analysis. The export respects the filters you applied, so you can hand a customer the exact period covered by their SLA, or pull outage data into a spreadsheet for a postmortem. Common uses: - Attaching uptime evidence to an SLA review or compliance audit - Building custom charts in a spreadsheet or BI tool - Archiving monthly reliability numbers alongside your postmortems ## Pull reports programmatically The same data is available through the [Reports API](https://hyperping.com/docs/api/reports). It returns SLA, MTTR and outage data for all monitors in your project, or for a single monitor: ```bash curl https://api.hyperping.io/v2/reporting/monitor-reports \ -H "Authorization: Bearer ${API_TOKEN}" ``` **Response200 OK** ```json { "period": { "from": "2025-04-30T23:28:48.404Z", "to": "2025-05-06T23:28:48.404Z" }, "monitors": [ { "uuid": "mon_e3nJvpusxl6l3C", "name": "Website", "protocol": "http", "sla": 99.184, "outages": { "count": 2, "totalDowntime": 4231, "totalDowntimeFormatted": "1hr 10min 31s" }, "mttr": 2116, "mttrFormatted": "35min 16s" } ] } ``` Pass `from` and `to` query parameters in ISO 8601 format to set the period. Without them, the report covers the last 7 days. The response includes each monitor's `sla`, outage counts and durations, and `mttr`, so you can feed the numbers into your own dashboards or scheduled SLA jobs. Your API token is available in the [Developers tab](https://app.hyperping.io/project/developers) of your project settings. ## Query reports from AI assistants If you use Claude, Cursor, or another assistant that supports MCP, you can connect it to the [Hyperping MCP server](https://hyperping.com/docs/mcp) and ask for these numbers in plain language. The server exposes reporting tools like `get_monitor_uptime`, `get_monitor_mttr` and `get_monitor_mtta`, so questions like "what was our uptime last month" or "which monitor has the worst MTTR" get answered from your live data. ## Next steps [ Reports API→ The full endpoint reference for programmatic reporting. ](https://hyperping.com/docs/api/reports)[ Response times→ Latency trends per region, from your customers' perspective. ](https://hyperping.com/docs/monitoring/response-times)[ Monitor logs→ The individual checks behind every uptime number. ](https://hyperping.com/docs/monitoring/logs)[ MCP server→ Ask for uptime and MTTR numbers from AI assistants. ](https://hyperping.com/docs/mcp) [← Response times](https://hyperping.com/docs/monitoring/response-times)[API Rate Limits →](https://hyperping.com/docs/monitoring/api-rate-limits) [](https://x.com/hyperping)[](https://www.linkedin.com/company/hyperping) © 2026 Hyperping --- Source: https://hyperping.com/docs/monitoring/response-times # Response time monitoring Track how fast your endpoints respond from your customers' perspective, and spot degradation before it becomes an outage. Every check Hyperping performs on a monitor records a response time, measured in milliseconds from request to response. Checks run from datacenters around the world, so the numbers reflect what users in each region actually experience rather than what your servers report from the inside. For a one-off check without creating a monitor, [check any URL from 17 regions](https://hyperping.com/is-my-site-down). Response time data is useful when: - You want to confirm that a deployment did not slow down your API - You suspect users in one region are getting slower responses than others - You want to catch gradual degradation before it turns into downtime - You need latency numbers to back up a conversation about performance ## What Hyperping measures Each check produces one response time data point, tagged with the region that ran it. Checks run at the frequency you configure on the monitor, from every 10 seconds up to every 24 hours, so a frequent check builds a dense picture of your endpoint's latency throughout the day. Hyperping aggregates these data points by region and continent on the monitor's report page. The raw check-by-check records remain available in the [monitor logs](https://hyperping.com/docs/monitoring/logs). ![Monitor overview with response time graphs per zone and per-region check logs](https://hyperping.com/static/monitor-response-times-fea8ad452d50b43db8e89342f692d698.webp) A monitor page: response time per zone, per-region logs, and the HTTP breakdown ## Read the response time graphs 1. Open a monitor Open the [Hyperping dashboard](https://app.hyperping.io) and click on a monitor. 2. Review the graphs The monitor's report page shows response time graphs alongside its uptime data, aggregated by continent and region. A few patterns worth recognizing: | Pattern | What it usually means | | --- | --- | | Step change after a deploy | A code or infrastructure change introduced a regression | | Slow rise over days or weeks | Growing load or data volume is pushing your service toward its limits | | Isolated spikes | Transient events such as scheduled jobs, backups, or garbage collection pauses | | One region consistently elevated | A routing or infrastructure problem specific to that geography | ## Spot regional slowness Hyperping checks from 18 locations across North America, Europe, Asia, Oceania, and South America. Because every data point carries its region, you can compare geographies directly and find degradation that only affects part of your audience. > **Some variation between regions is normal** > > Checks from datacenters close to your servers will always be faster than checks from the other side of the world. What matters is change: a region that used to sit at a stable baseline and now runs consistently higher deserves a look at your CDN, DNS, or routing for that area. If the regions being checked do not match where your users are, adjust them from the monitor's settings. See [Datacenter regions](https://hyperping.com/docs/monitoring/datacenter-regions) for the full list of available locations. ## Drill into individual checks Graphs show the trend; logs show the evidence. When a graph reveals a spike or a slow region, open the **Logs** tab on the monitor's report page to see the individual checks behind it, each with its status code, response time, region, and timestamp. This is the fastest way to answer questions like "was that spike one slow check or twenty?" or "did the slow responses also return errors?". See [Monitor logs](https://hyperping.com/docs/monitoring/logs) for the full field reference. ## Uptime monitoring vs performance monitoring Response time data from Hyperping tells you how your service behaves from the outside: whether it responds, how fast, and from where. It reflects the full path a real request travels, including DNS, TLS, CDN, and network transit. It does not tell you why your service is slow. Internal metrics such as database query times, per-route latency, error rates, and resource consumption belong to application performance monitoring (APM). The two are complementary: Hyperping tells you that something is slow or down before your customers notice, and your APM helps you find the cause. ## Track trends and export data The report page graphs cover trend analysis for day-to-day work. For programmatic reporting, the [Reports API](https://hyperping.com/docs/api/reports) returns SLA, MTTR, and outage data for every monitor in your project: ```bash curl https://api.hyperping.io/v2/reporting/monitor-reports \ -H "Authorization: Bearer ${API_TOKEN}" ``` Pull the numbers into your own dashboards or share them with stakeholders alongside the response time graphs. ## Query response times from AI assistants Hyperping's MCP server lets AI assistants query your monitoring data directly. The `get_monitor_response_time` tool returns the latency trend for your monitors, so you can ask questions like "did checkout get slower this week?" in plain language and get an answer backed by real check data. The related `get_monitor_anomalies` tool flags latency spikes automatically. See the [MCP server documentation](https://hyperping.com/docs/mcp) for setup and the full tool reference. ## Next steps [ Monitor logs→ The check-by-check records behind every graph. ](https://hyperping.com/docs/monitoring/logs)[ Uptime reports→ Uptime, outages, MTTA and MTTR across your monitors. ](https://hyperping.com/docs/monitoring/reports)[ Datacenter regions→ Choose where in the world your checks run from. ](https://hyperping.com/docs/monitoring/datacenter-regions)[ MCP server→ Query your monitoring data from AI assistants. ](https://hyperping.com/docs/mcp) [← Logs](https://hyperping.com/docs/monitoring/logs)[Uptime reports →](https://hyperping.com/docs/monitoring/reports) [](https://x.com/hyperping)[](https://www.linkedin.com/company/hyperping) © 2026 Hyperping --- Source: https://hyperping.com/docs/monitoring/ssl # SSL Monitoring Get alerted before your SSL certificate expires, and as soon as it starts failing for your visitors. Hyperping checks the certificate of every HTTPS monitor once a day, with no extra setup. For an overview of the feature, see [SSL monitoring](https://hyperping.com/ssl-monitoring). ![SSL certificate panel showing a valid certificate, 84 days left, and seven passed checks](https://hyperping.com/static/ssl-certificate-panel-0b70cfed12cf33d9884714ea4462c93a.webp) The SSL certificate panel of a monitor: days left, the alert window, and every check > **Enabled by default** > > Every HTTPS monitor is checked, along with port monitors on ports that speak TLS directly: 443, 7443, 8443, 9443, 4443, 10443, 6443, 2083, 2087, 8006, 993, 995, 465, 636, 8883 and 5986. A URL with a custom port, like `https://example.com:8443`, is checked on that port. ## What is checked Each check opens one TLS connection, the way a browser would, and verifies what the server actually serves. A certificate your provider renewed but your server doesn't serve yet still counts as expiring. | Check | Fails when | | --- | --- | | **Expired** | The certificate, or an intermediate the server relies on, is past its end date. | | **Not yet valid** | The start date is in the future (often a server clock problem, or a certificate installed too early). | | **Hostname mismatch** | None of the names in the certificate covers the monitored host. Wildcards and IP addresses are matched the way browsers match them. | | **Self-signed** | The certificate signs itself instead of being issued by an authority. | | **Untrusted root** | The chain ends at an authority browsers don't trust, such as a private or internal CA. | | **Incomplete chain** | The server doesn't send the intermediate certificates. Some browsers repair this on their own; curl, Android and most API clients don't. | | **Invalid chain** | Any other reason the chain doesn't verify against the public trust store. | | **Revoked** | The authority revoked the certificate. Checked with the response the server staples, the authority's OCSP responder, or its revocation list (CRL), which is what Let's Encrypt uses. | | **Outdated TLS** | The server only offers TLS 1.0 or 1.1, which current browsers refuse. | | **Weak signature** | The certificate or an intermediate is signed with SHA-1 or MD5. | | **Weak key** | A key shorter than 2048-bit RSA (or 224-bit ECDSA). Shown on the monitor, never alerted. | ![SSL certificate panel showing a hostname mismatch: 6 of 7 checks passed](https://hyperping.com/static/ssl-certificate-error-96e1cbc327d471db95cf4528d3ee46c9.webp) A failing check is spelled out in the panel, with what browsers will do about it ## Expiry alerts In the monitor's **Notifications** tab, **SSL Expiry Alerts** sets how many days before expiry the first alert goes out: 1, 3, 7, 15, 30, 60 or 90 days, or never. With **Send reminders** on, a reminder follows at each step below it: with 30 days, alerts go out at 30, 15, 7, 3 and 1 days before expiry. ![Notifications tab with SSL notification channels, SSL Expiry Alerts, Send reminders and Certificate changes](https://hyperping.com/static/ssl-notifications-db5e235e5ed166f1a7816439e3ffbb76.webp) The SSL monitoring settings in the monitor's Notifications tab - **Nothing is missed.** If a check couldn't run on the day a reminder was due, the reminder goes out on the next check, once. - **No reminder after a renewal.** The certificate is read again right before a reminder is sent: if it was renewed in the meantime, nothing goes out. If you had already been warned, a **renewed** notice follows instead. - **Who gets them.** Everyone on the project by email, plus the monitor's SSL notification channels (Slack, Microsoft Teams, Discord, Google Chat, Telegram, webhooks). PagerDuty and Opsgenie are only paged in the last 24 hours, and the renewal resolves the page. > **60 or 90 days with short-lived certificates** > > Let's Encrypt and most automated certificates last 90 days. With a 60 or 90-day threshold, every renewal immediately falls inside the alert window. Keep those thresholds for certificates that last a year. ## Certificate error alerts When a check finds a new problem, the monitor's SSL notification channels get an alert listing every issue on the certificate. When all problems are gone, they get a resolved notification. An issue that persists is not repeated every day, and an issue that was already there when the monitor was created is shown on the monitor but doesn't trigger an alert. Pick the channels in the monitor's **Notifications** tab, under **SSL notification channels**. ## Certificate change notifications Turn on **Certificate changes** to be told whenever the server starts serving a different certificate: a renewal, a new issuer, a new key. The notification shows the new and the previous certificate. It goes to the SSL channels, or to the team by email if the monitor has none. A load balancer or CDN that serves several certificates at once doesn't trigger it: a certificate seen in one of the last three checks doesn't count as new. ## Monitor list and certificate details Each HTTPS monitor in the list shows the days left on its certificate, and a badge such as **CN Mismatch** when a check fails. Click **Filter**, then **Certificate errors**, and pick one type of error (expired, self-signed, hostname mismatch, revoked, incomplete chain…) or **Has any certificate error**. ![Monitor list filtered on Has any certificate error, with Expired, Self-signed, Revoked, CN Mismatch and Incomplete Chain badges](https://hyperping.com/static/ssl-monitor-list-e8a5721de54ba9ebf25564d34501ea7f.webp) Monitors filtered on a certificate error On a monitor's **Overview**, the **SSL** button (with the days left) opens the **SSL certificate** panel: - **Status and lifetime.** Valid, expiring or failing, the days left, and a bar from the issue date to the expiry date with the alert window marked. A warning appears when an automated certificate is past the point where it should have renewed. - **Expiry alert.** When the first alert and the reminders will fire. **Change** opens the Notifications tab. - **Checks.** Each check from the table above, with an explanation when it fails. - **Hostnames covered**, **Details** (common name, issuer, validity, serial number, first seen) and the **Chain of trust** the server sends. - **Domain registration**, when known: see [domain expiry monitoring](https://hyperping.com/docs/monitoring/domain-expiry). ## Refresh a certificate manually Certificates are checked daily around 04:00 UTC. To read a renewed certificate right away: 1. Open your monitor Go to the monitor whose certificate you renewed. 2. Open the certificate panel On the **Overview** tab, click the **SSL** button. 3. Click Recheck The panel refreshes with the certificate the server serves now. Alerts follow the same rules as the daily check. On a monitor with no certificate read yet, the button is called **Fetch certificate**. ## API and Terraform The same settings are available on [monitors in the API](https://hyperping.com/docs/api/monitors/update): `ssl_alert_days` (-1 for never), `ssl_reminders` and `ssl_notify_on_change`. `ssl_expiration` is read-only: the whole days left before the certificate expires, rounded down, so a certificate expiring tomorrow afternoon shows `1`. The Terraform provider's `hyperping_monitor` resource takes the same three settings. ```bash curl -X PUT https://api.hyperping.io/v1/monitors/mon_3GhAQMYGEQuyUH \ -H "Authorization: Bearer ${API_TOKEN}" \ -H "Content-Type: application/json" \ -d '{ "ssl_alert_days": 30, "ssl_reminders": true, "ssl_notify_on_change": true }' ``` ## Webhook payloads Webhooks added as SSL channels receive certificate error alerts in the same shape as before: ```json { "event": "down", "isDown": true, "status": "SSL_ERRORS_DETECTED", "sslEvent": true, "domain": "https://example.com", "alias": "Website", "timestamp": "Oct 01 2026, 04:02:11 UTC" } ``` Informational notices have their own `event` and always carry `"isDown": false`, so a consumer that acts on `event === "down"` ignores them: `ssl_expiring`, `ssl_renewed`, `ssl_changed`, `domain_expiring` and `domain_renewed`. ```json { "event": "ssl_expiring", "isDown": false, "status": "SSL_EXPIRING_SOON", "sslEvent": true, "monitorUuid": "mon_3GhAQMYGEQuyUH", "domain": "https://example.com", "alias": "Website", "daysRemaining": 7, "expirationDate": "2026-10-08T23:59:59.000Z", "issuer": "R11", "fingerprint": null, "previous": null, "timestamp": "Oct 01 2026, 10:00:03 UTC" } ``` ## Troubleshooting **The certificate works in my browser but Hyperping reports an incomplete chain** Browsers fetch or cache missing intermediates; most other clients don't. Configure your server to send the full chain (on nginx, use the `fullchain.pem` file rather than `cert.pem`). **Untrusted root on an internal service** Services behind a private CA are reported as untrusted, because browsers and API clients without your CA installed would refuse them. The problem existing when the monitor is created doesn't send an alert; only a change does. **The certificate didn't update after renewal** Click **Recheck**. If the old certificate is still shown, your server, load balancer or CDN still serves it: reload the web server, or check that the CDN has the new certificate. DNS changes can also take time to reach every resolver. **An HTTPS monitor shows no certificate** The check couldn't complete a TLS handshake (host down, port closed, firewall, or a server that only accepts a specific client). The last certificate read stays on the monitor until a check succeeds again. ## Next steps [ Domain expiry monitoring→ Get warned before the domain registration itself lapses. ](https://hyperping.com/docs/monitoring/domain-expiry)[ DNS monitoring→ Catch hijacked or broken records before your users do. ](https://hyperping.com/docs/monitoring/dns)[ Ping and port monitoring→ Monitor hosts and services that don't speak HTTP. ](https://hyperping.com/docs/monitoring/ping-port)[ Escalation policies→ Route alerts in order, with delays, until resolved. ](https://hyperping.com/docs/monitoring/escalation-policies) [← Datacenter regions](https://hyperping.com/docs/monitoring/datacenter-regions)[Domain expiry monitoring →](https://hyperping.com/docs/monitoring/domain-expiry) [](https://x.com/hyperping)[](https://www.linkedin.com/company/hyperping) © 2026 Hyperping --- Source: https://hyperping.com/docs/status-page # Status page Documentation ### Table of contents - [Create a status page](https://hyperping.com/docs/status-page/create-status-page) - [Add services](https://hyperping.com/docs/status-page/add-services) - [Components](https://hyperping.com/docs/status-page/components) - [Sections](https://hyperping.com/docs/status-page/sections) - [Incident calendar](https://hyperping.com/docs/status-page/incident-calendar) - [Publish and manage incidents](https://hyperping.com/docs/status-page/incidents) - [Public post-mortems](https://hyperping.com/docs/status-page/post-mortems) - [Custom domain](https://hyperping.com/docs/status-page/custom-domain) - [Subscribers](https://hyperping.com/docs/status-page/subscribers) - [Private status pages](https://hyperping.com/docs/status-page/private-status-pages) - [Status page SSO](https://hyperping.com/docs/status-page/sso) - [White labeling](https://hyperping.com/docs/status-page/white-labeling) - [Multi-language status pages](https://hyperping.com/docs/status-page/languages) - [SMS Notifications (Twilio)](https://hyperping.com/docs/status-page/sms-notifications) - [RSS and Atom feeds](https://hyperping.com/docs/status-page/rss-atom-feeds) - [Status Page JSON](https://hyperping.com/docs/status-page/status-page-json) - [Status page public API](https://hyperping.com/docs/status-page/public-api) - [Footer badge](https://hyperping.com/docs/status-page/footer-badge) - [SEO and analytics](https://hyperping.com/docs/status-page/seo-analytics) - [How we calculate uptime](https://hyperping.com/docs/status-page/uptime-calculation) - [Go-live checklist](https://hyperping.com/docs/status-page/go-live-checklist) - [Migrate to version 2](https://hyperping.com/docs/status-page/migrate-to-v2) - [Import from Statuspage.io](https://hyperping.com/docs/status-page/import-from-statuspage) [](https://x.com/hyperping)[](https://www.linkedin.com/company/hyperping) © 2026 Hyperping --- Source: https://hyperping.com/docs/status-page/add-services # Add services to your status page Show the status of your services on a dedicated page and inform your users about incidents in real time. Services use our built-in monitoring to show their real-time status inside your status page. When our systems detect an outage, your service's status will automatically be updated on your status page. > **Before you start** > > Services use your monitors to show the real-time status, so make sure that you have already [created one](https://hyperping.com/docs/monitoring/getting-started). Services live inside [sections](https://hyperping.com/docs/status-page/sections). [Healthchecks](https://hyperping.com/docs/monitoring/healthchecks) can be added too, so a scheduled job shows up as a service with its uptime. ![Add services to status page interface](https://hyperping.com/static/add-services-4e3fbb700522ad7635a7372eb901cc01.webp) Adding services from the Sections tab of the builder ### Add a service Services are added within [Sections](https://hyperping.com/docs/status-page/sections). You can add as many services as you'd like. 1. Open the Sections tab Go to your status page settings and head to the **Sections** tab. 2. Open a section Open the section you want the service to appear in. 3. Pick a monitor Hover on any service in the **Available** list to add it. It will be added and shown in the preview. ### Show service's metrics Each monitored service comes with 2 optional metrics that can be displayed: - **Uptime**: shows a graph of historical data of the past 90 days of the service's uptime, in percentage of availability. - **Response time**: shows a graph of the response time from our monitoring over the past 24 hours. It helps give a sense of the current responsiveness/latency of your applications. To enable these options, click on the **Gear icon** over the selected service. > **Where does the uptime number come from?** > > See [How we calculate uptime](https://hyperping.com/docs/status-page/uptime-calculation) for the exact formula behind the graphs your visitors see. ### Change a service's name Monitor names can be different than what you'd like your users to see. Upon adding a service and clicking on the **Gear icon**, you can change your service's name. ### Change services' order To change your services' order, hover a service and click on either the top or down arrow to change its position within the section. ### Components or dummy monitors Components are dummy monitors added to status pages that can be manually updated by selecting them when creating an [incident](https://hyperping.com/docs/status-page/incidents) or [maintenance window](https://hyperping.com/docs/maintenance/create-maintenance). ## Next steps [ Sections→ Group your services into sections and logical groups. ](https://hyperping.com/docs/status-page/sections)[ Publish incidents→ Report incidents on your page and notify subscribers. ](https://hyperping.com/docs/status-page/incidents)[ How we calculate uptime→ The formula behind the uptime numbers your visitors see. ](https://hyperping.com/docs/status-page/uptime-calculation)[ Go-live checklist→ Everything to verify before you announce your status page. ](https://hyperping.com/docs/status-page/go-live-checklist) [← Create a status page](https://hyperping.com/docs/status-page/create-status-page)[Components →](https://hyperping.com/docs/status-page/components) [](https://x.com/hyperping)[](https://www.linkedin.com/company/hyperping) © 2026 Hyperping --- Source: https://hyperping.com/docs/status-page/components # Components Put things on your status page that Hyperping does not monitor, and set their status by hand. Most services on a status page are backed by a monitor: Hyperping checks them and the status updates itself. A component is the other kind. It appears on your page like any other service, but nothing checks it, so its status only changes when you publish an incident or a maintenance window that affects it. Components exist for everything you are accountable for but cannot ping: - A third-party service your product depends on, like a payment provider or an email sender - Something with no public endpoint: a data pipeline, a batch job, an internal queue - A physical or human dependency, like an office network or a support desk - A service you want listed on the page before its monitor exists > **Component or monitored service?** > > If Hyperping can reach it over HTTP, TCP, ping, or a browser check, make it a [monitor](https://hyperping.com/docs/monitoring/create-monitor) and [add it as a service](https://hyperping.com/docs/status-page/add-services). You get automatic status, uptime history, and response times. Reach for a component only when there is nothing to check. ## Create a component 1. Open Components Go to [Components](https://app.hyperping.io/components) in the sidebar, under Status Pages. 2. Create it Hit **New component** and give it the name your visitors should see, for example "Payment provider" or "Email delivery". 3. Add it to a status page Open your status page and add the component the same way you [add a service](https://hyperping.com/docs/status-page/add-services). One component can sit on several status pages, and the Components list shows which pages each one appears on. ## Changing a component's status A component sits at operational until you say otherwise. To change that, publish an [incident](https://hyperping.com/docs/status-page/incidents) or a [maintenance window](https://hyperping.com/docs/maintenance/create-maintenance) and select the component as an affected service. Its status on the page follows the incident, and returns to operational when you resolve it. That is the whole model: there is no separate status dropdown to forget about, and no way for a component to be stuck red with no incident explaining why. ## What components do not have Because nothing checks them, components carry no uptime percentage, no response time chart, and no 90-day history bar. On the page they show their current status and the incidents that touched them, nothing more. A page mixing monitored services and components will show uptime for some rows and not others, which is expected. ## Troubleshooting **My component shows no uptime bar** Working as intended. Uptime is computed from monitor checks, and a component has none. If you want a history bar, the service has to be backed by a monitor. **The component is stuck in a degraded state** An incident affecting it is still open. Resolve the incident, or remove the component from its affected services, and the status returns to operational. **I deleted a component that was on a live page** Deleting removes it from every status page it appeared on, and there is no undo. Recreate it and add it back to each page. Rename instead of deleting when you only need to change the wording, since renaming keeps the component on every page it is already on. ## Next steps [ Add services→ Put monitors and components on the page and group them. ](https://hyperping.com/docs/status-page/add-services)[ Publish incidents→ Select affected services and drive their status. ](https://hyperping.com/docs/status-page/incidents)[ Maintenance windows→ Schedule planned work on a component. ](https://hyperping.com/docs/maintenance/create-maintenance)[ Sections→ Organize services and components into groups. ](https://hyperping.com/docs/status-page/sections) [← Add services](https://hyperping.com/docs/status-page/add-services)[Sections →](https://hyperping.com/docs/status-page/sections) [](https://x.com/hyperping)[](https://www.linkedin.com/company/hyperping) © 2026 Hyperping --- Source: https://hyperping.com/docs/status-page/create-status-page # How to create a status page Build your status page with the status page builder. Every setting is covered below, from domains and access control to branding. > **Before you start** > > Services on a status page are powered by monitors, so make sure you have already [created a monitor](https://hyperping.com/docs/monitoring/getting-started). The editor consists of 3 sections (tabs): 1. [Settings](https://hyperping.com/docs/status-page/create-status-page#1-settings): edit the settings, such as your status page's name or custom domain. 2. [Sections](https://hyperping.com/docs/status-page/add-services): add services from your monitors, show uptime and/or response time graphs. 3. [Subscribers](https://hyperping.com/docs/status-page/subscribers): manage your subscribers. ![Status page builder interface](https://hyperping.com/static/status-page-builder-d8b97c2ffbafe2014773982639820759.webp) The status page builder ## 1\. Settings ### Custom domain You can use your own subdomain to host your status page. Create a CNAME record with a **status** value, pointing to **cname.hyperping.io**. > **Need the full domain walkthrough?** > > DNS propagation can take up to 24 hours. The [custom domain guide](https://hyperping.com/docs/status-page/custom-domain) covers apex domains, subdomains, and SSL certificates. ### Hyperping-hosted slug We offer the ability to quickly host your status page on our own **YOUR\_NAME.hyperping.app** domain. While DNS propagation of a custom domain can take up to 24 hours, this instantly gives you a URL you can share with your team or use for a demo, for example. ### Name The name to be used in the status page's header link: "**Go to Acme**". ### Website The website the link in the status page will head to. ### Status page description Display a small informative text explaining what this page is about. It will be shown underneath the top-level status. ### Subscriber notifications Select which channels your status page visitors can subscribe to whenever you publish an incident. You can enable up to 4 channels: - **Email**: subscribers will need to confirm their subscription. You can also add subscribers manually from the builder's **Subscribers** tab. - **Slack**: subscribers can easily connect any Slack channel. - **Microsoft Teams**: subscribers can receive notifications directly in their Teams channels. - **SMS**: you will need to connect your [own Twilio account](https://hyperping.com/docs/status-page/sms-notifications). See [Subscribers](https://hyperping.com/docs/status-page/subscribers) for how each channel works. ### Subscribe to specific updates Subscribers can choose which services they receive notifications about. ![Subscribe to specific updates](https://hyperping.com/static/subscribe-channels-ca0f410dfbefb10e0787ca5b23c2bd99.webp) Subscribers can pick the services they want updates for ### Password protection Protect your status page under a password that you can share with others. You can edit it at any time. ![Password protection sign in](https://hyperping.com/static/signin-baded42736f72de57fc5dca2a705f0ea.webp) The sign-in screen on a password protected status page ### SAML SSO Single sign-on for status page visitors requires Business and a separately billed SSO connection. Pro includes private pages protected by passwords or email access codes. Protect your status page with your identity provider, such as Okta, Microsoft Entra ID, Google Workspace or Auth0. Create the connection under **Status Pages → SSO Connections**, then turn on **SAML SSO** here and pick it in the **SSO Connection** dropdown. The toggle works with SAML and OpenID Connect connections alike. [Status page SSO](https://hyperping.com/docs/status-page/sso) walks through each provider. ### Google SSO Protect your status page under Google SSO. Add a domain under **Allowed emails domains** to let email addresses with specific domains log in to this status page. > **Plan availability** > > Google SSO is accessible starting Business plans. > **Building a private status page?** > > Password protection, Google SSO, and SSO connections are covered in depth in [Private status pages](https://hyperping.com/docs/status-page/private-status-pages). ### Hide from search engines A toggle whether you'd like to hide your page from being indexed and found by search engines. See [SEO and analytics](https://hyperping.com/docs/status-page/seo-analytics) for what it does and does not protect. ### Google Analytics Add your own Google Analytics tag. Both GA4 (`G-XXXXXXXXXX`) and Universal Analytics (`UA-XXXXXX-YY`) IDs are accepted. See [SEO and analytics](https://hyperping.com/docs/status-page/seo-analytics). ### Multi-language status pages Serve your status page in English, French, German, Dutch, Polish, Russian, or Swedish. Pick a default language on any plan, and add more from the Pro plan. Every incident and maintenance update then gets one text input per language. See the [multi-language guide](https://hyperping.com/docs/status-page/languages) for how visitors switch and how the feeds and API expose each language. ### Auto refresh and TV mode Turn this on and your status page refreshes itself every 60 seconds, and gains a control to expand to fullscreen. It is built for the screen nobody touches: a wallboard in the support room, a monitor above the ops desk, a spare TV in the office. Open the page on that display, switch it to fullscreen, and leave it. Nobody has to reload anything, and an incident you publish shows up there within the minute. Pair it with a [private page](https://hyperping.com/docs/status-page/private-status-pages) if the wallboard should carry internal services your customers do not see. > **Plan availability** > > Auto refresh and TV mode require the Pro plan. Additional languages are included from Pro. ## Customisation We offer customisation for your status page to match it best with your branding. ![Status page Appearance settings with font, theme, accent color, favicon, and logo](https://hyperping.com/static/builder-appearance-fe0a73dea286e15968c7a344dfb3472d.webp) The Appearance panel: font, theme, accent color, favicon, and logo, all in one place. ### Font Choose between a set of popular Google Fonts that we already include. ### Interface theme Choose between user's system preferences, or force only light or dark modes. ### Hide "Powered by" footer White label your status page by hiding our "Powered by" logo in the footer. > **Plan availability** > > Hiding the "Powered by" footer is accessible starting Business plans. > **Going for a fully branded page?** > > The [white labeling guide](https://hyperping.com/docs/status-page/white-labeling) combines the custom domain, the hidden footer, and subscriber emails sent from your own domain. ### Banner header Choose between a compact or large top-level status header. ### New design Opt in to the refreshed status page look: neutral grays, softer typography, and a unified status icon set. Service cards, incident cards, and the status banner share the same hairline borders and rounded corners, and the four status icons (operational, incident, outage, maintenance) come from a single set so the page reads consistently. The new design has its own light and dark palettes. ### Incident calendar Show a monthly calendar of incidents and maintenances at the bottom of the page. Learn more in the [Incident calendar](https://hyperping.com/docs/status-page/incident-calendar) docs. ### Accent color Choose your accent color. It will change the colors of the check icons, uptime bars, as well as the "Get Updates" button upon hovering. ### Favicon Customise your status page with your own favicon. ### Company logo Make your company logo appear in the top-left of the status page's header. ### Logo for dark mode Optionally upload a second logo to be shown when the page is in dark mode, so a dark logo stays visible. If you only set one logo, it is used in both themes. ### Logo height Adjust the rendered height of your logo, from 20 to 64 pixels. The default is 32 pixels and the width scales automatically. ## 2\. Add services Once you have configured your status page, add [sections and services](https://hyperping.com/docs/status-page/add-services) to show the systems your users care about. ## Next steps [ Add services→ Pick monitors to display, with uptime and response time graphs. ](https://hyperping.com/docs/status-page/add-services)[ Custom domain→ Serve your page from your own domain with automatic SSL. ](https://hyperping.com/docs/status-page/custom-domain)[ How we calculate uptime→ The formula behind the uptime numbers your visitors see. ](https://hyperping.com/docs/status-page/uptime-calculation)[ Go-live checklist→ Everything to verify before you announce your status page. ](https://hyperping.com/docs/status-page/go-live-checklist) [Add services →](https://hyperping.com/docs/status-page/add-services) [](https://x.com/hyperping)[](https://www.linkedin.com/company/hyperping) © 2026 Hyperping --- Source: https://hyperping.com/docs/status-page/custom-domain # How to setup a custom domain for your status page Host your status page under your own custom domain. ![Domain panel in the status page settings, with a custom domain and a Hyperping-hosted slug](https://hyperping.com/static/custom-domain-9a8996b975ef168d4610ad94a5529fae.webp) The Domain panel: add a custom domain, or use your Hyperping-hosted slug ## Custom domain Host your status page under any custom domain: either your apex domain (acme.com) or any subdomain (status.acme.com, uptime.acme.com, internal.status.acme.com, etc.). 1. Open Status Pages Go to [Status Pages](https://app.hyperping.io/v2/statuspage) in your Hyperping dashboard. 2. Pick a status page Pick the status page you want to add a domain to. 3. Enter your custom domain Enter your custom domain in the "Custom domain" section. 4. Publish Hit Publish. 5. Configure your DNS records Add the record shown in the panel to your DNS zone. The exact name and value are displayed with a copy button next to each one. ### DNS records | Domain | Type | Name | Value | | --- | --- | --- | --- | | Subdomain (status.acme.com) | CNAME | status | cname.hyperping.io | | Apex domain (acme.com) | A | @ | 216.150.1.1 | The **Name** is relative to your DNS zone, so a page on internal.status.acme.com uses _internal.status_, not the full hostname. Most DNS providers add the rest for you. Once the record is saved, leave the Domain panel open. It rechecks your DNS on its own, and you can force a check with the **Check DNS** button. When everything resolves, the panel shows **Connected · SSL certificate active** and we email you that the page is live. ### Domain verification (TXT record) A third record sometimes appears in the panel: a TXT record named **\_vercel**. It shows up when your domain is already in use on the infrastructure that serves status pages, most often because your main website is hosted on Vercel. In that case we need proof that the domain is yours before we can serve a page on it. The record is temporary and does not route any traffic. It only proves ownership. A few things to know: - It always goes on your apex domain (\_vercel.acme.com), even when your status page lives on a subdomain. - Its value is unique to your domain. Copy it from the panel rather than from another guide. - Once the panel flips to **Connected**, the record has done its job. Leaving it in place is harmless and saves a round trip if you ever re-add the domain. > **Add the TXT record, don't replace the ones you have** > > TXT records stack on the same name. Add this one alongside your SPF, DKIM, and other verification records instead of overwriting them. Replacing them is the single most common way this step goes wrong, and it breaks your email deliverability at the same time. ### SSL certificates (HTTPS) All status pages are served using HTTPS only, and HTTP requests are redirected to HTTPS. We issue and renew the certificate for you (Let's Encrypt), so there is nothing to upload, and renewal happens automatically 30 days before expiry. The certificate is only issued once your domain actually resolves to us, which means the order matters: DNS first, certificate second. Between the two, a browser hitting your domain can show a certificate warning or a "site not found" error. That is expected and clears on its own, usually within a minute of the DNS check passing. Two DNS settings can block the certificate from ever being issued: - **A Cloudflare proxied record** (orange cloud). Cloudflare answers for the hostname instead of us, so the validation never reaches our servers. Switch the record to **DNS only** (grey cloud). - **A restrictive CAA record** on your domain. If you use CAA records, they must allow _letsencrypt.org_ to issue certificates, otherwise the request is refused. > **Want the page fully on your brand?** > > A custom domain is the first step of white labeling. See the [white labeling guide](https://hyperping.com/docs/status-page/white-labeling) for hiding the "Powered by" footer and sending subscriber emails from your own domain. ## Hyperping-hosted domain Each status page can have a custom Hyperping-hosted domain (yourdomain.hyperping.app) that is instantly available. This is perfect for testing your status page or in case obtaining a custom domain requires more time. Head to your status page settings, edit the field under the "Hyperping-hosted slug" section, then hit "Publish". All Hyperping-hosted status pages are served using HTTPS only. ## Troubleshooting **My custom domain is not live yet** DNS propagation can take up to 24 hours after you create the record, though it is usually a matter of minutes. In the meantime, your Hyperping-hosted domain (yourdomain.hyperping.app) is instantly available, so you already have a working URL to share. **My domain is on Cloudflare and nothing works** Open the record in Cloudflare and set it to **DNS only** (grey cloud). While the orange cloud is on, Cloudflare answers for your hostname with its own IP addresses, so our DNS check fails and the SSL certificate cannot be issued. The panel flags this for you when it detects Cloudflare's edge. **The panel says my domain points somewhere else** Something already answers for that hostname: a previous status page provider, a parking page, or a typo in the target. Adding a second record does not help, and if the existing record is the wrong type (an A record where we need a CNAME), your provider will reject the new one. Edit the existing record instead of creating another. **I added the TXT record and it still says pending** Check that you added it rather than replaced your existing TXT records, that the name is **\_vercel** on your apex domain, and that the value matches the panel exactly (no quotes, no trailing spaces). Then hit **Check DNS**. If your provider shows the record but we still do not see it, give it a few minutes: some registrars only publish TXT changes on their own refresh cycle. ## Next steps [ White labeling→ Hide the "Powered by" footer and send emails from your domain. ](https://hyperping.com/docs/status-page/white-labeling)[ Private status pages→ Password, SSO, and email access codes for internal pages. ](https://hyperping.com/docs/status-page/private-status-pages)[ Go-live checklist→ Everything to verify before you announce your status page. ](https://hyperping.com/docs/status-page/go-live-checklist)[ Create a status page→ Every setting of the status page builder, explained. ](https://hyperping.com/docs/status-page/create-status-page) [← Sections](https://hyperping.com/docs/status-page/sections)[Subscribers →](https://hyperping.com/docs/status-page/subscribers) [](https://x.com/hyperping)[](https://www.linkedin.com/company/hyperping) © 2026 Hyperping --- Source: https://hyperping.com/docs/status-page/footer-badge # Footer badge Display a badge showing the real-time status of your status page services. You can create one by using our badge builder here: [https://hyperping.com/badge-builder](https://hyperping.com/badge-builder). ![Badge builder interface](https://hyperping.com/static/badge-builder-c4f75eddecedc21323c11ea0c7ad5d44.webp) The badge builder generates a code snippet from your settings ## Fine tune your settings Choose to display the uptime, change the wording and link your status page. A code snippet will automatically be updated as you edit your settings. ## Link it to your status page In order for it to automatically update your badge's status and uptime, you will need to plug in your status page's URL. If you haven't created a status page yet, you can follow [this guide](https://hyperping.com/docs/status-page/create-status-page). The badge uses the [endpoint of your status page](https://hyperping.com/docs/status-page/status-page-json) to retrieve real-time data about your uptime and status indicator. ## How to integrate it 1. Add the badge element Add an element that contains a "hyperping-badge" id, for example in your footer, next to other links. ```html
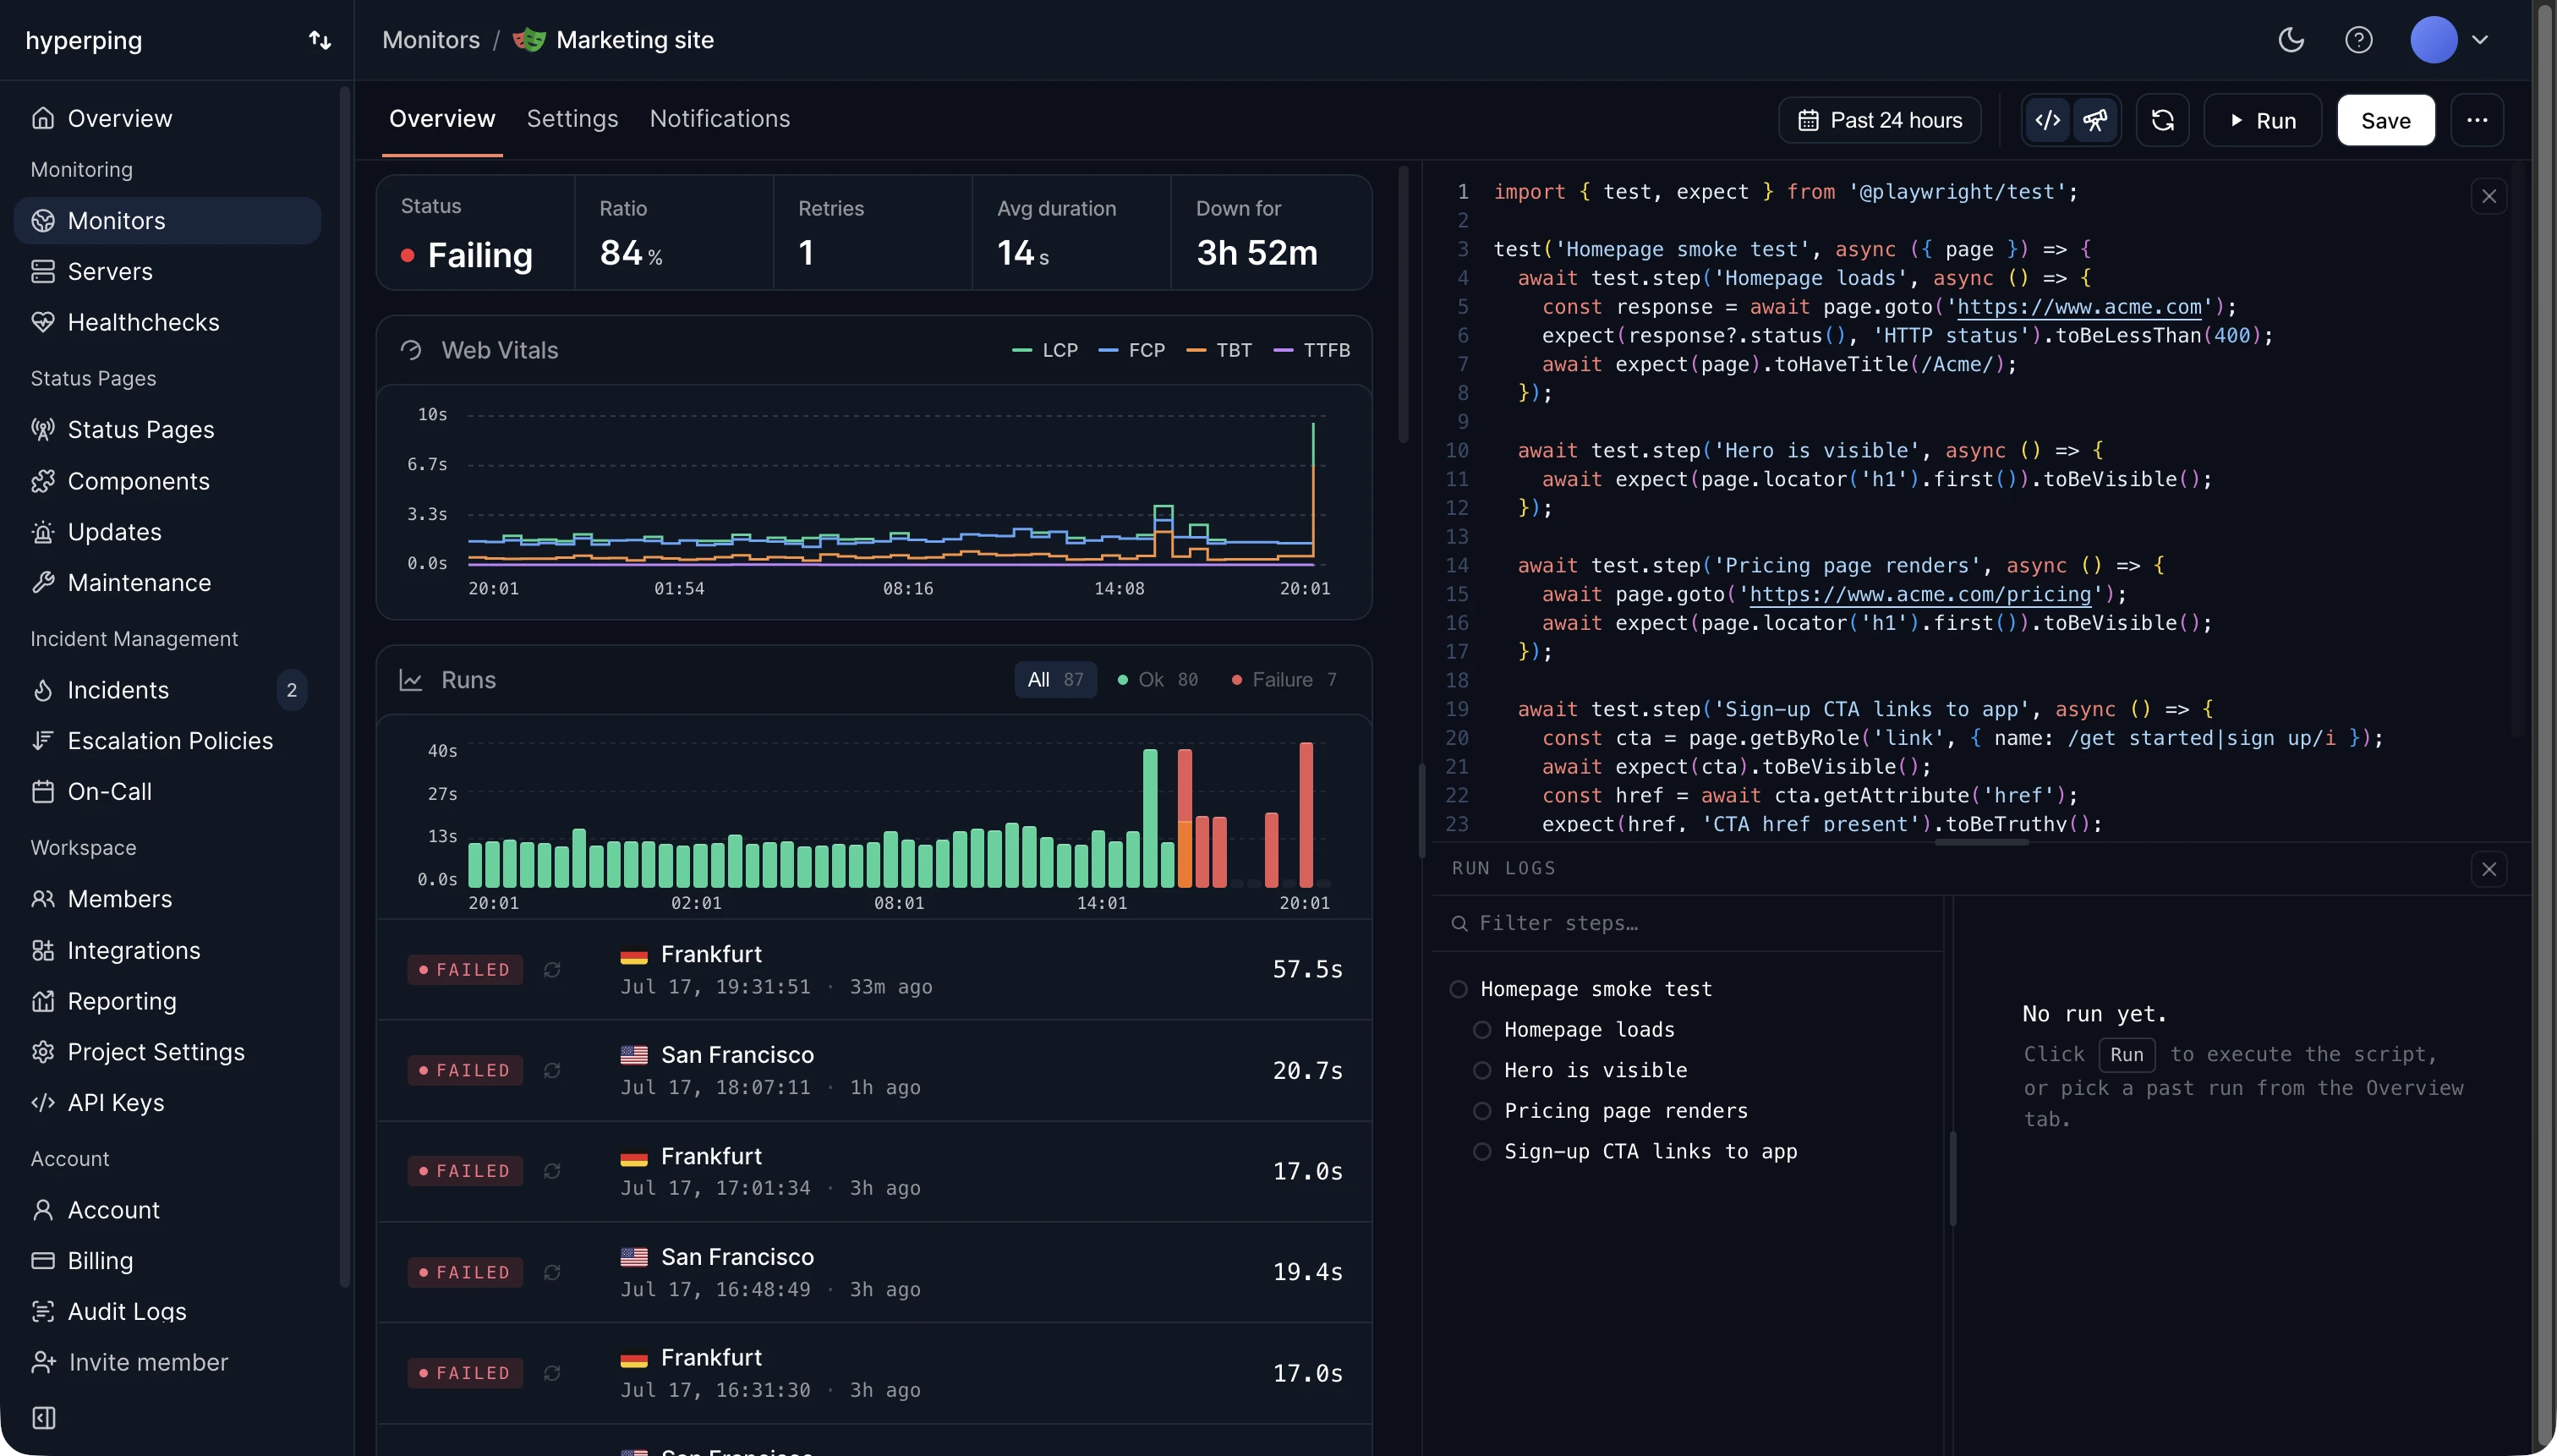
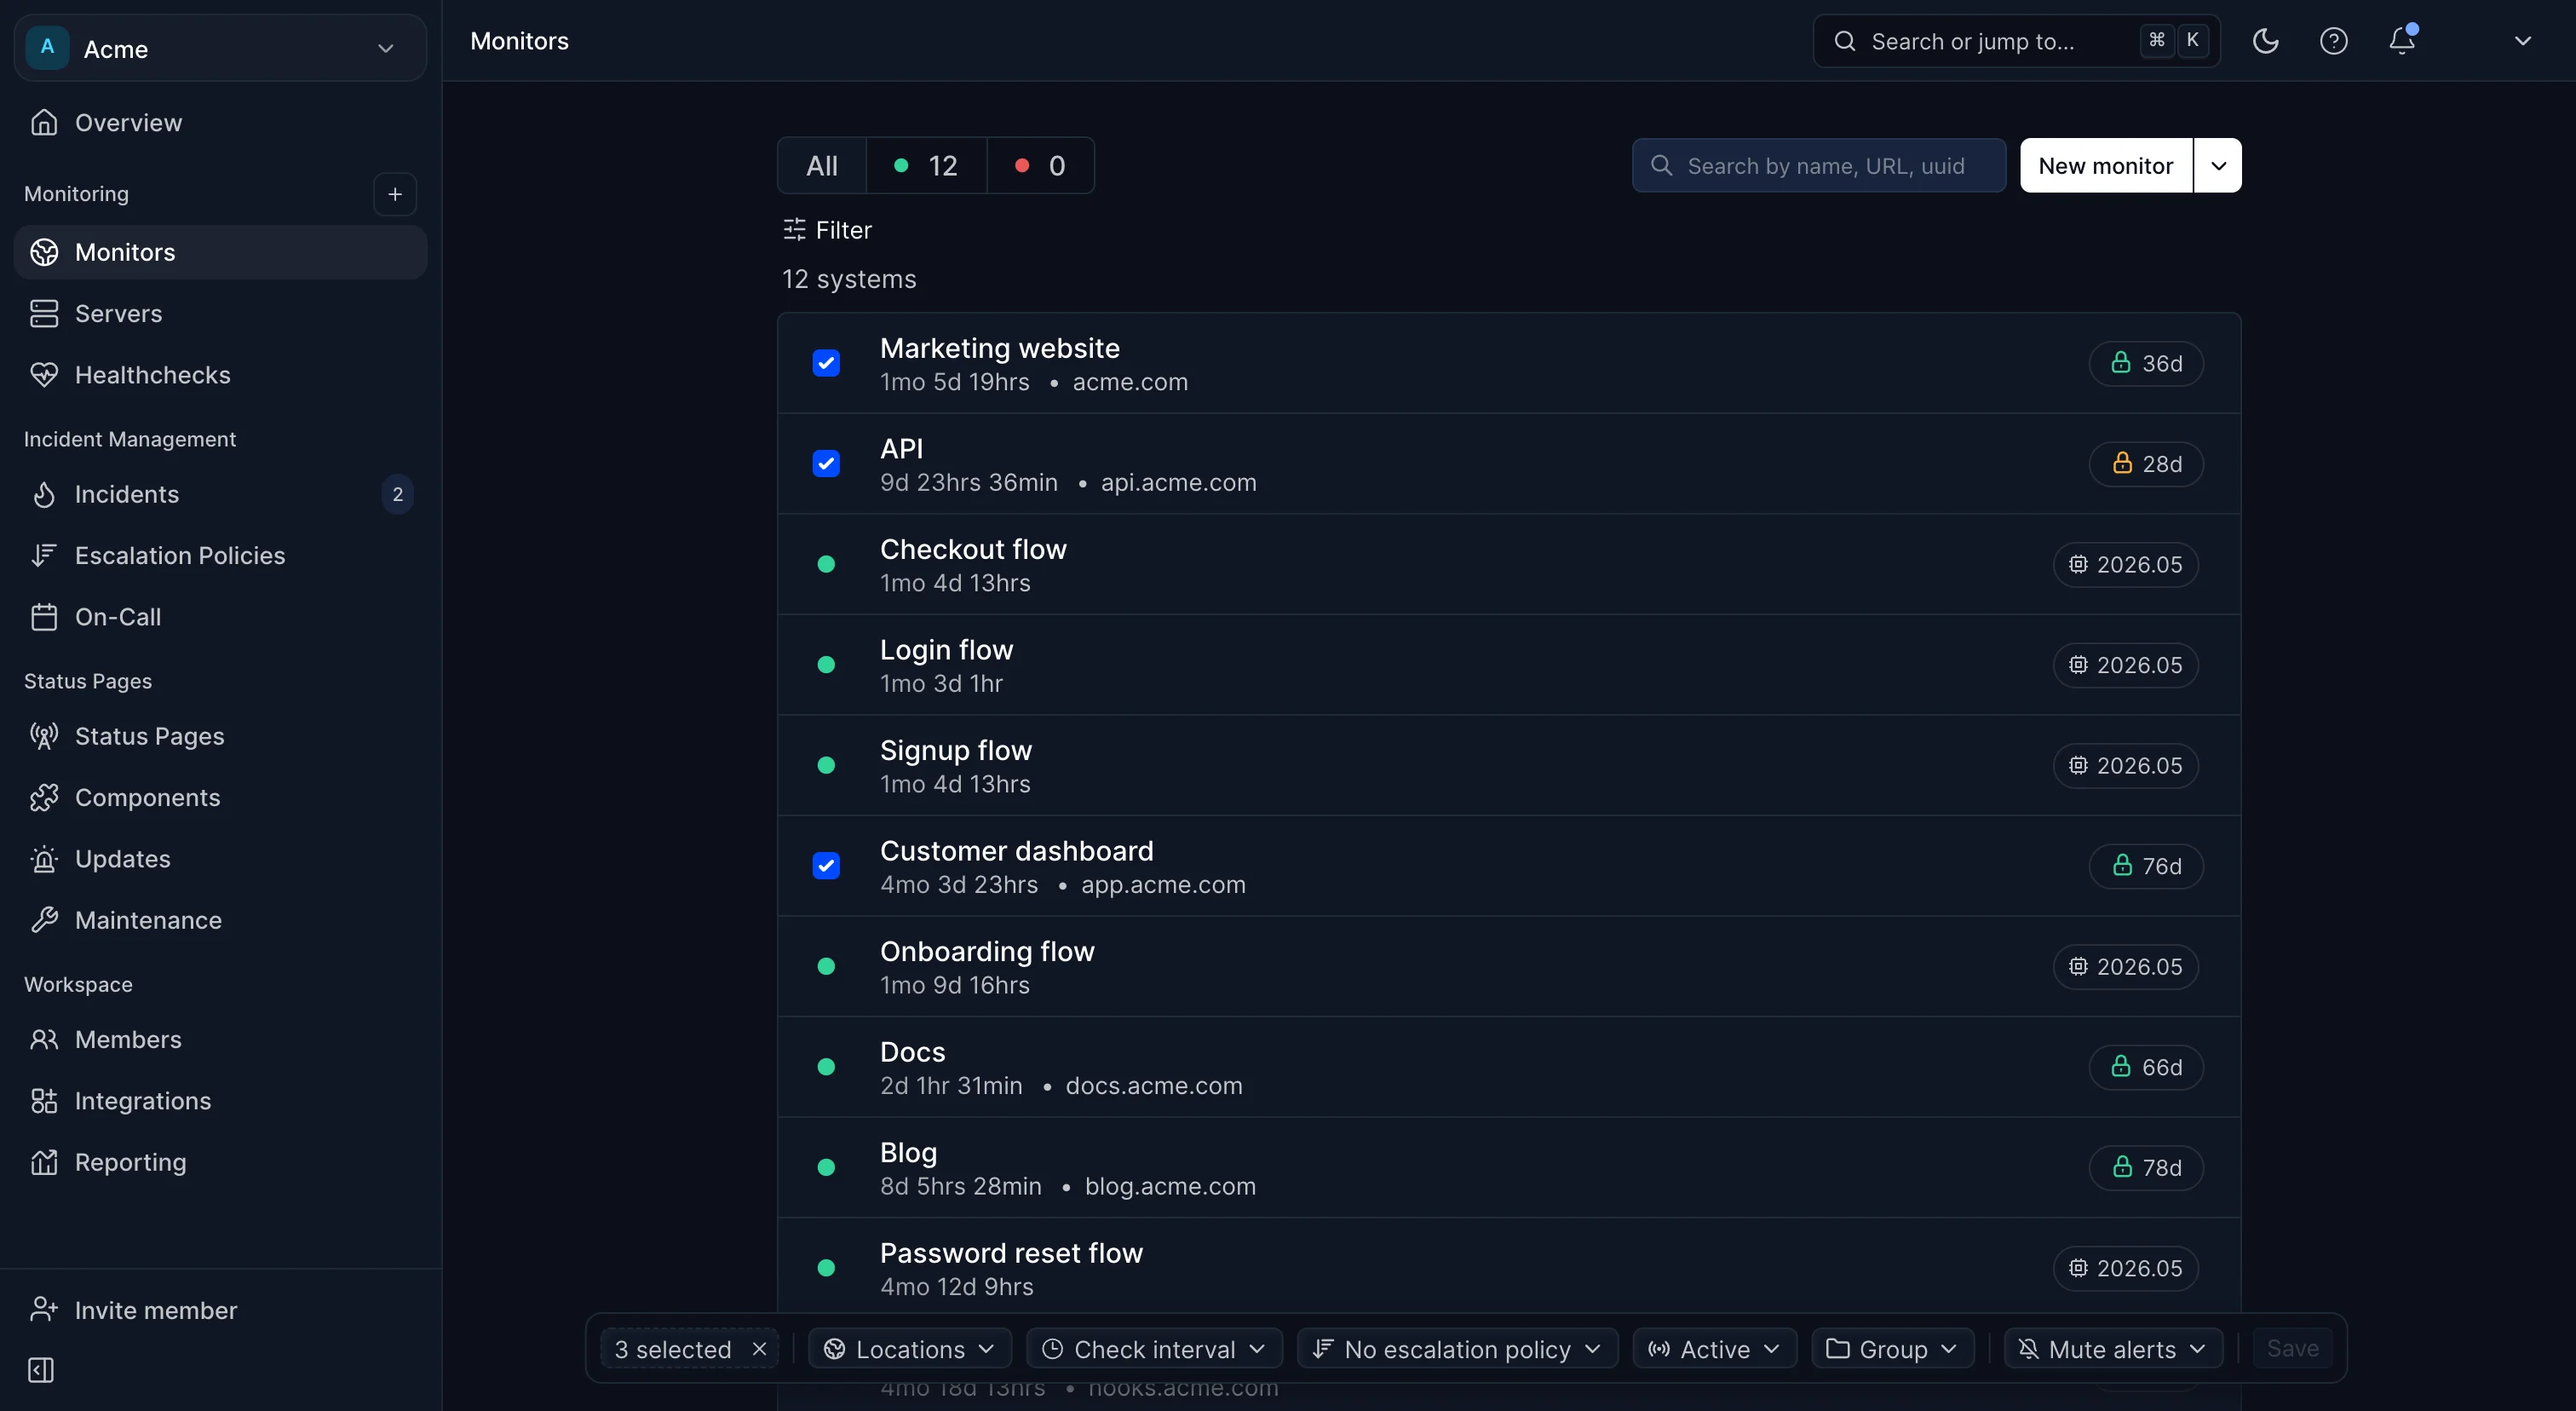
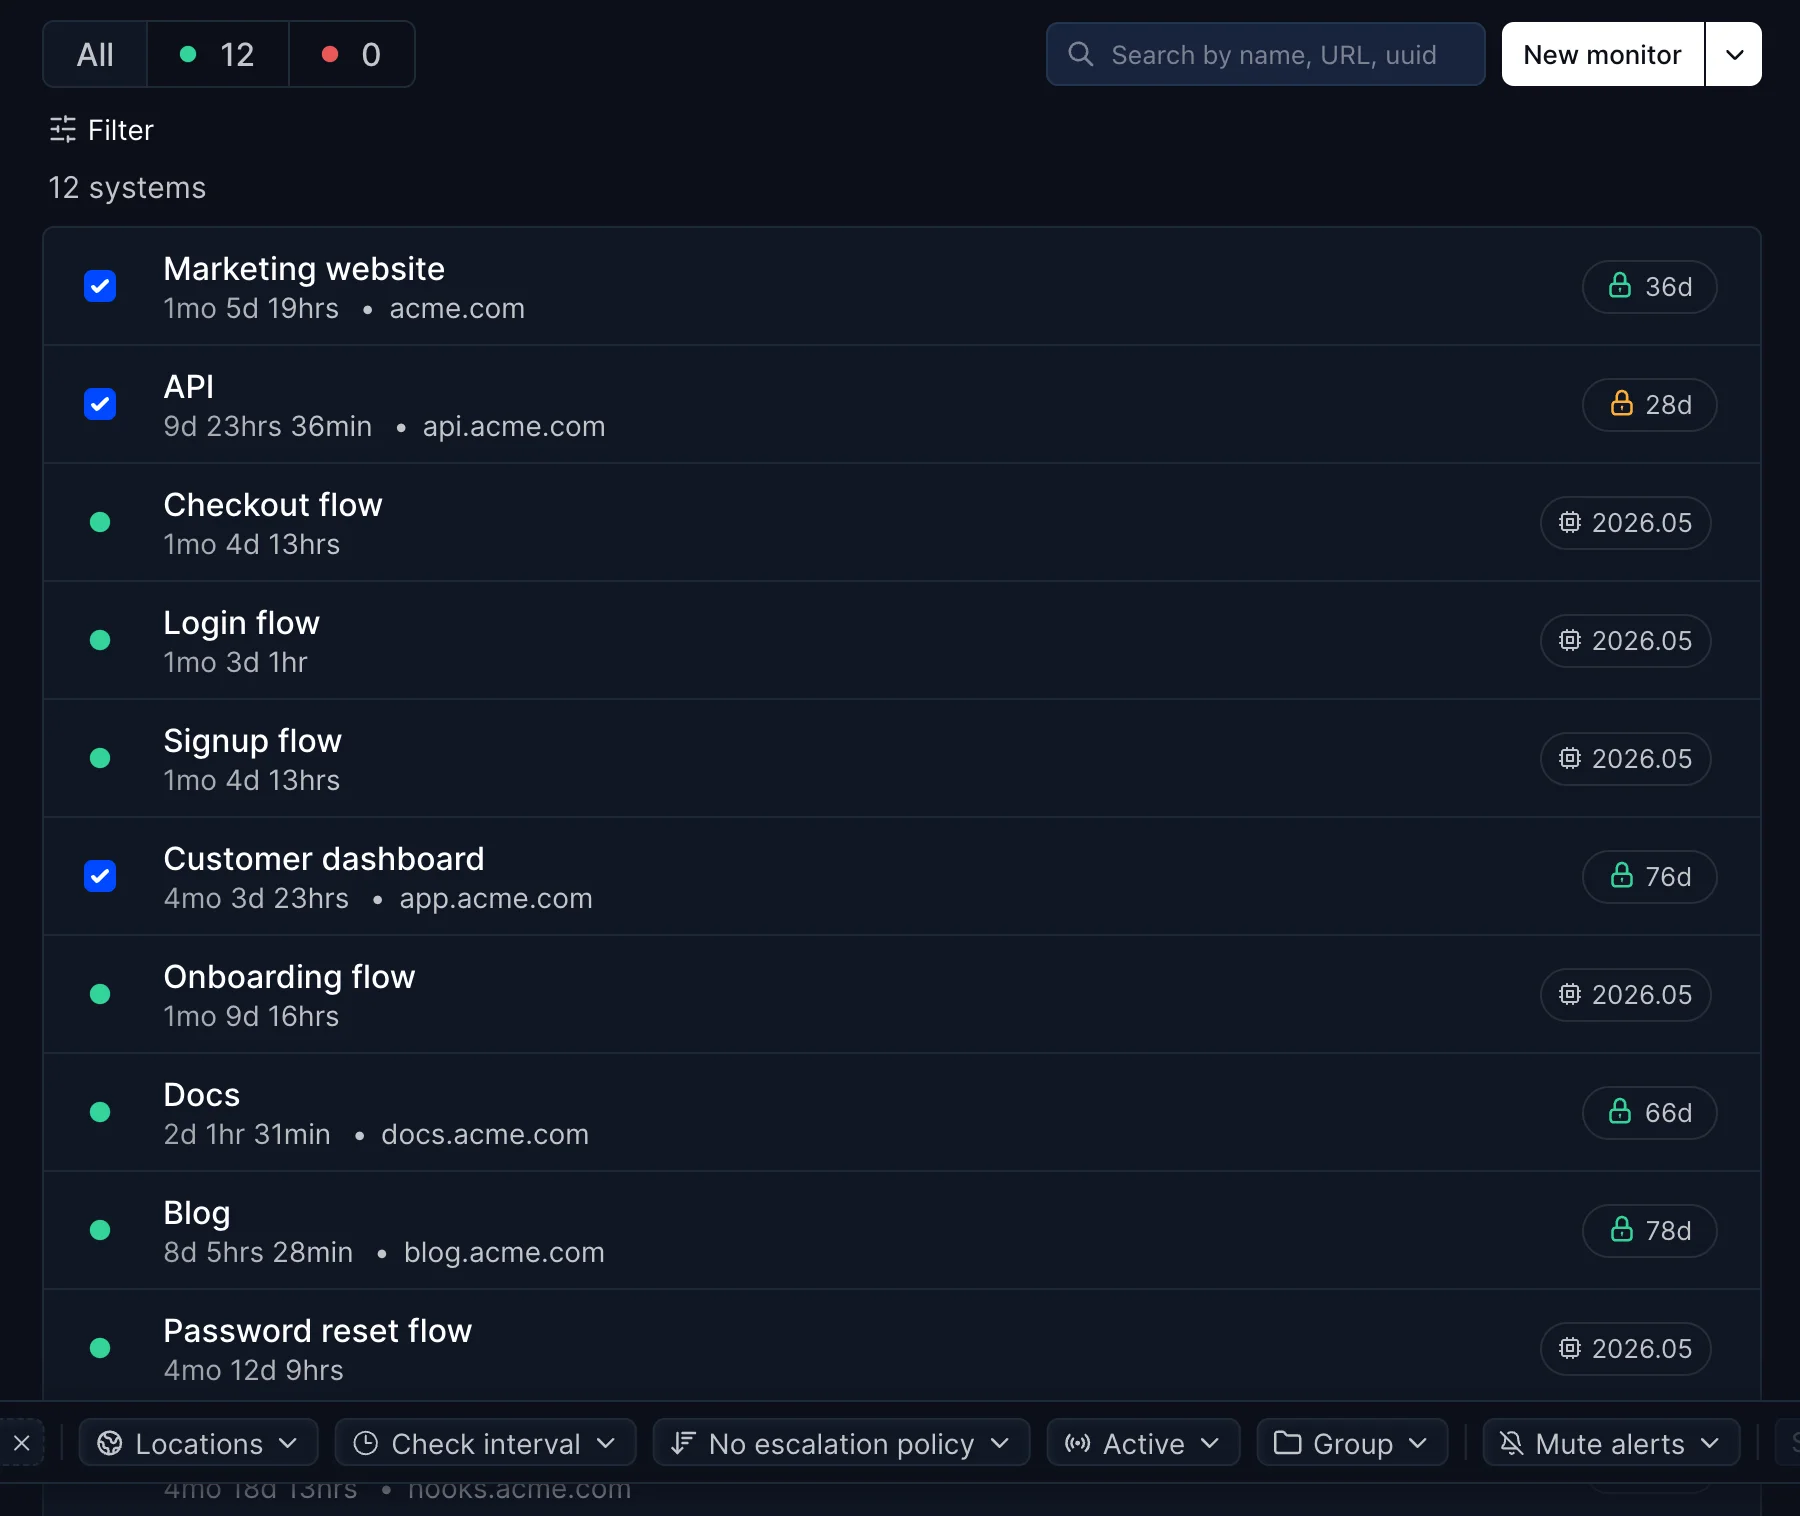
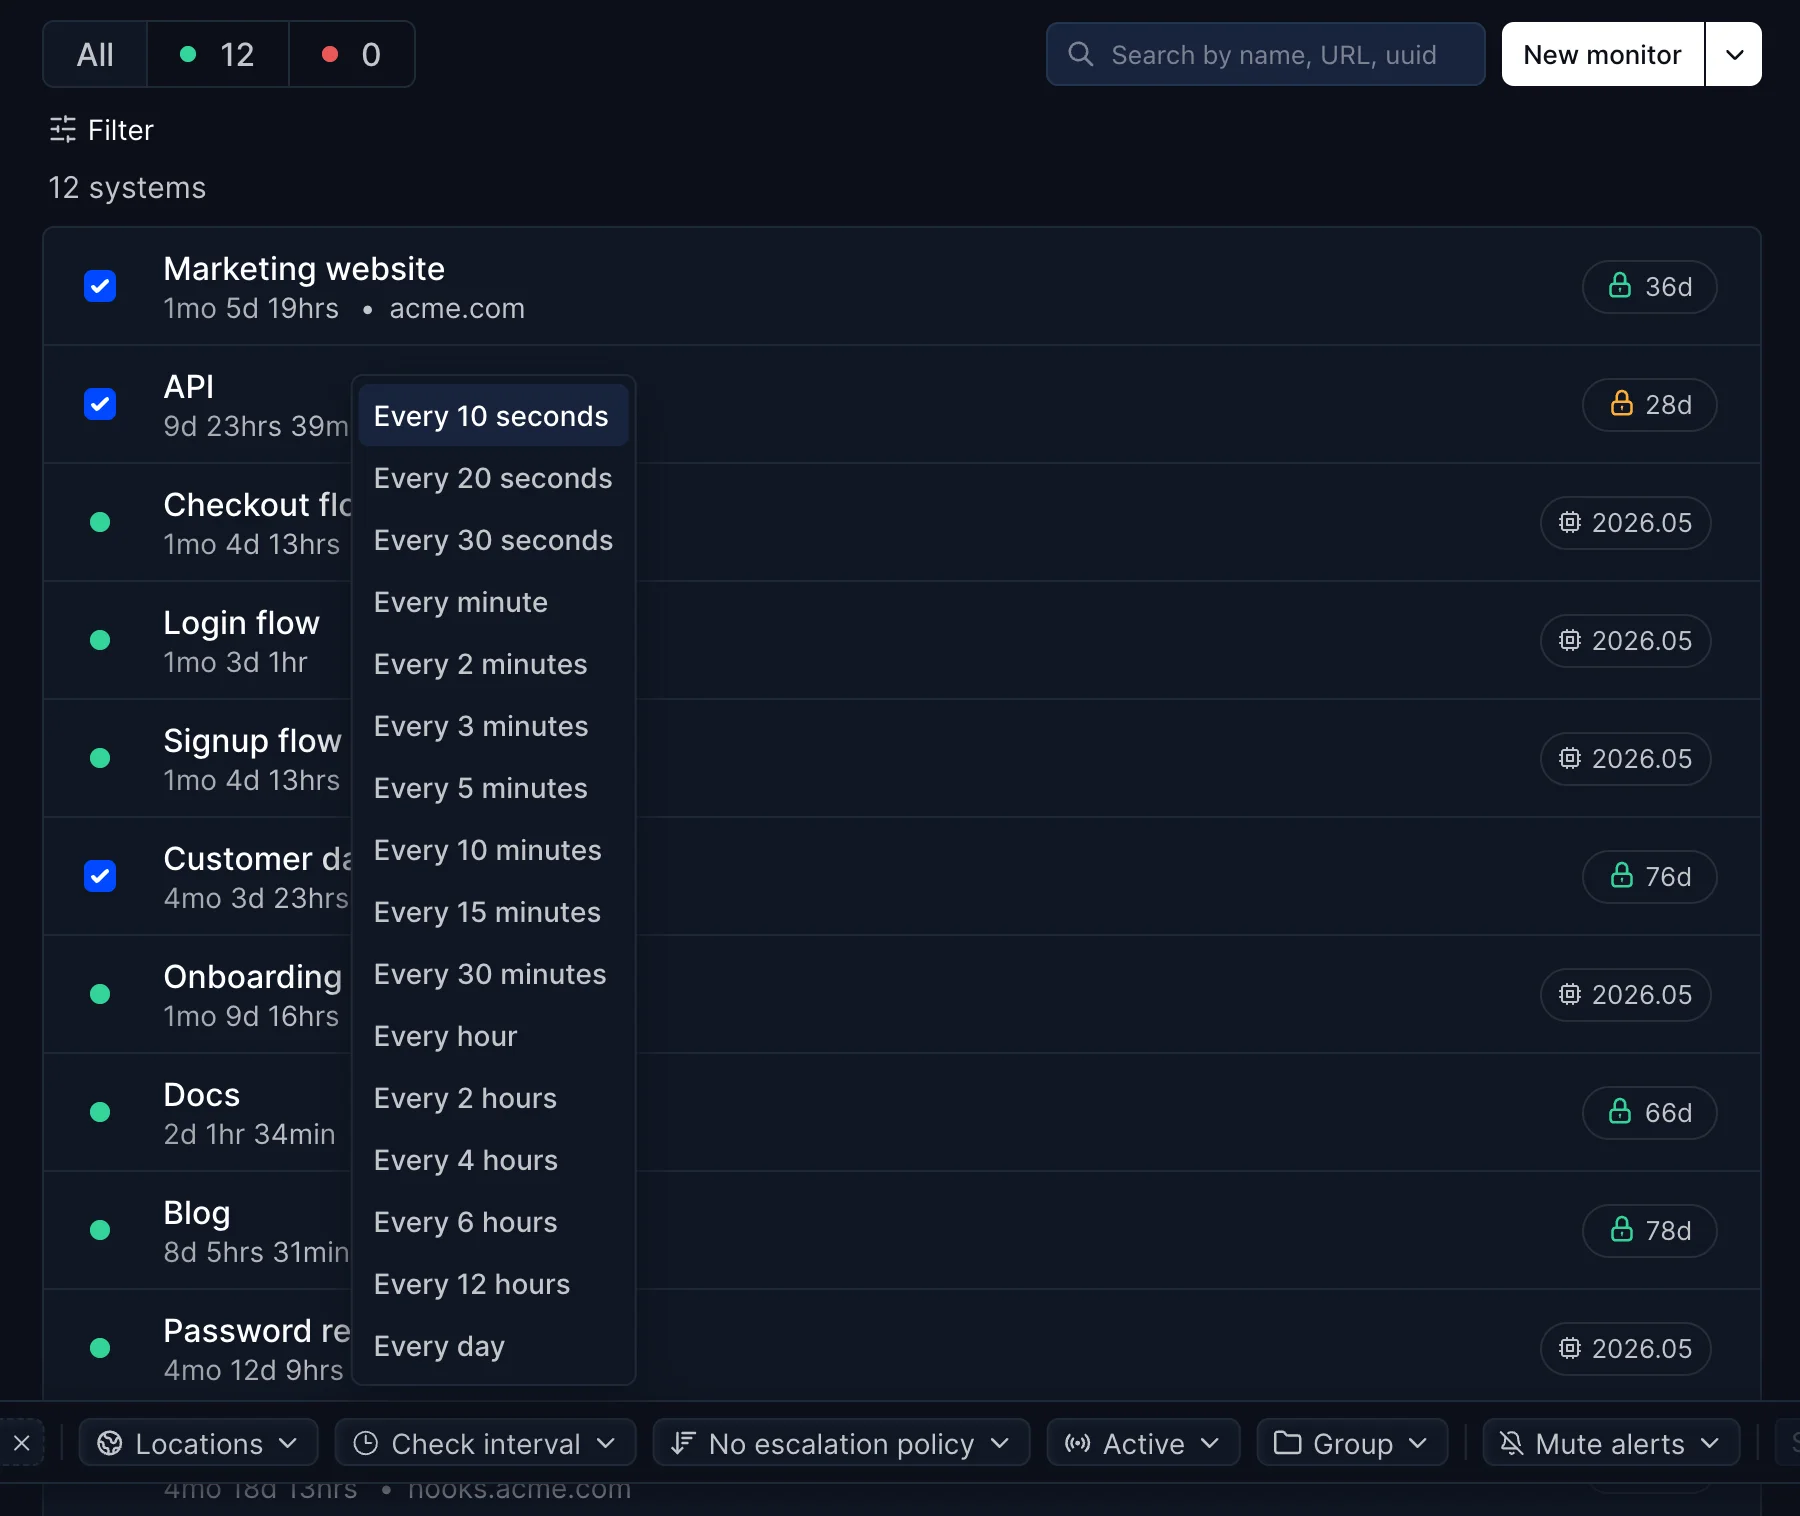
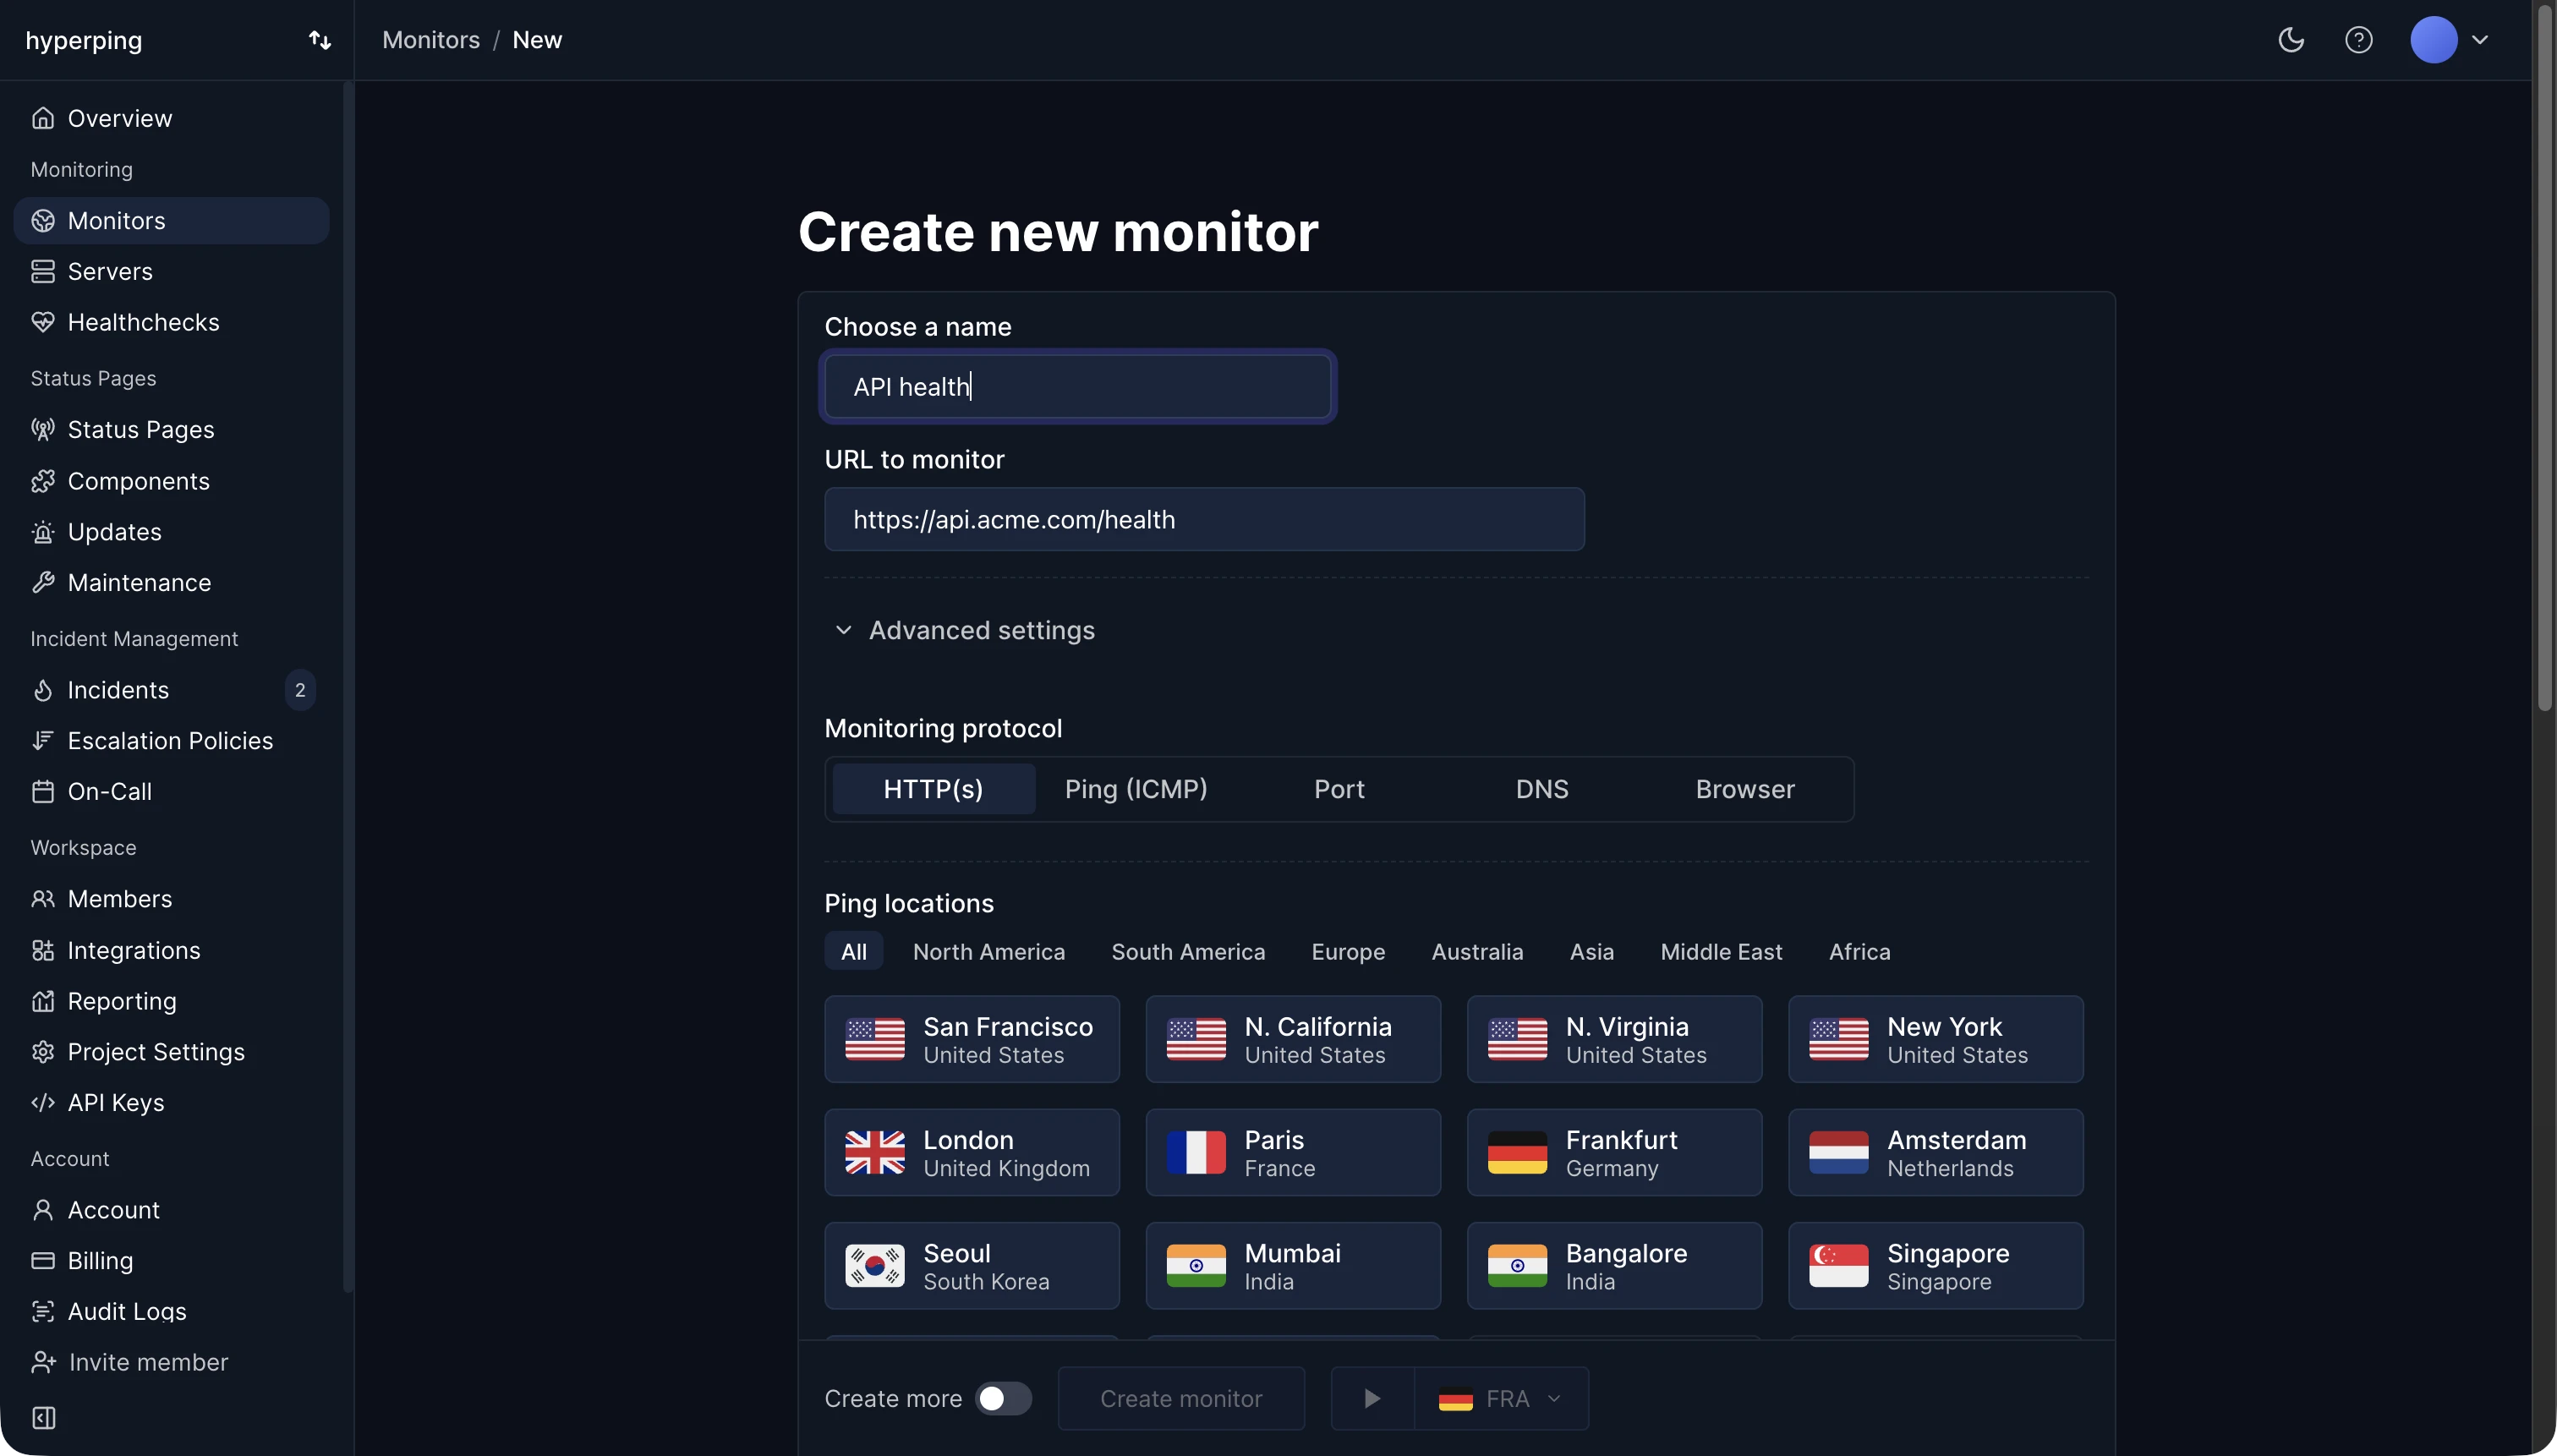
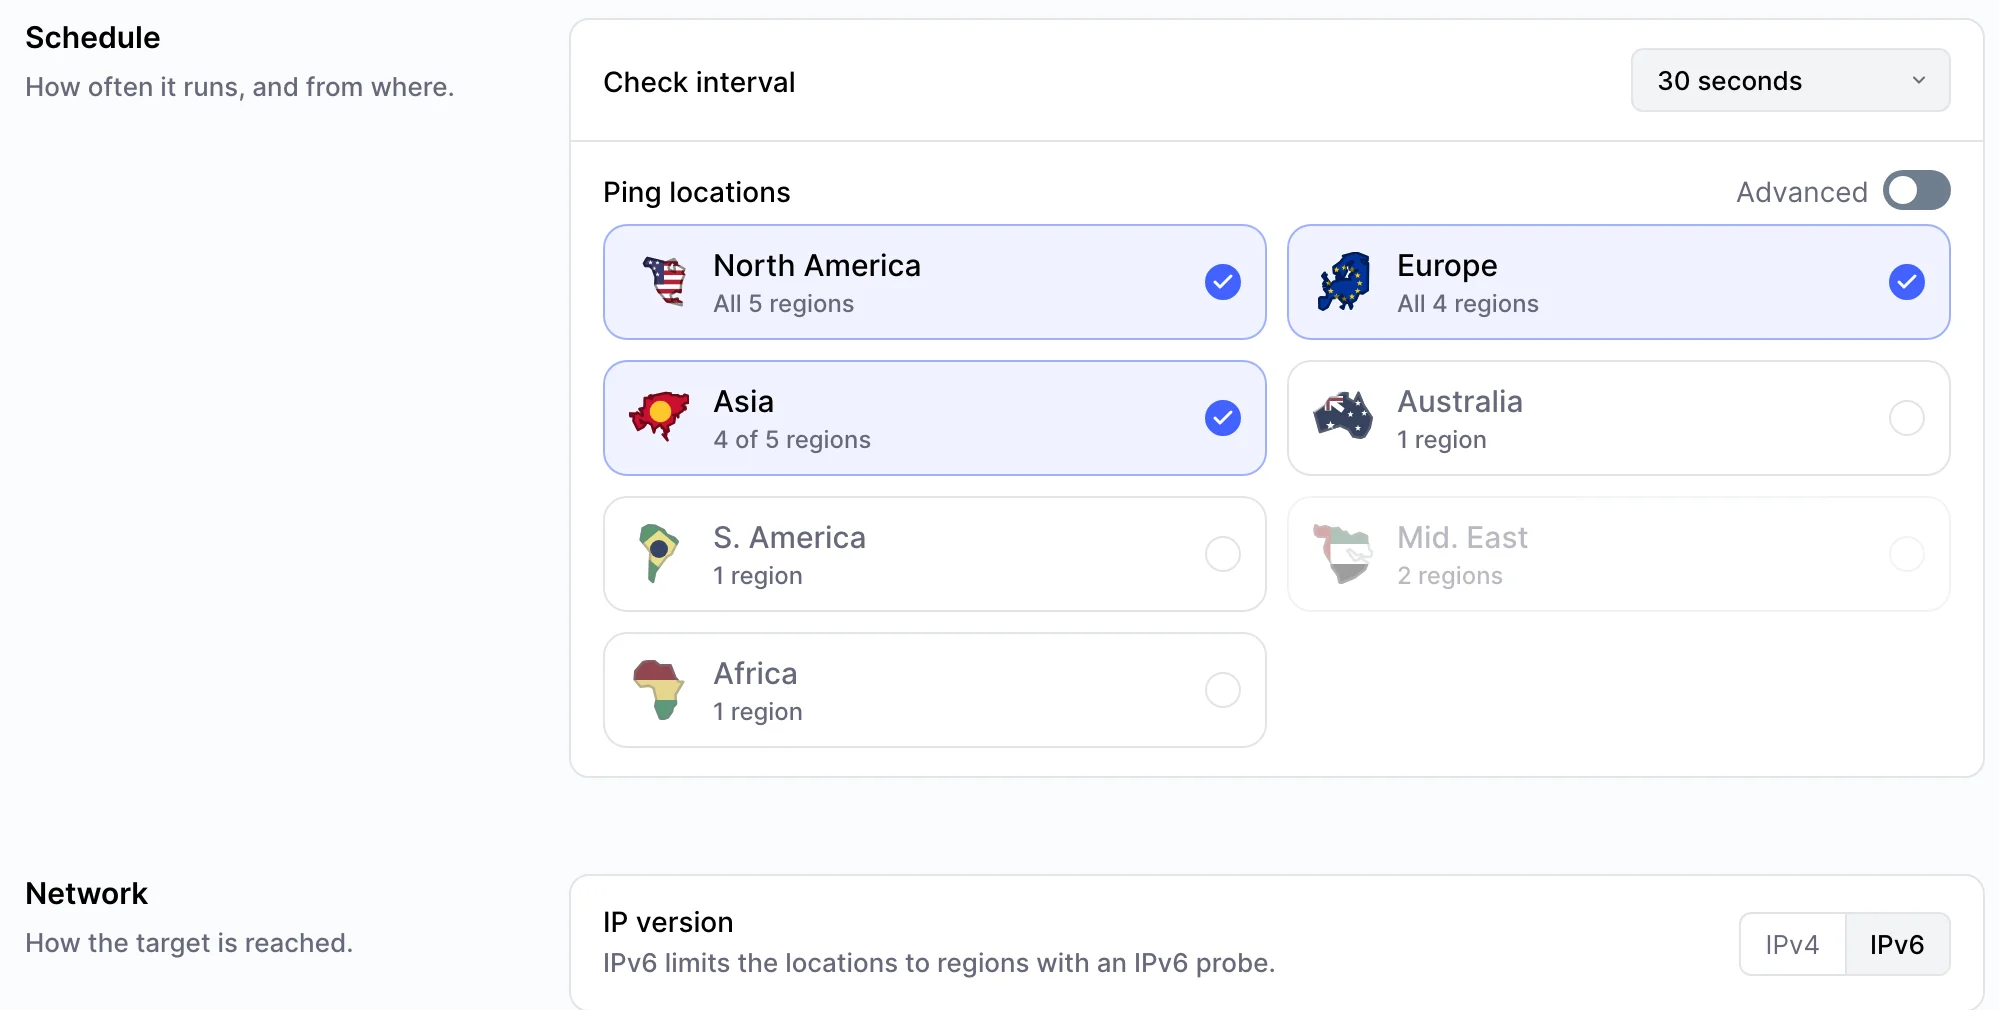
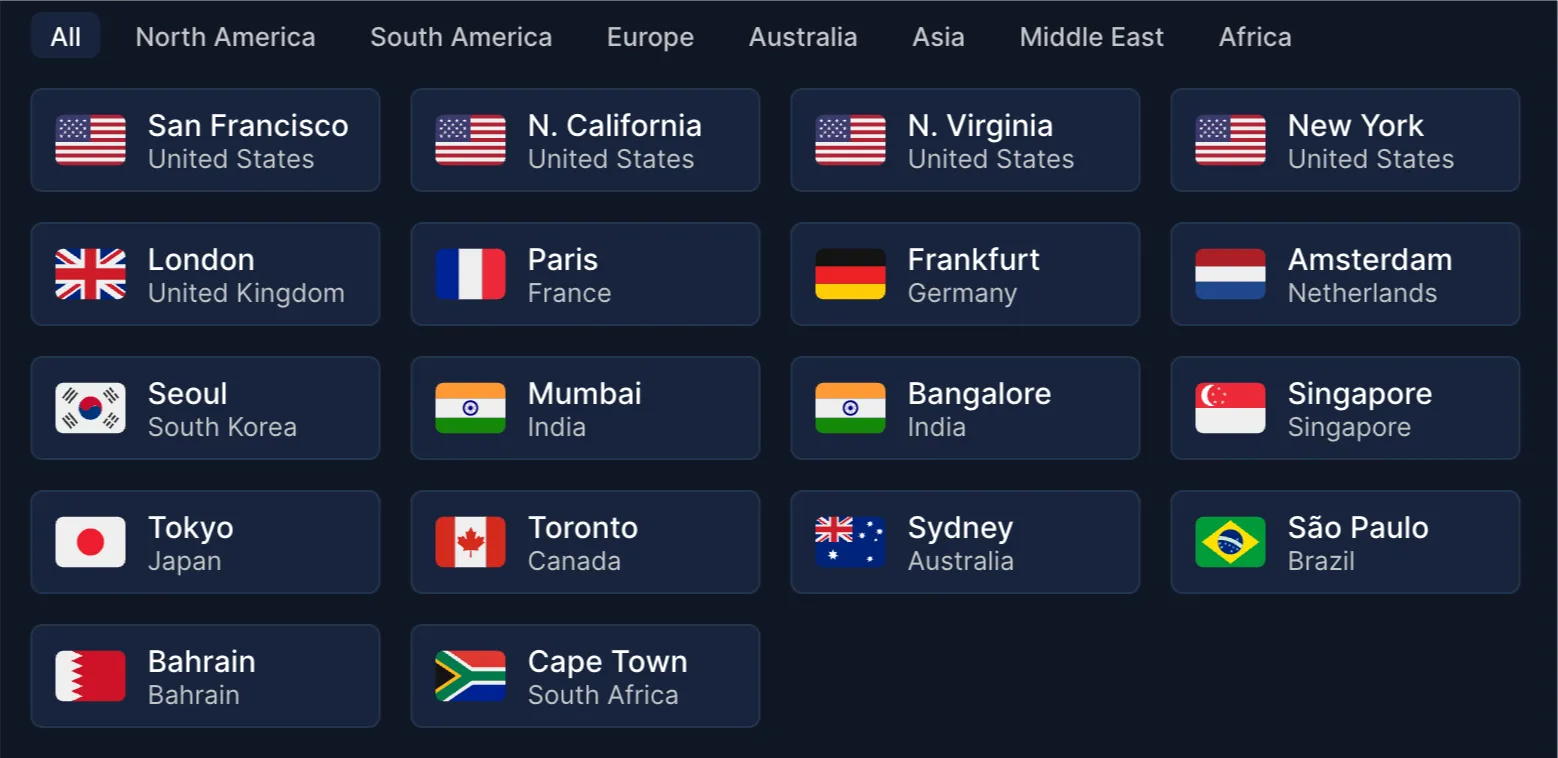
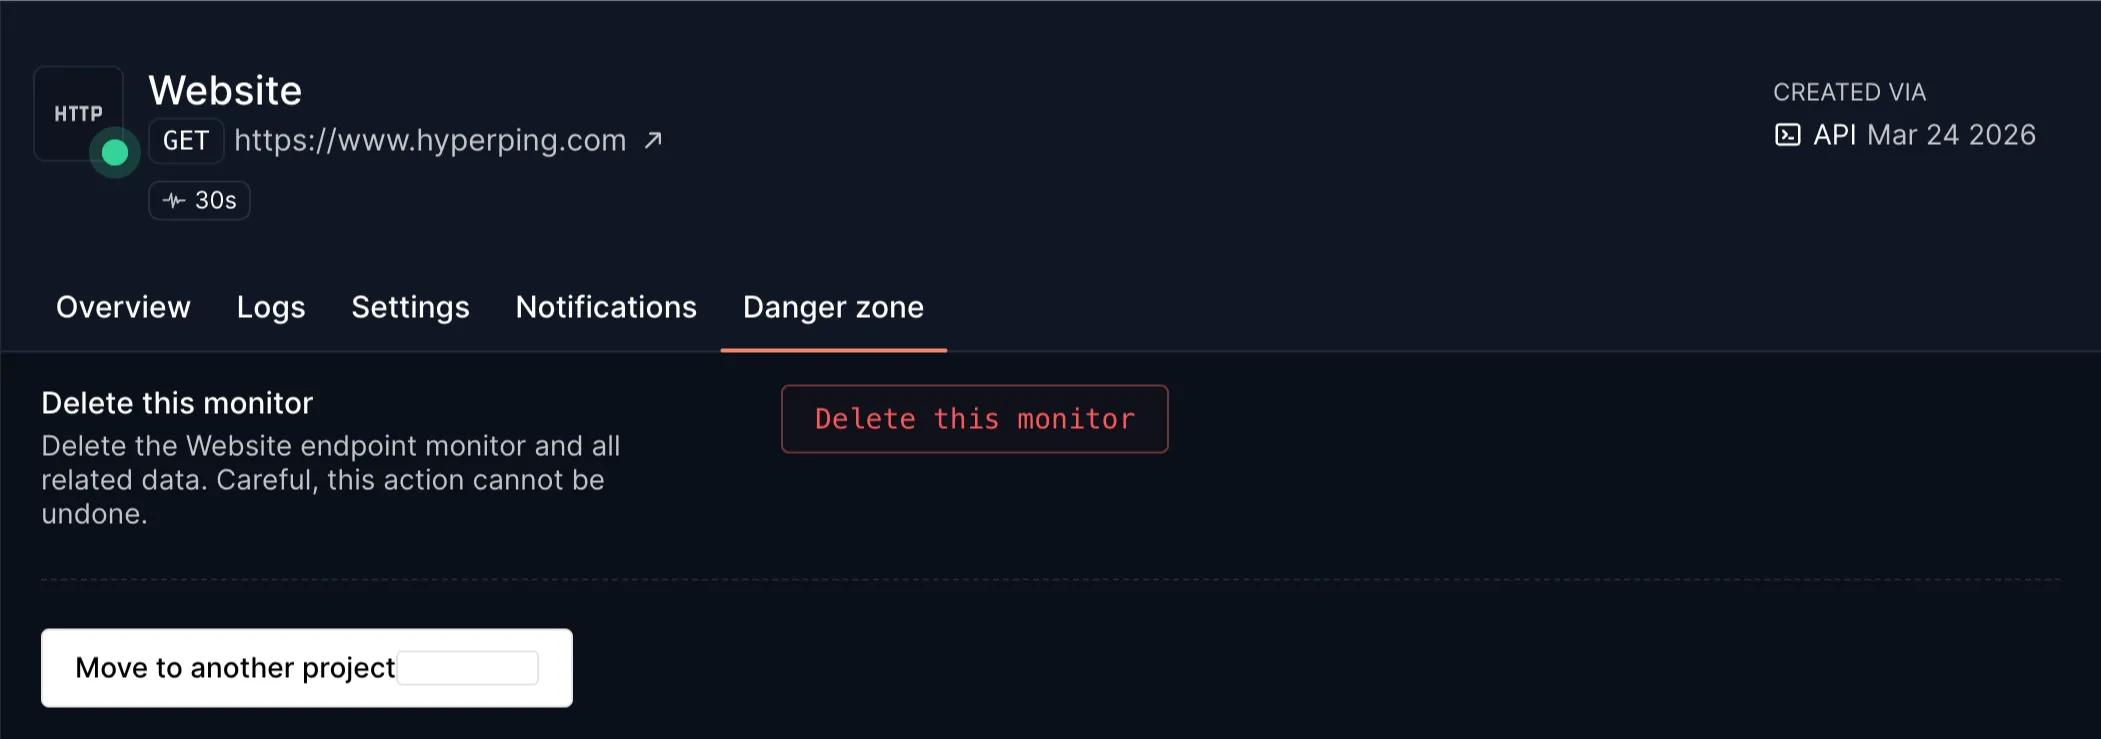
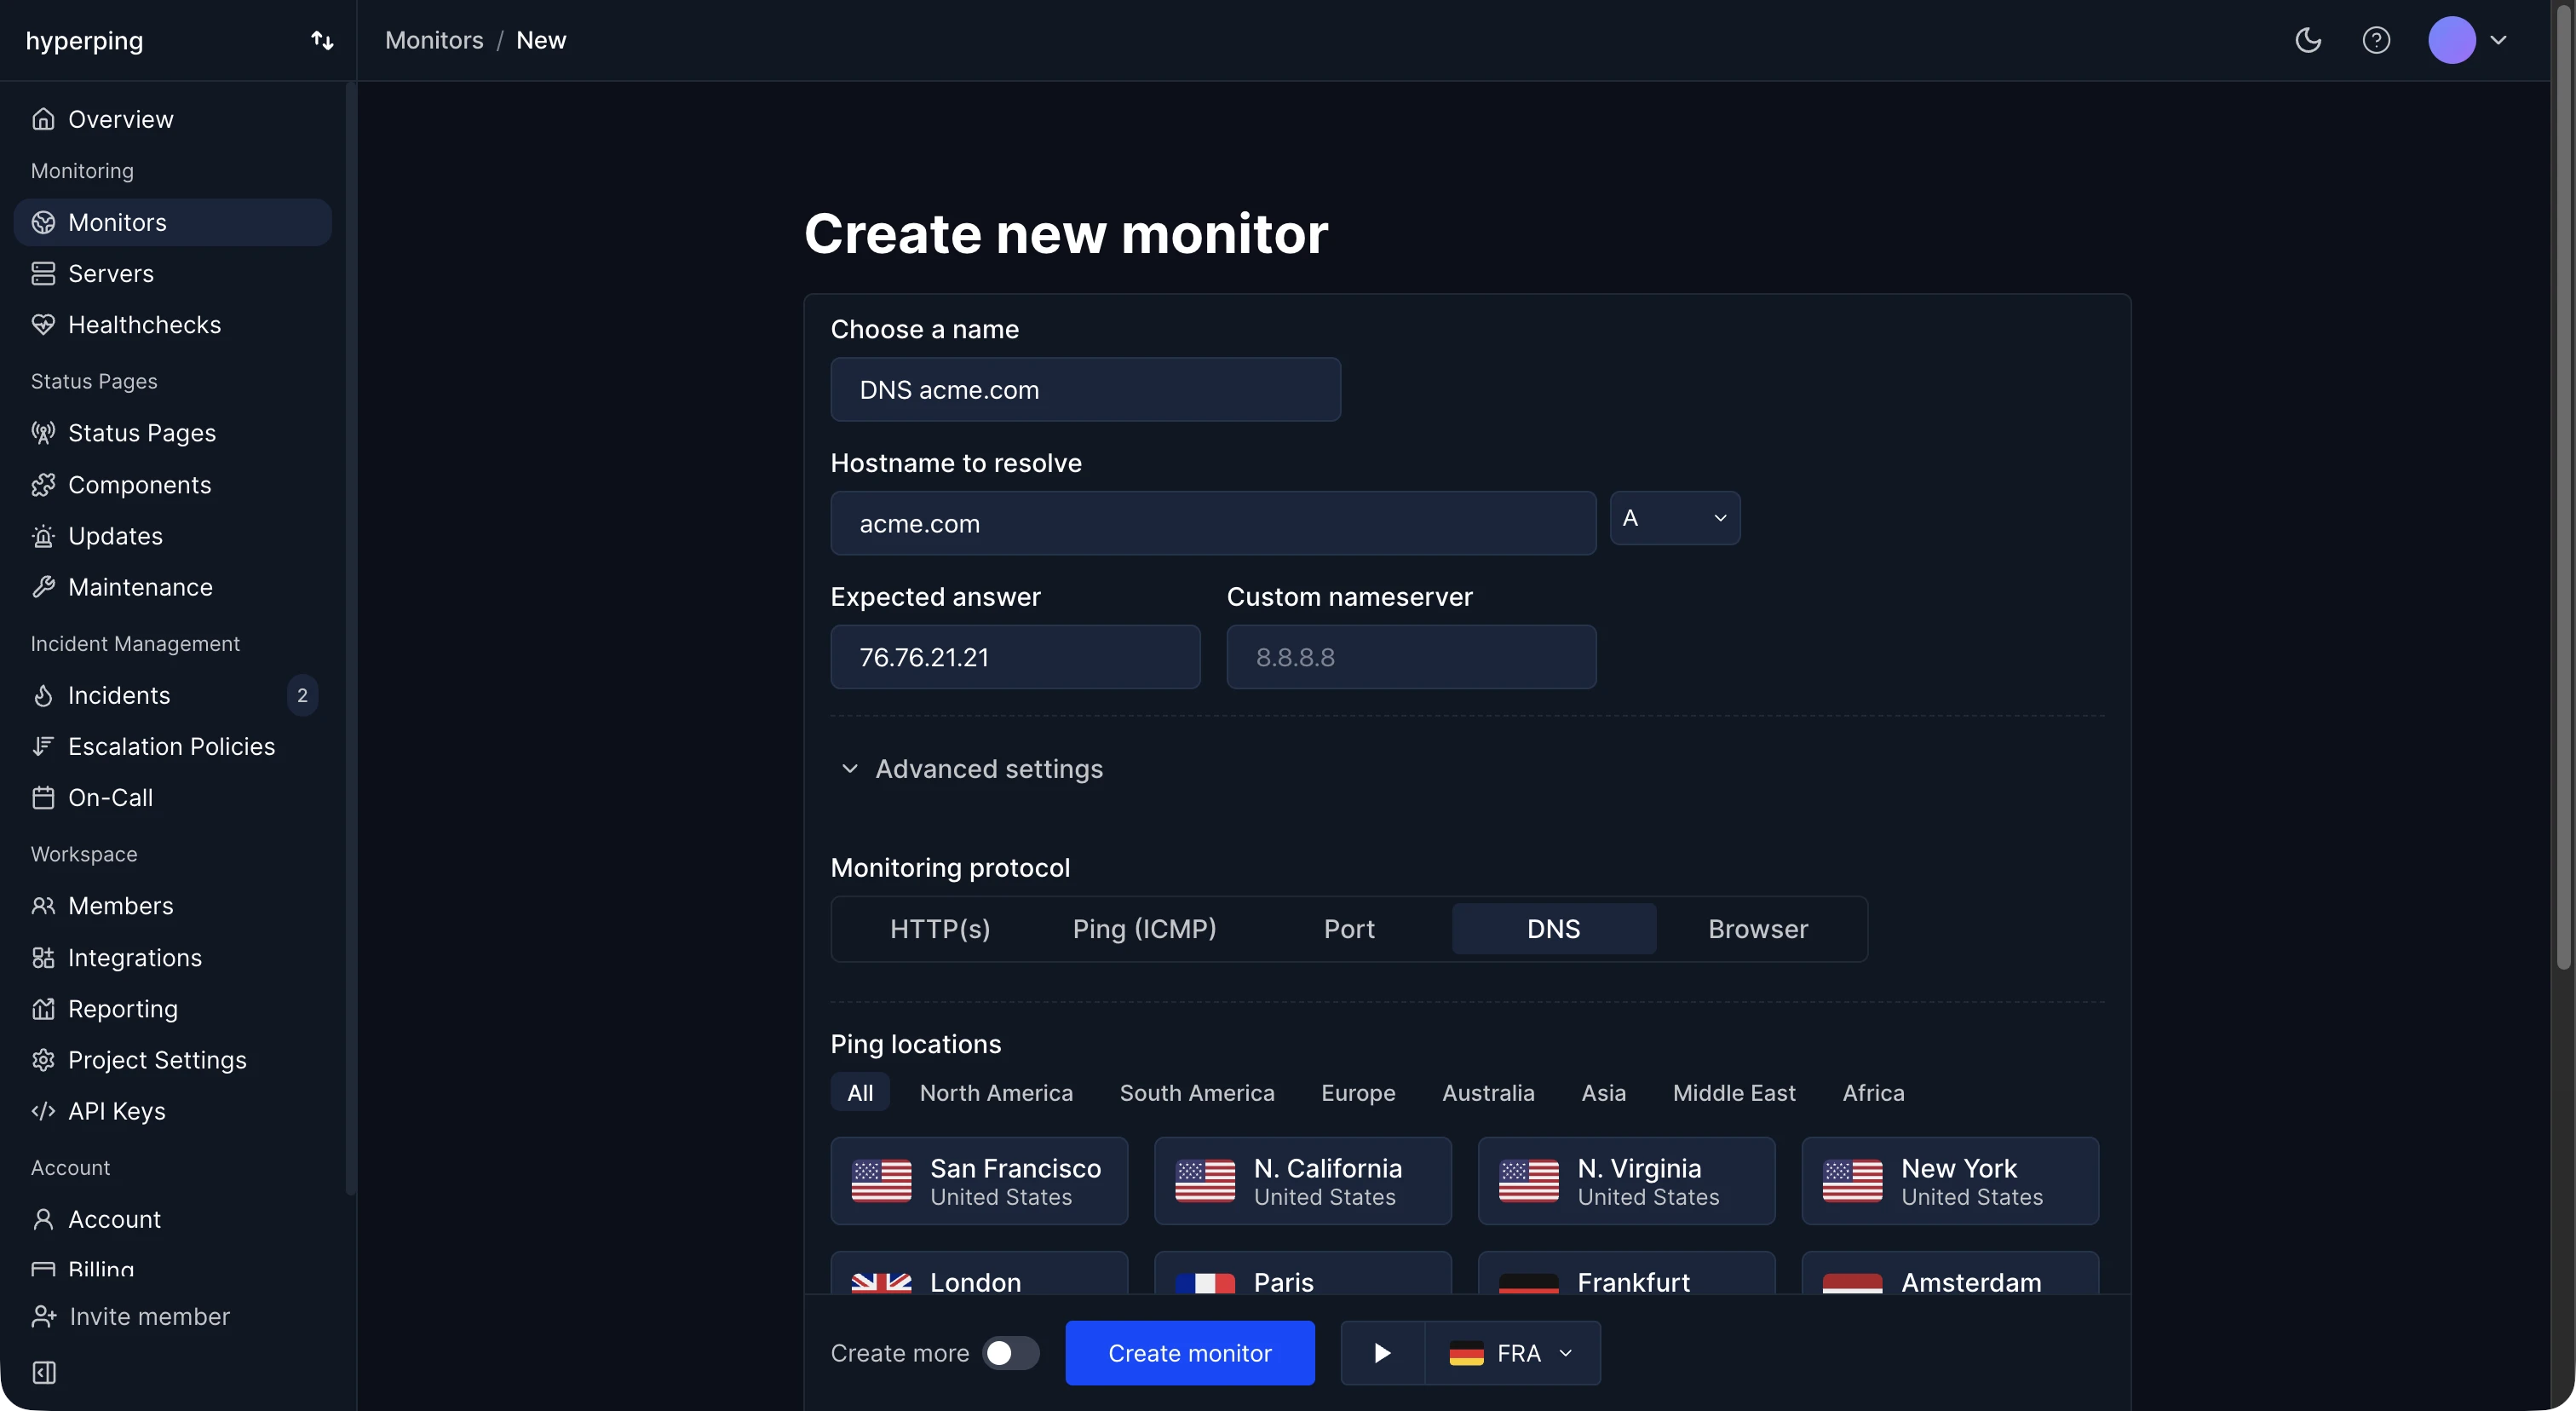
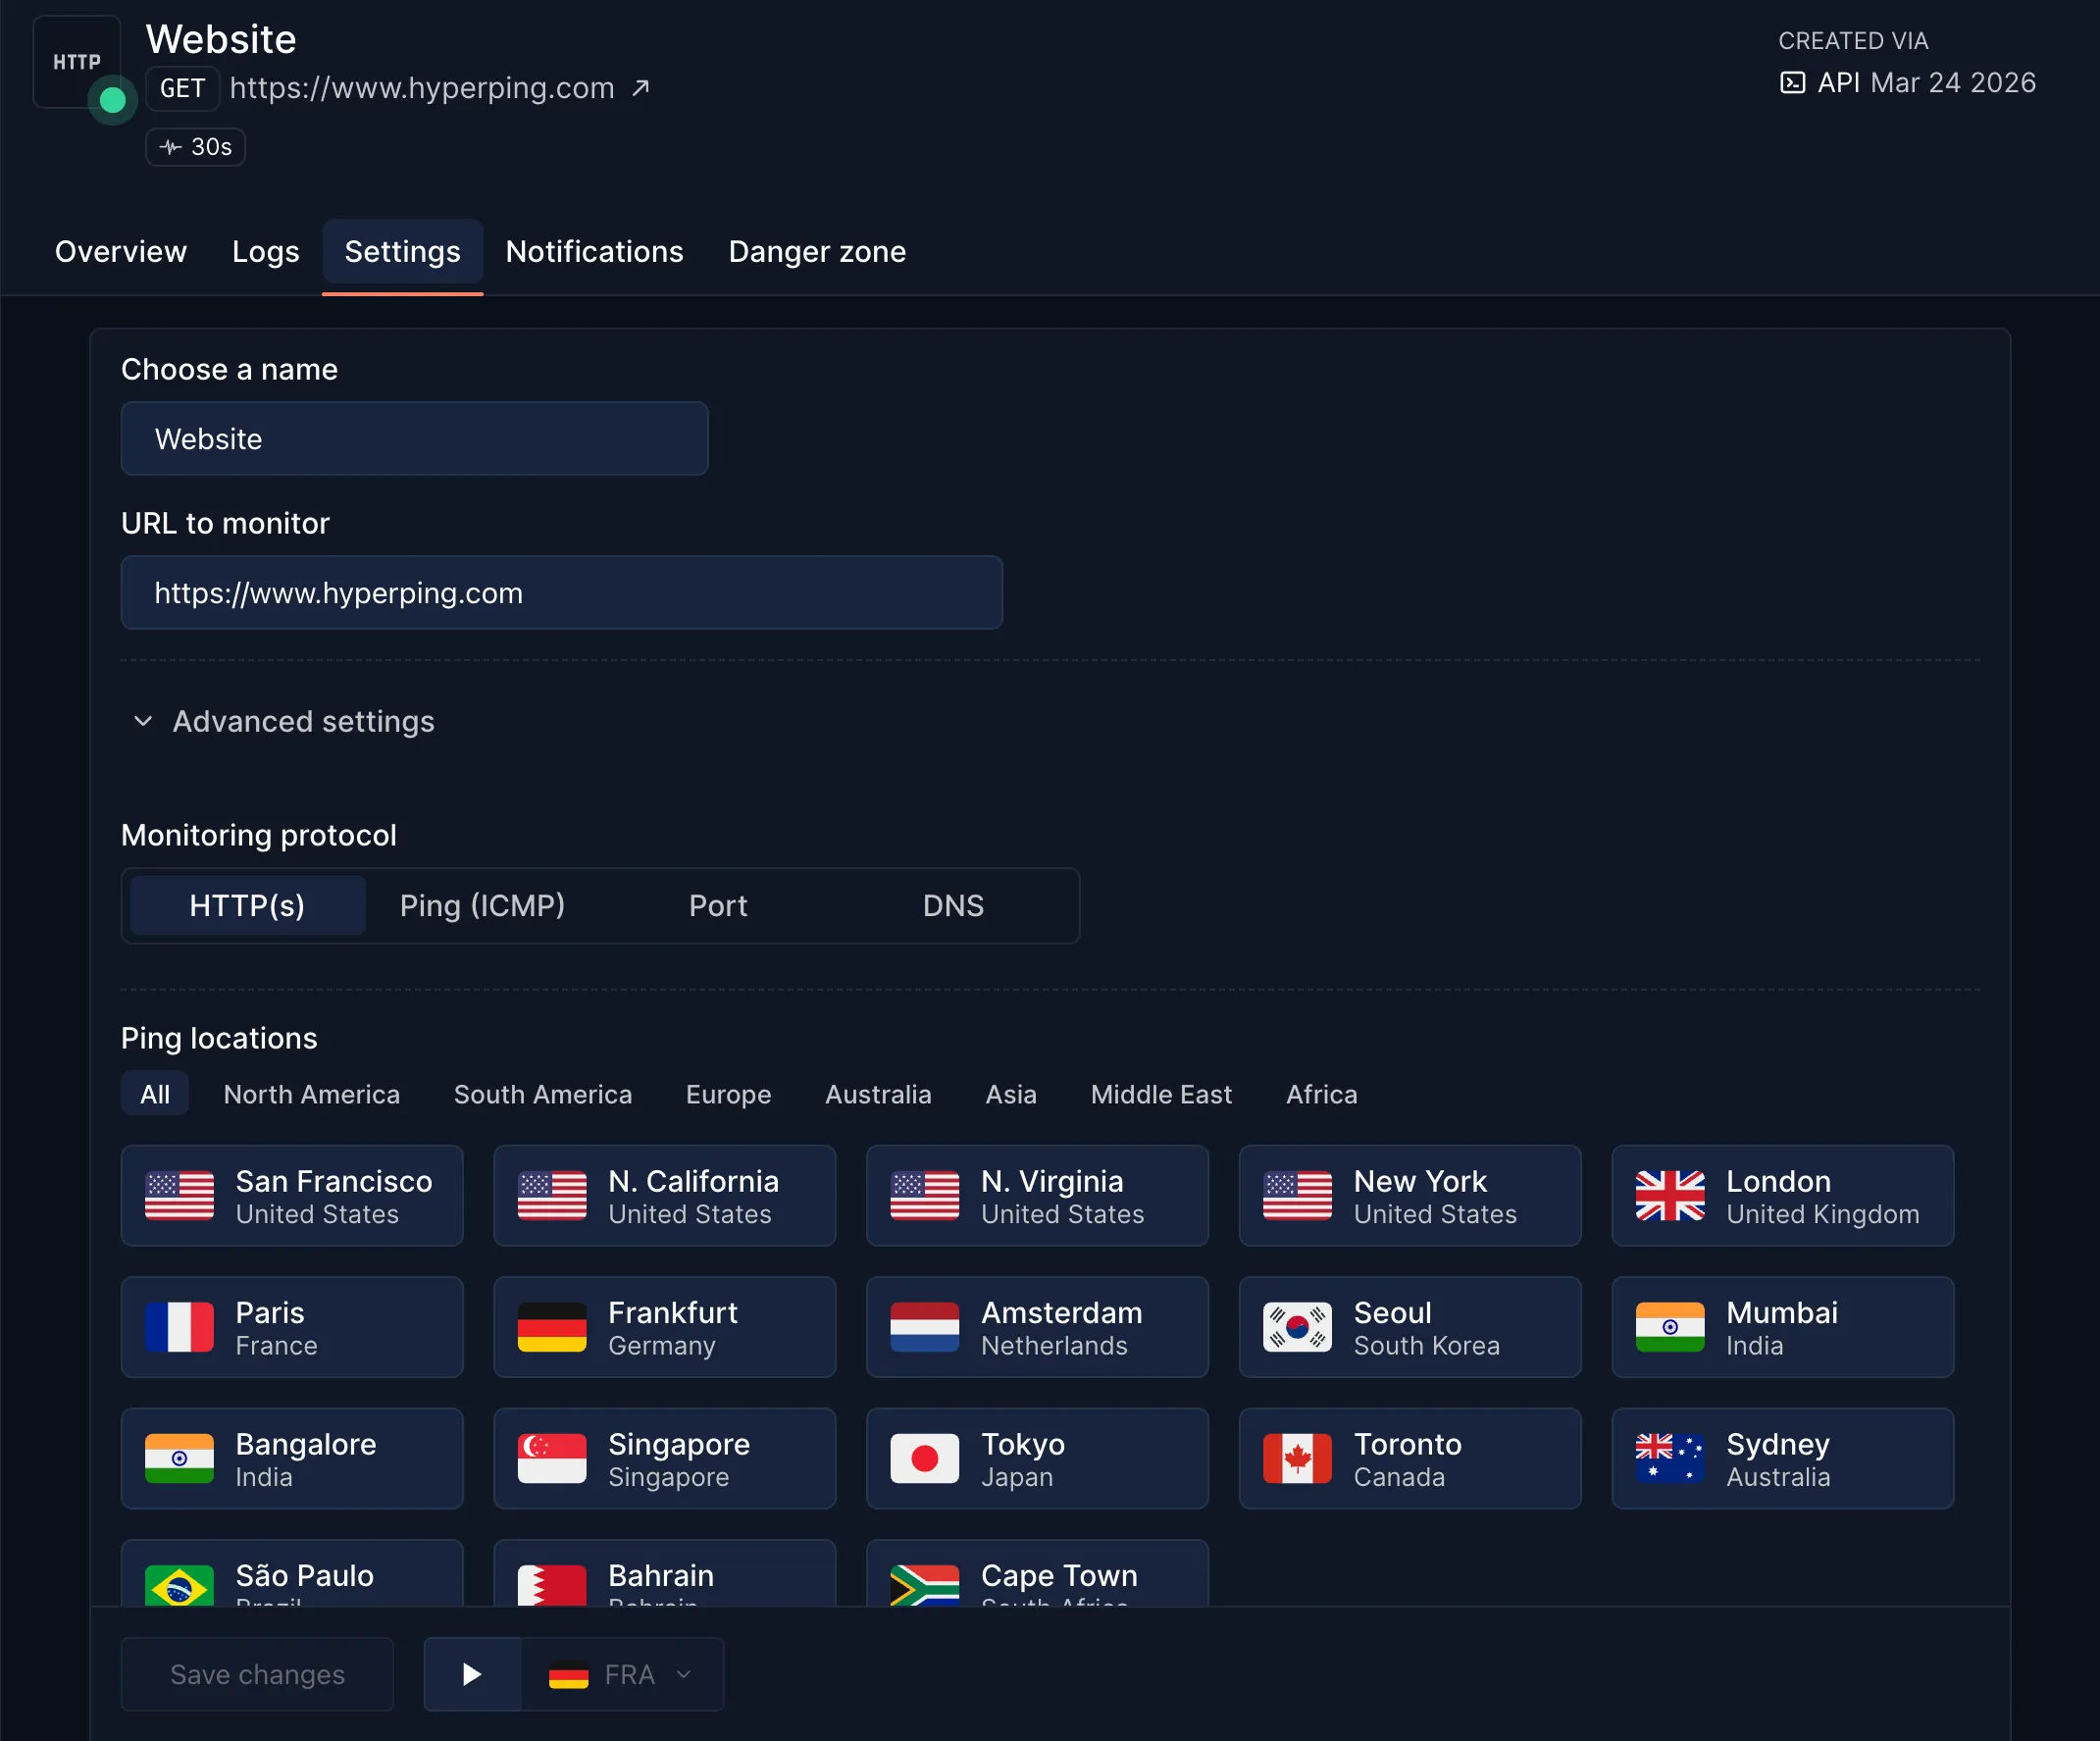
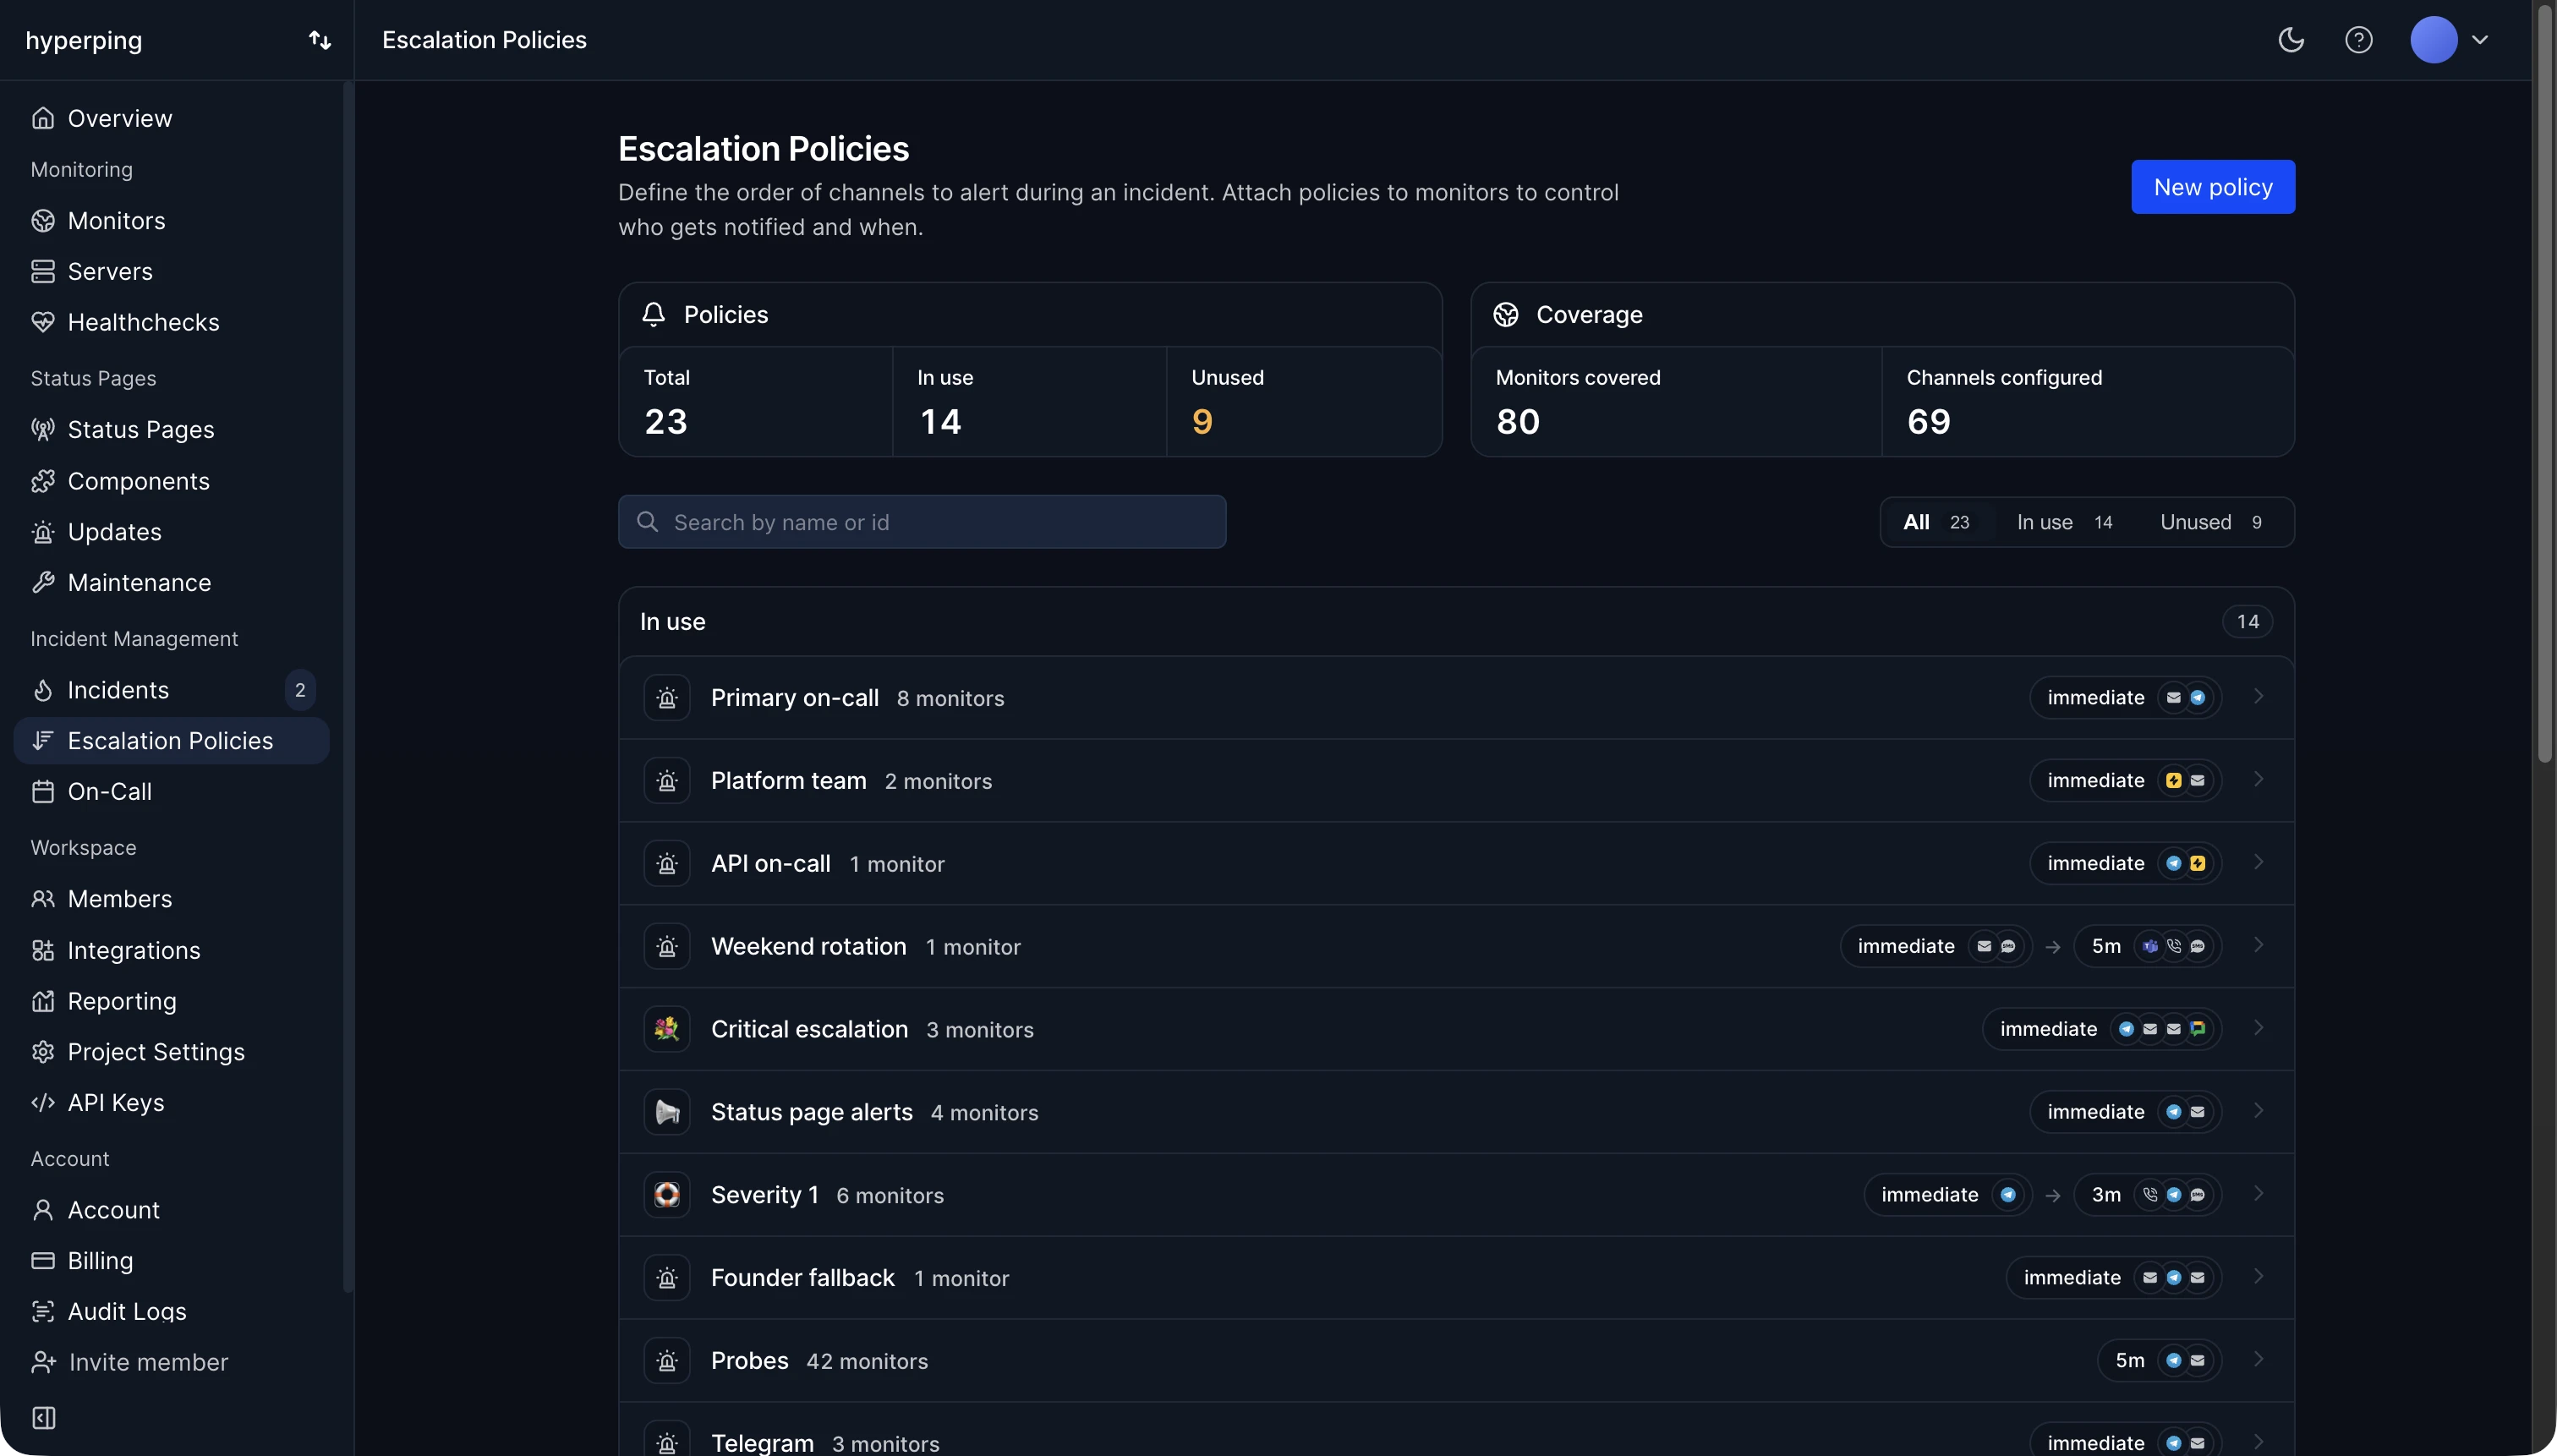
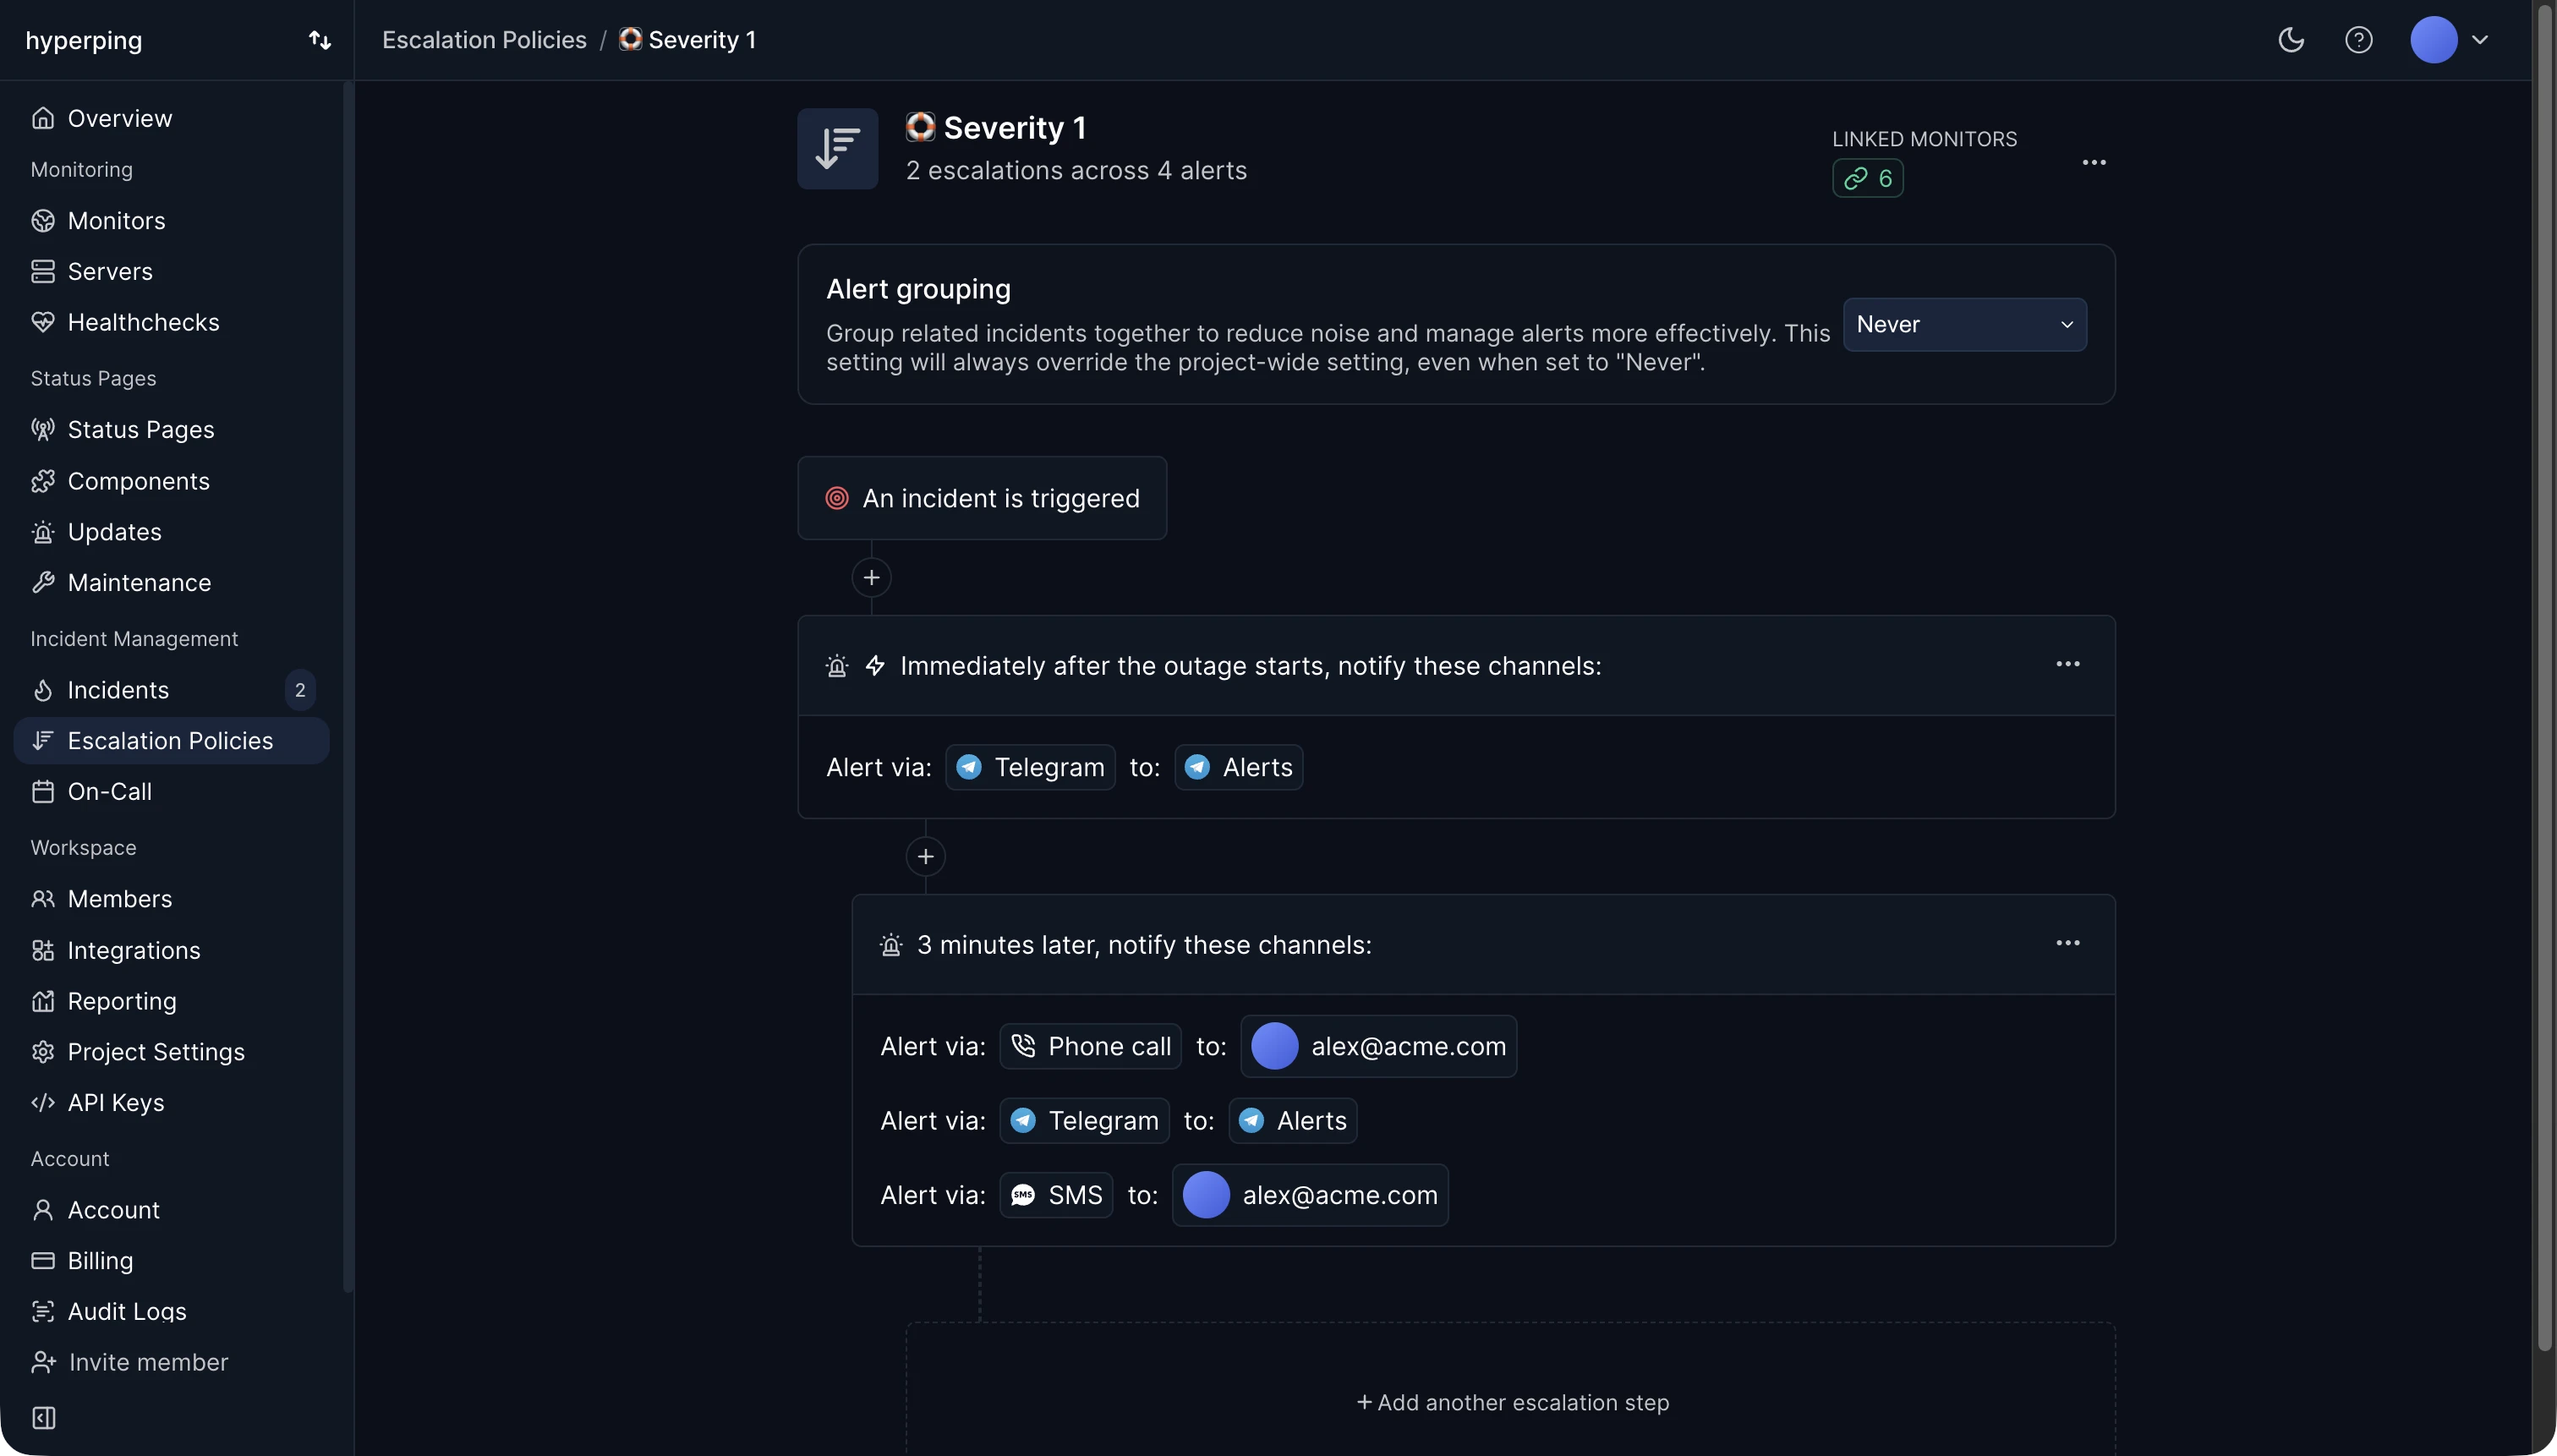
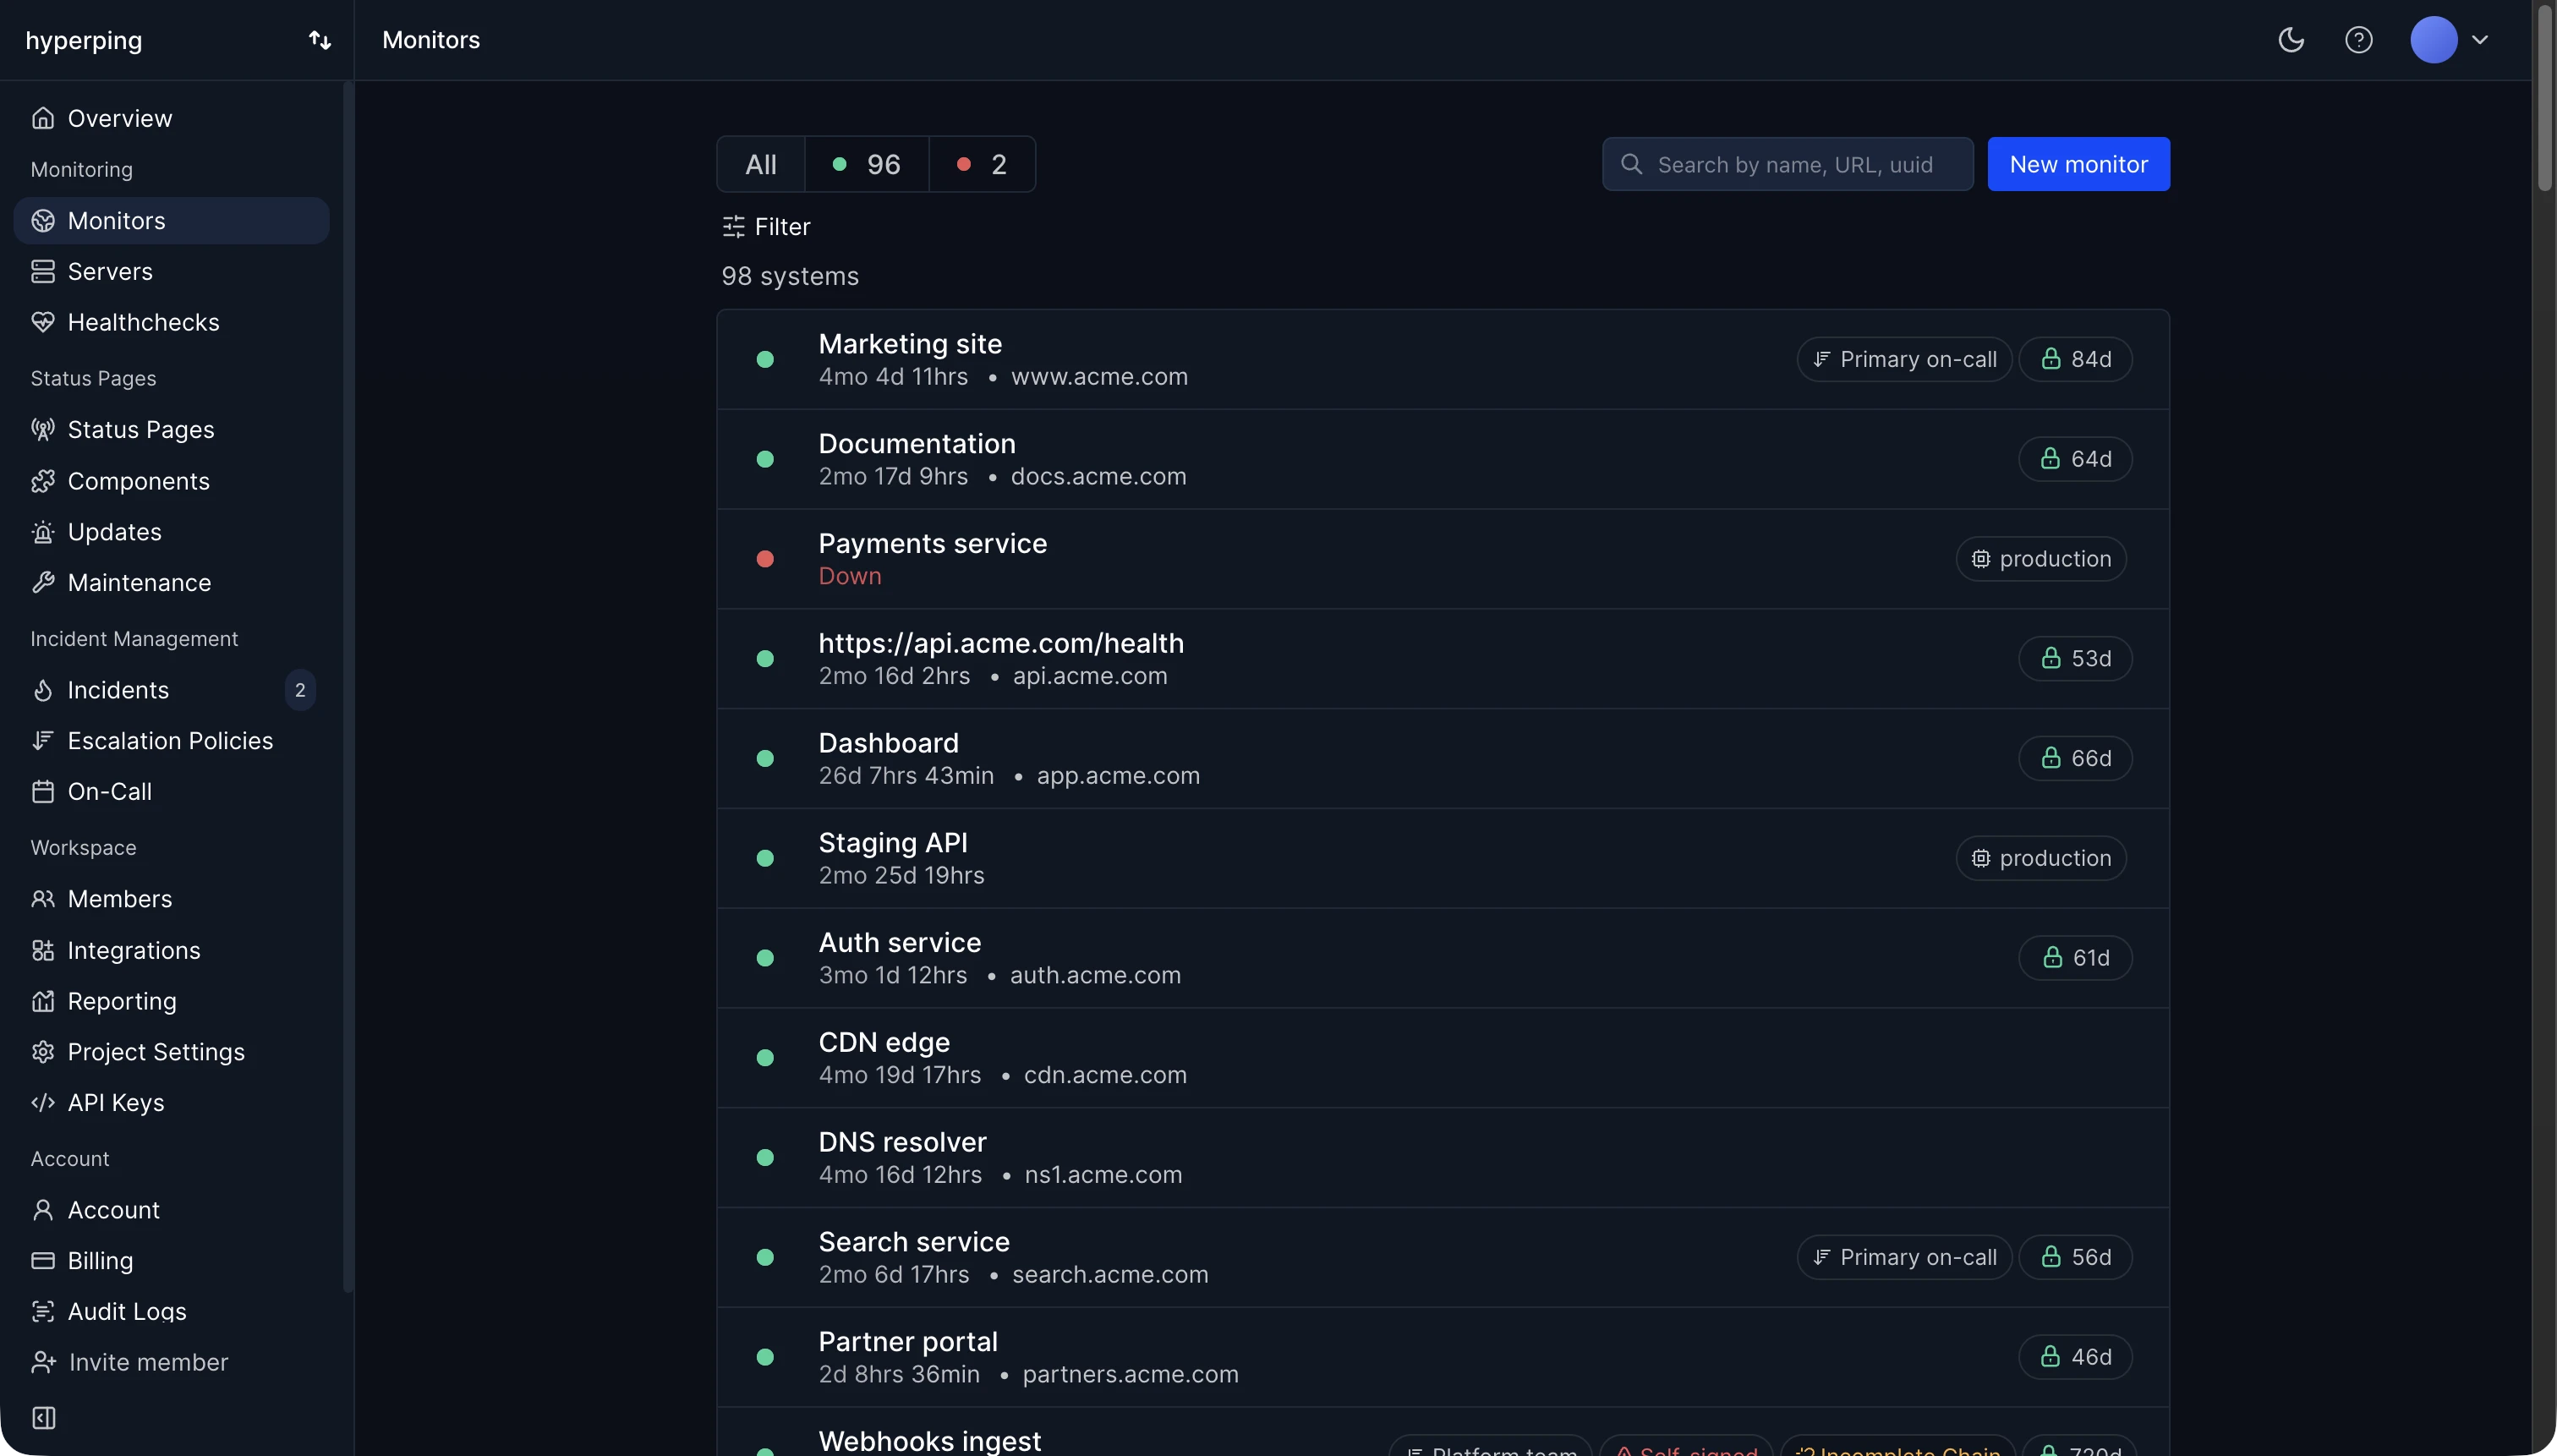
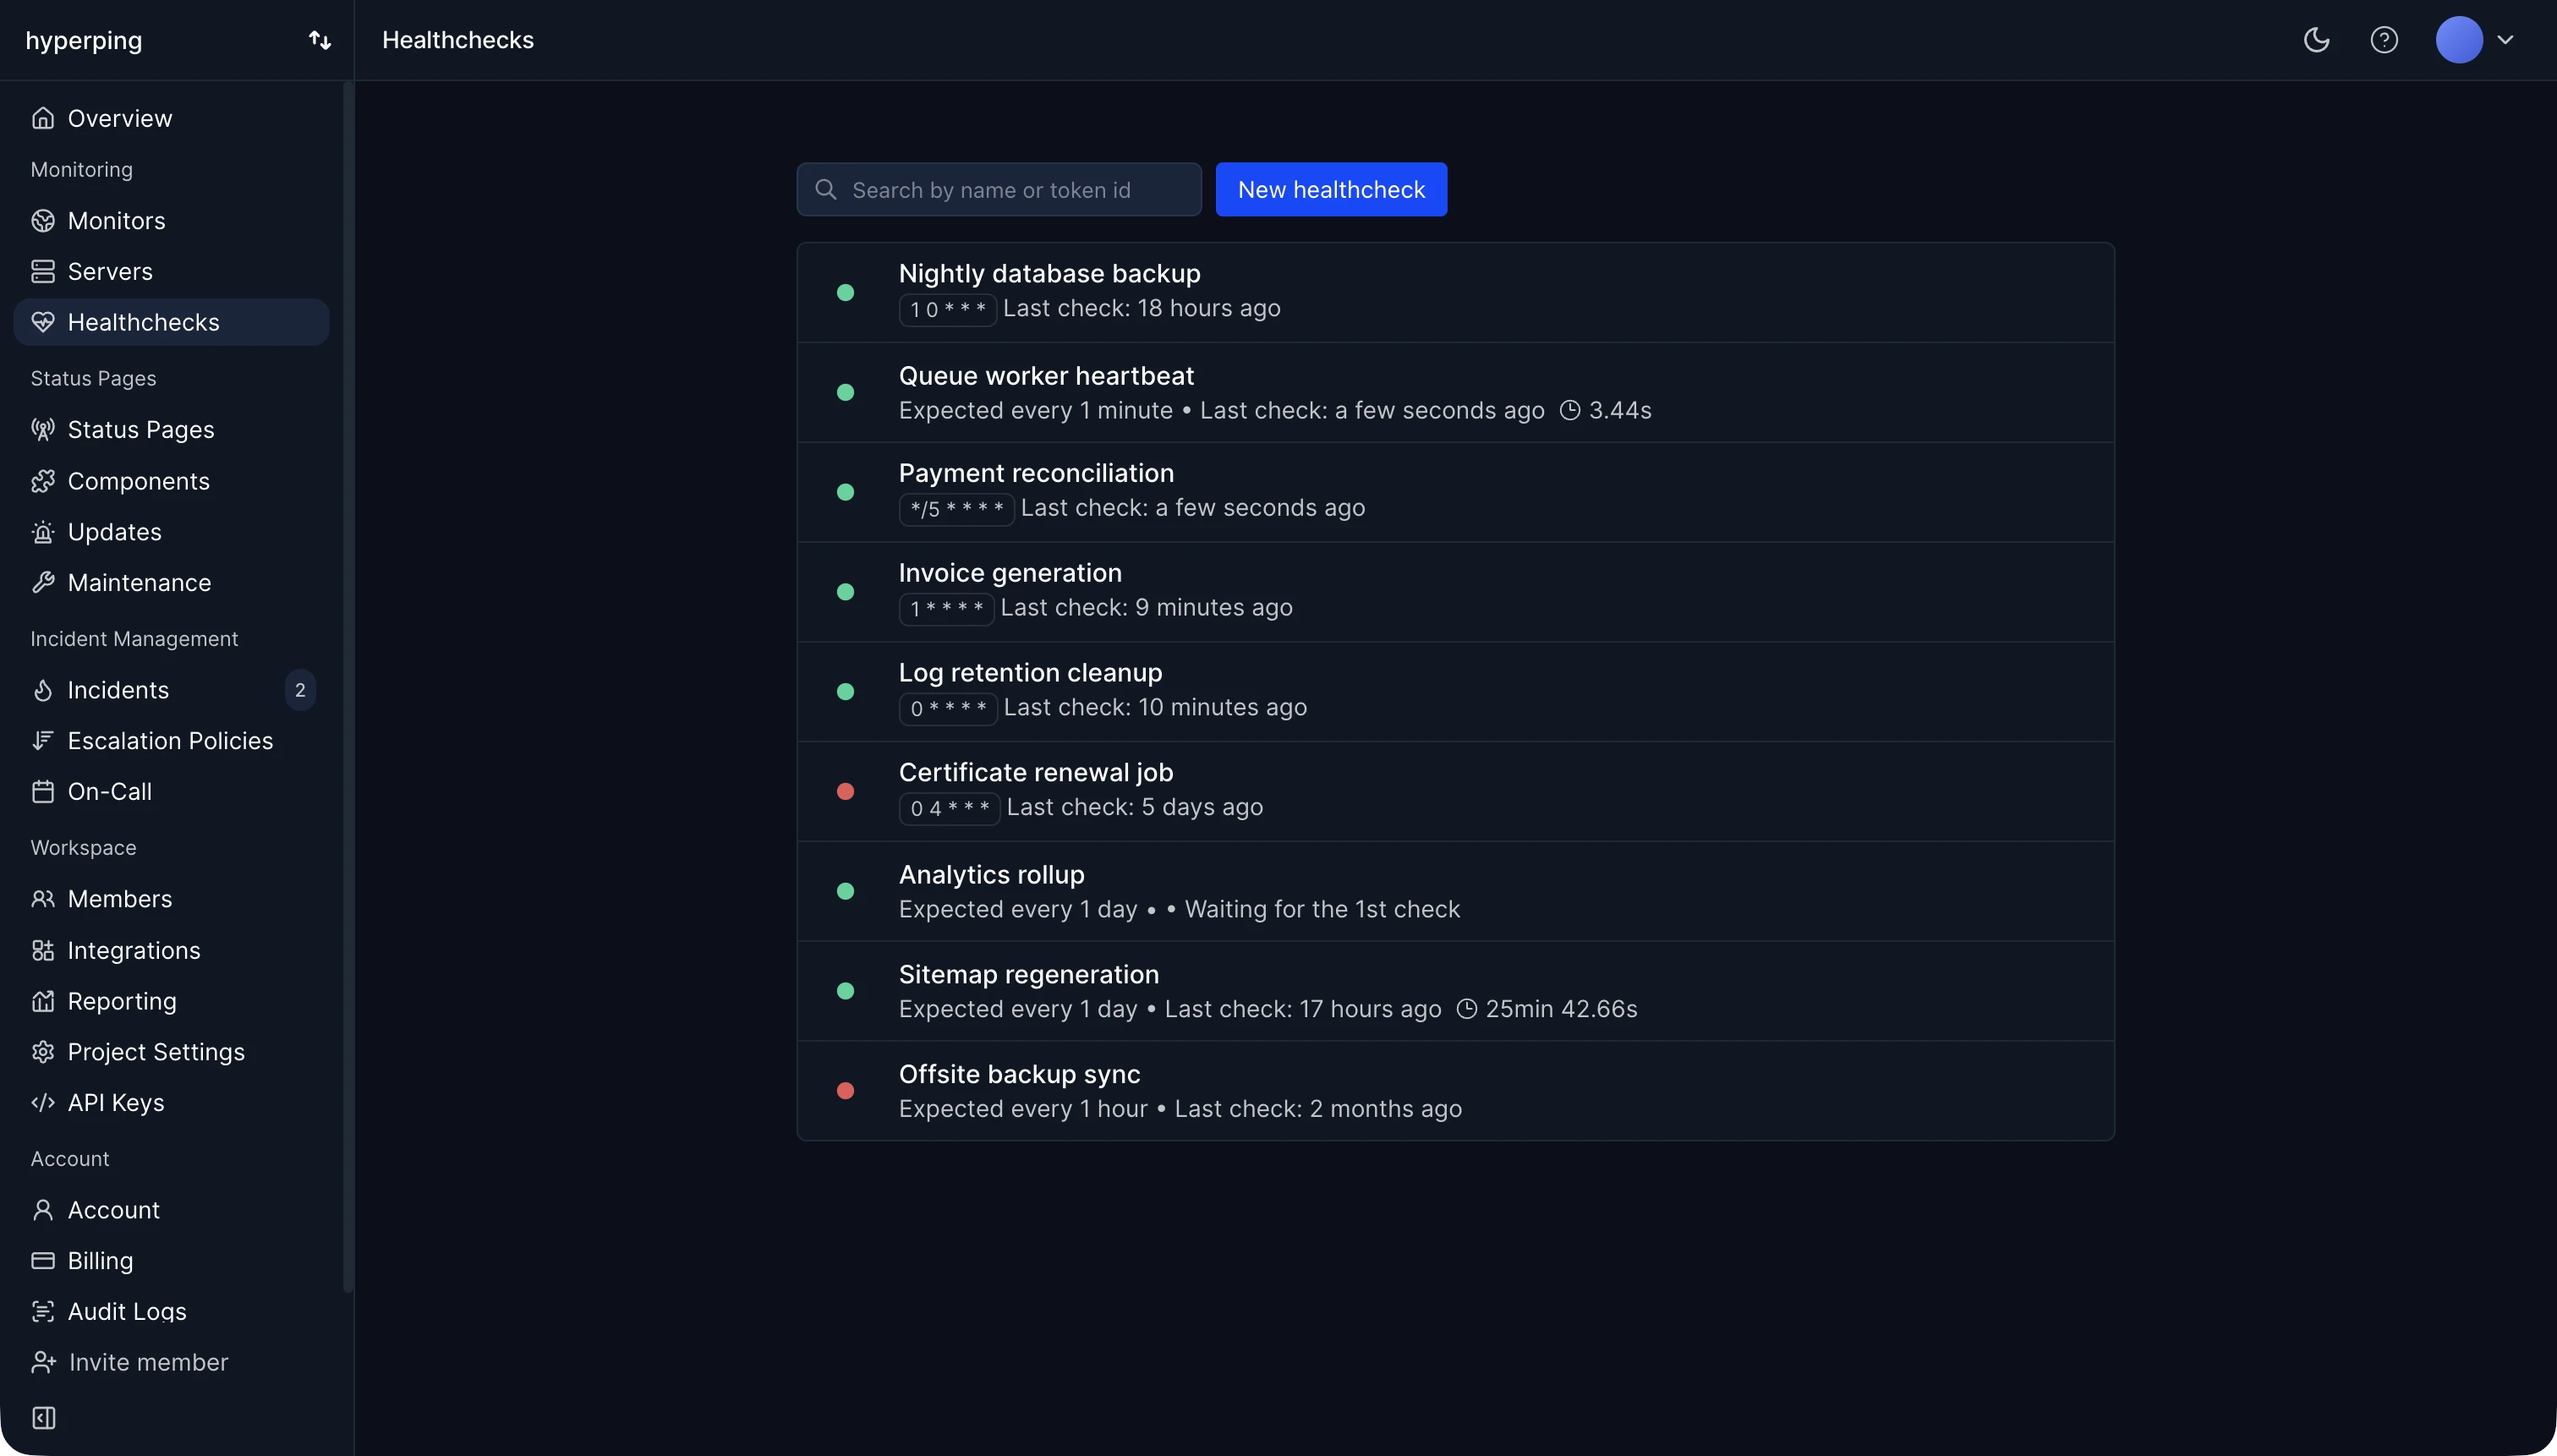
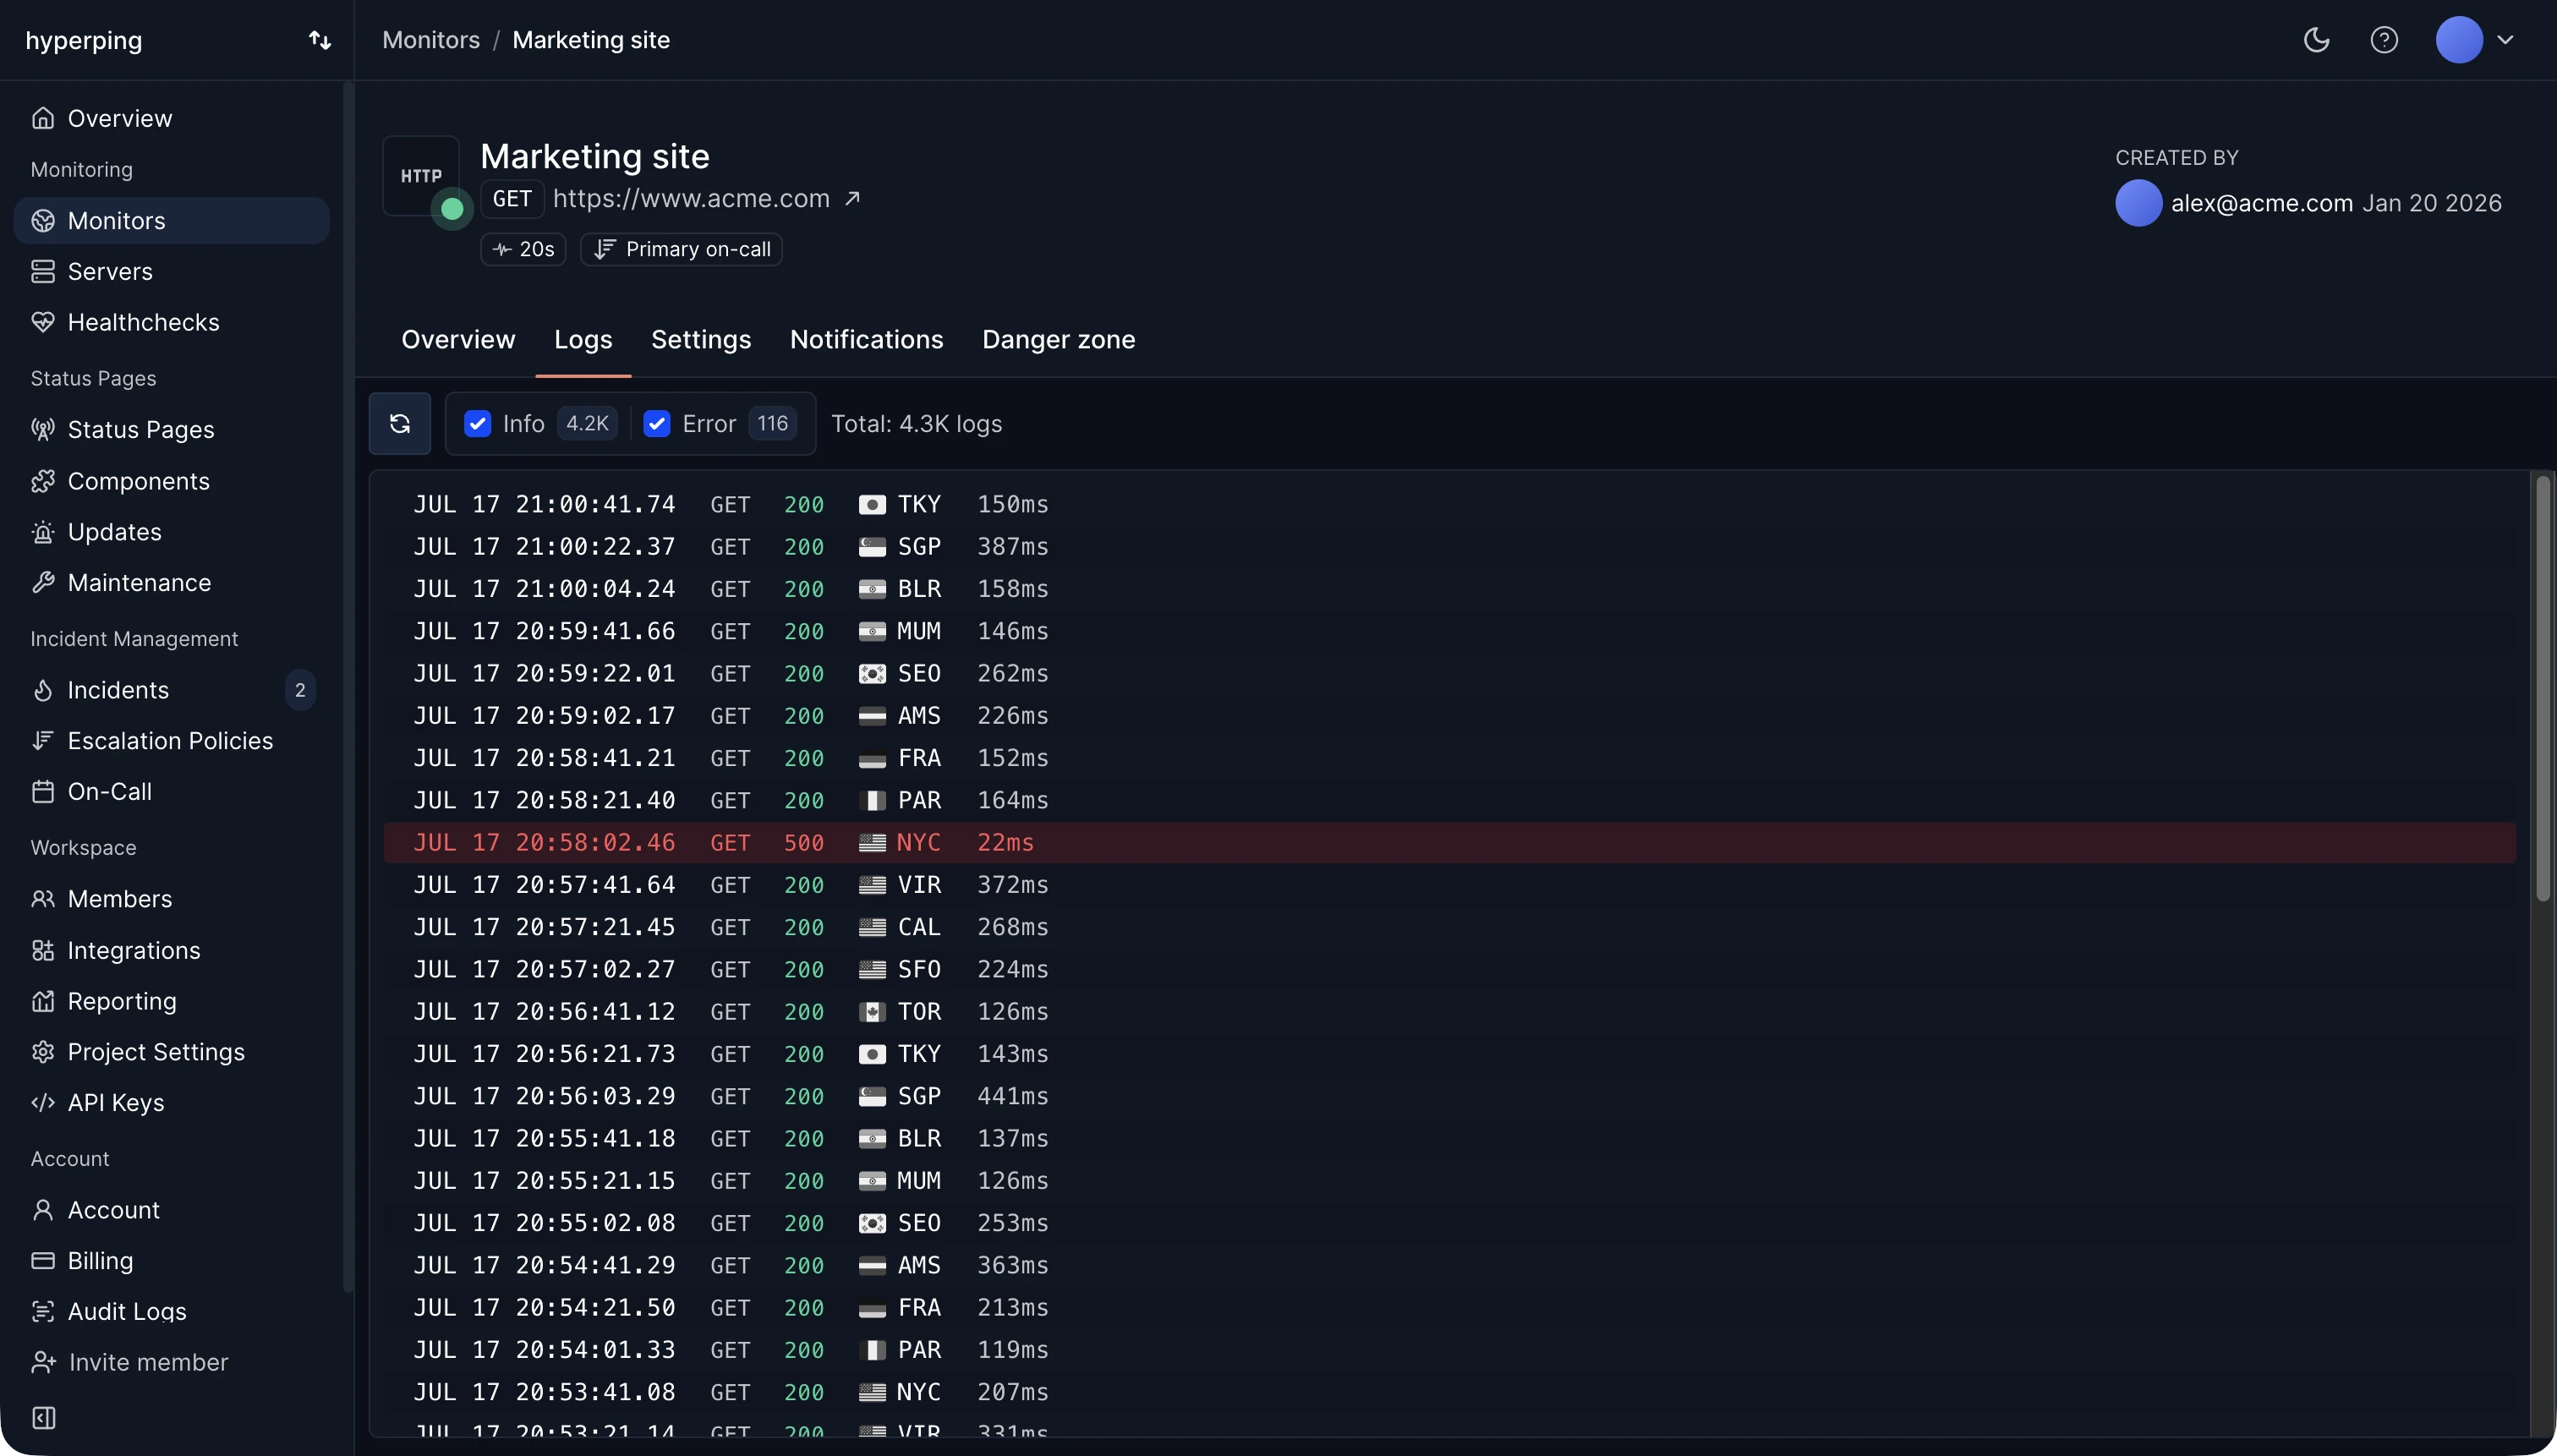
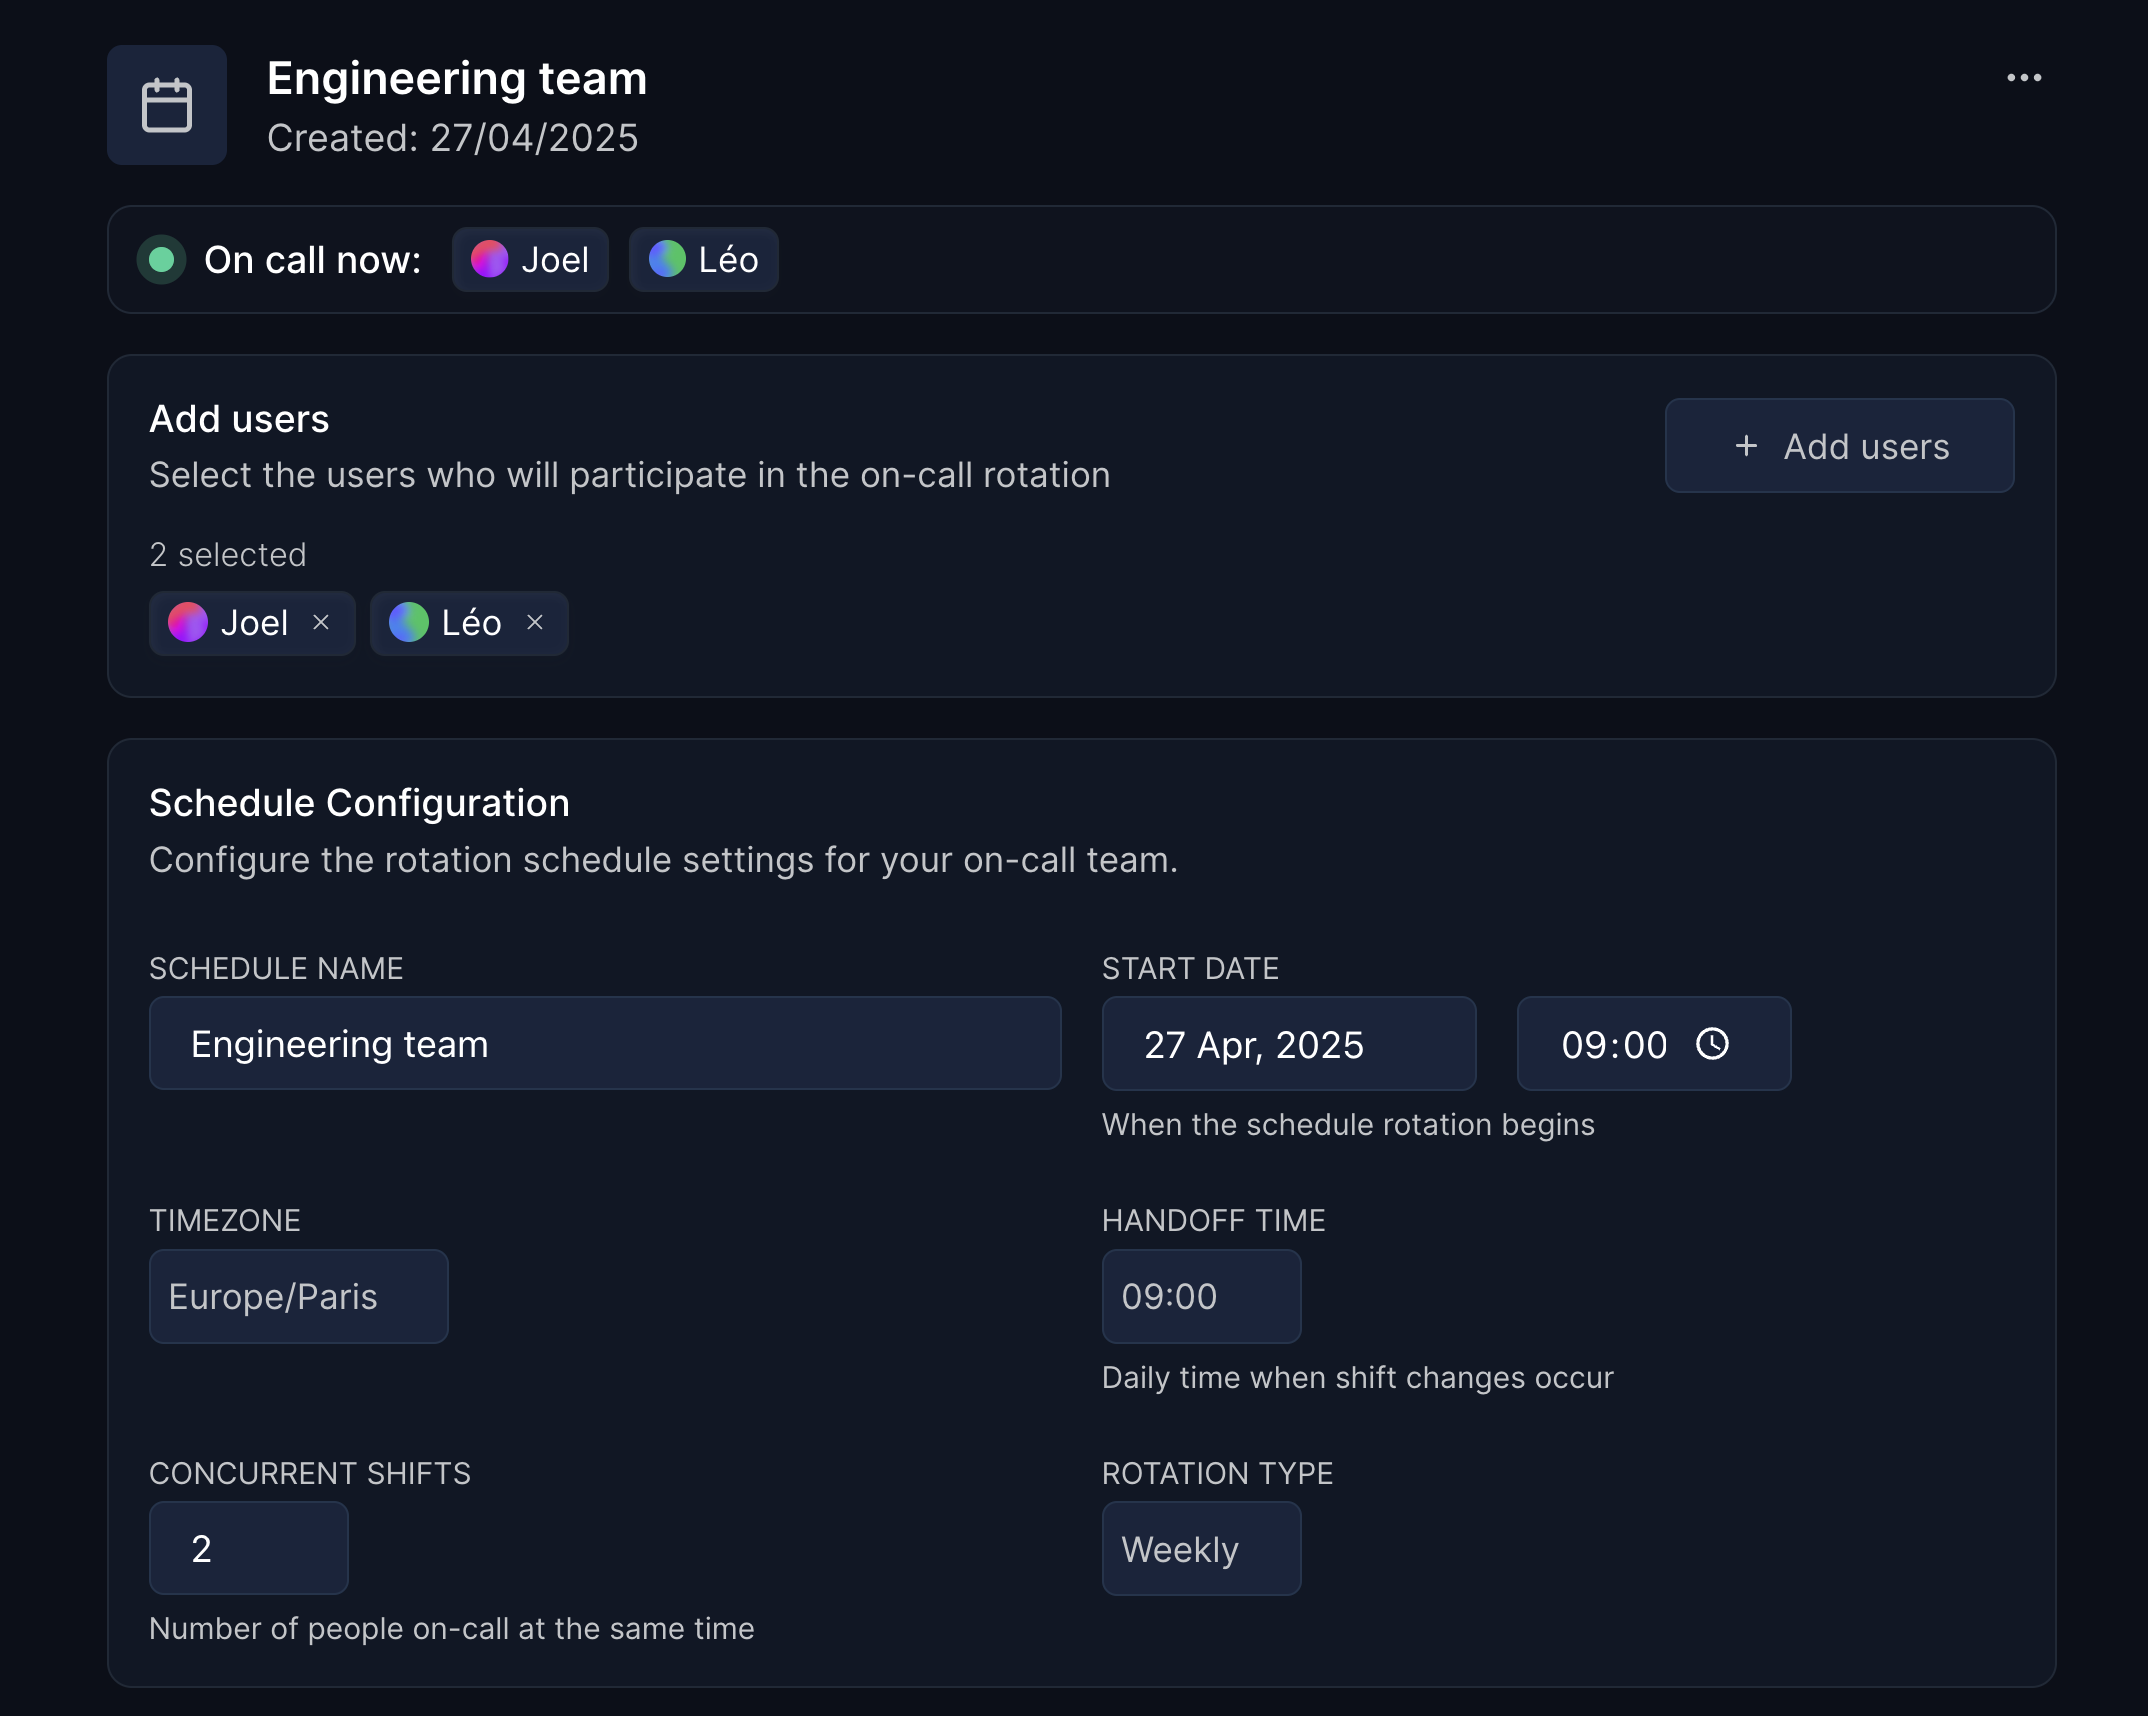
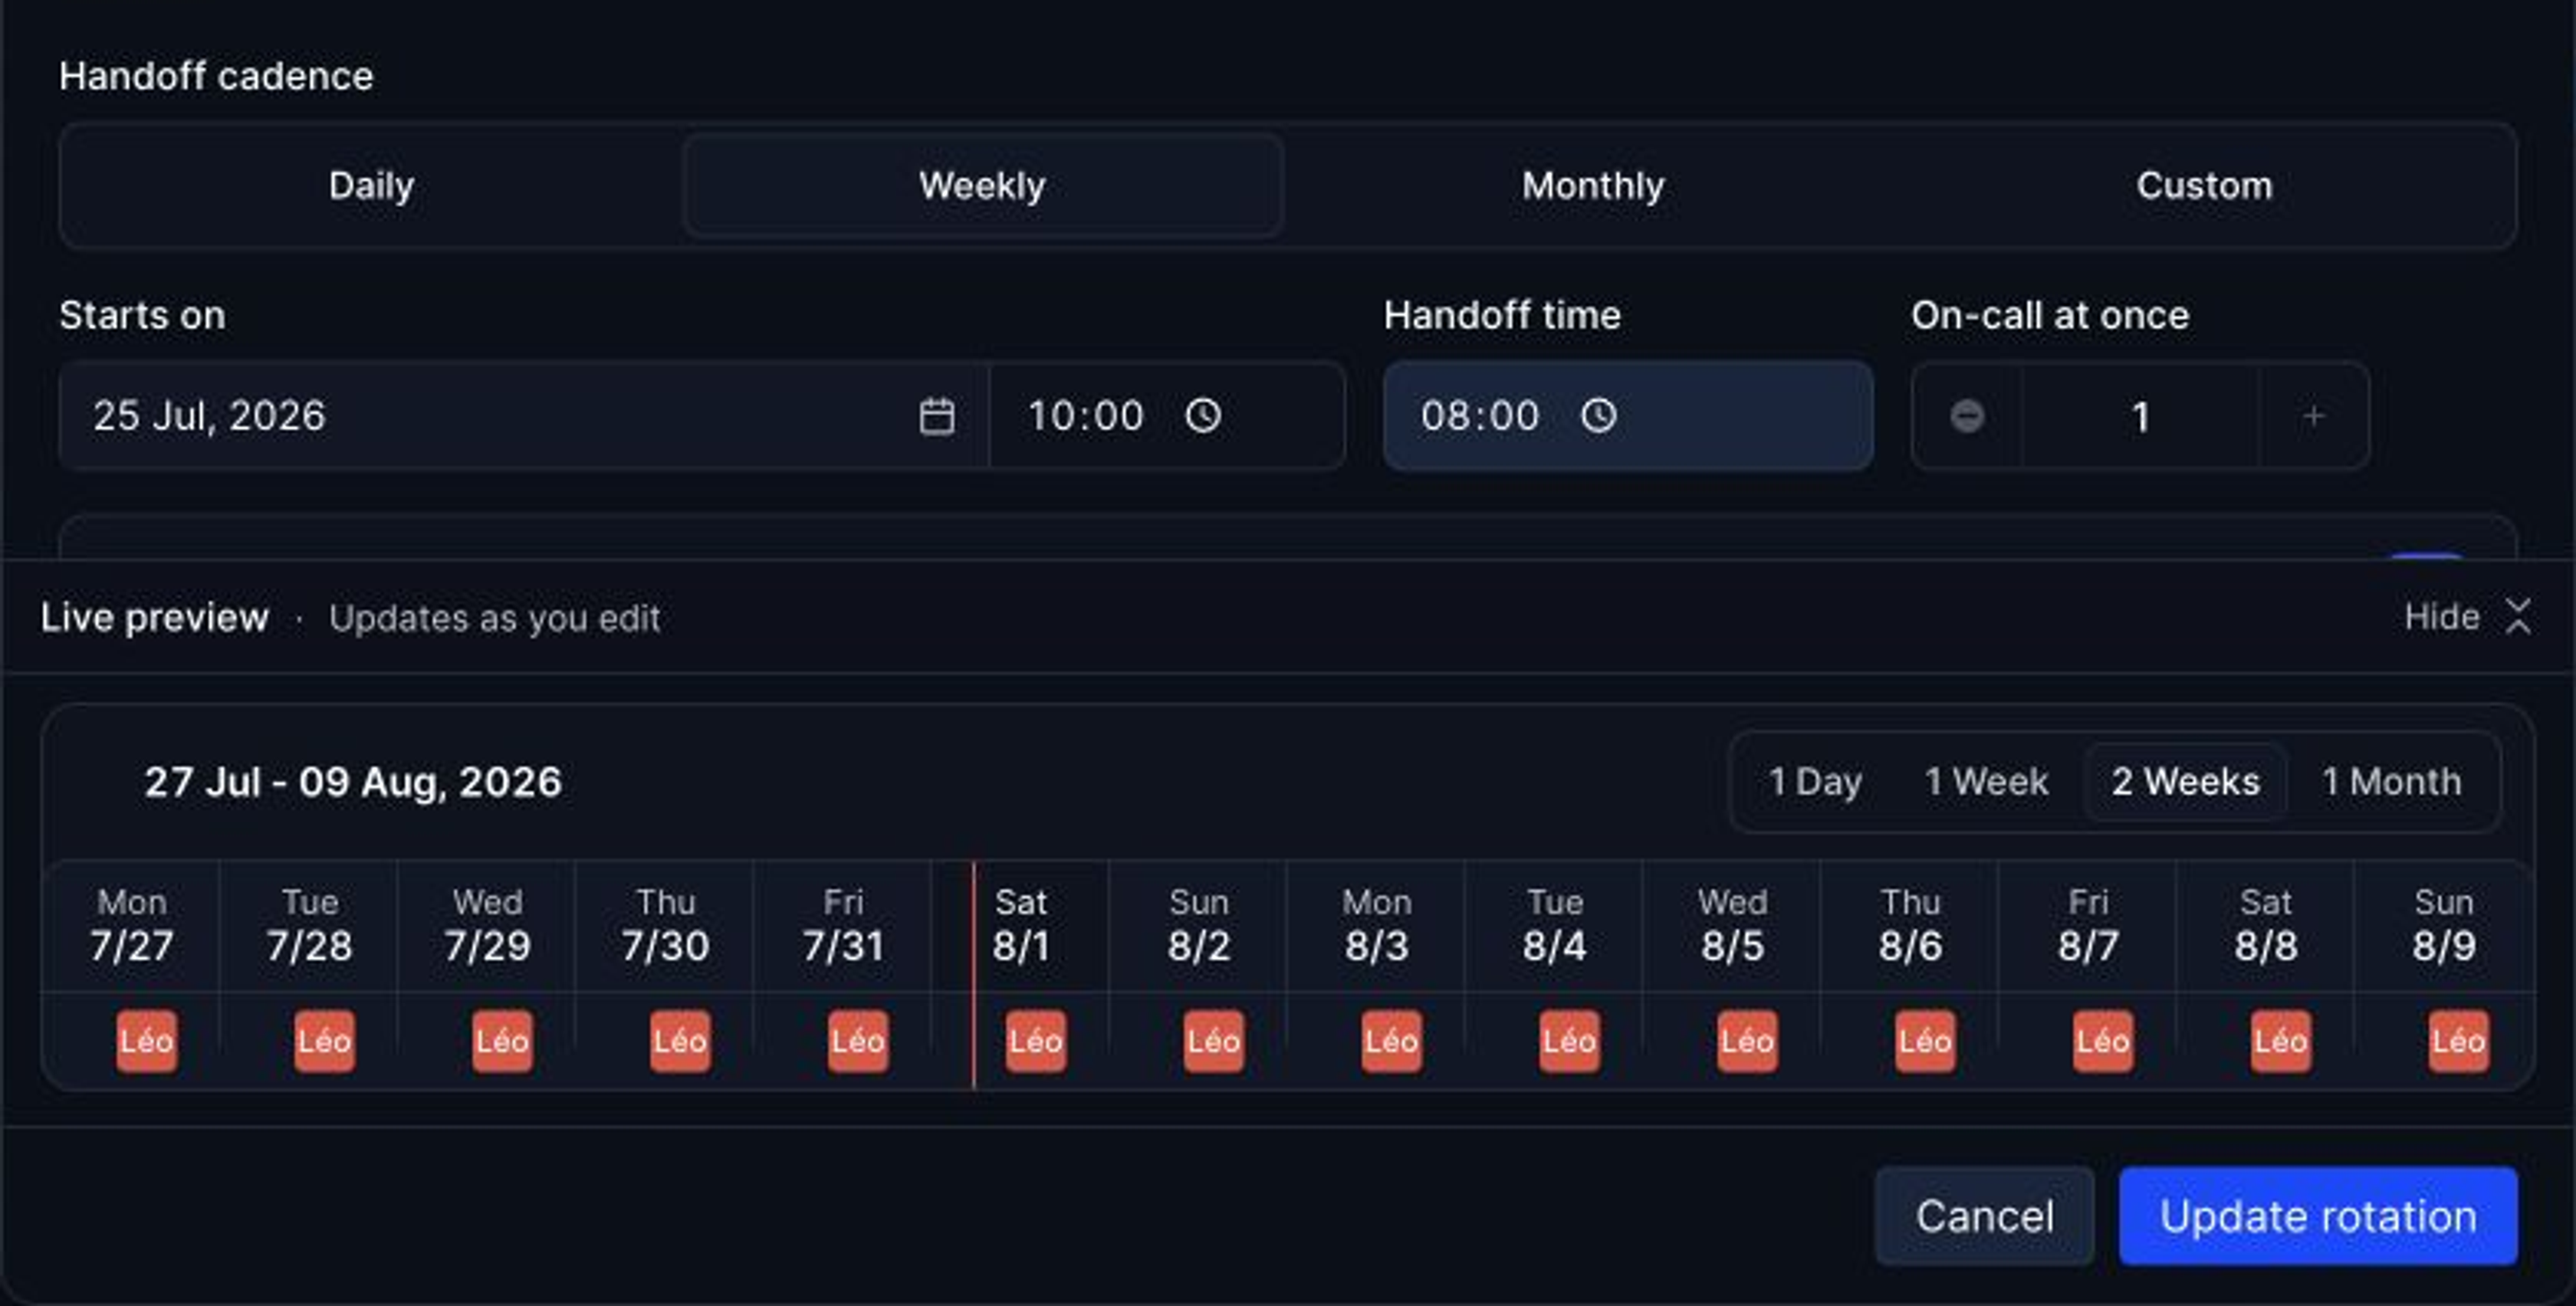
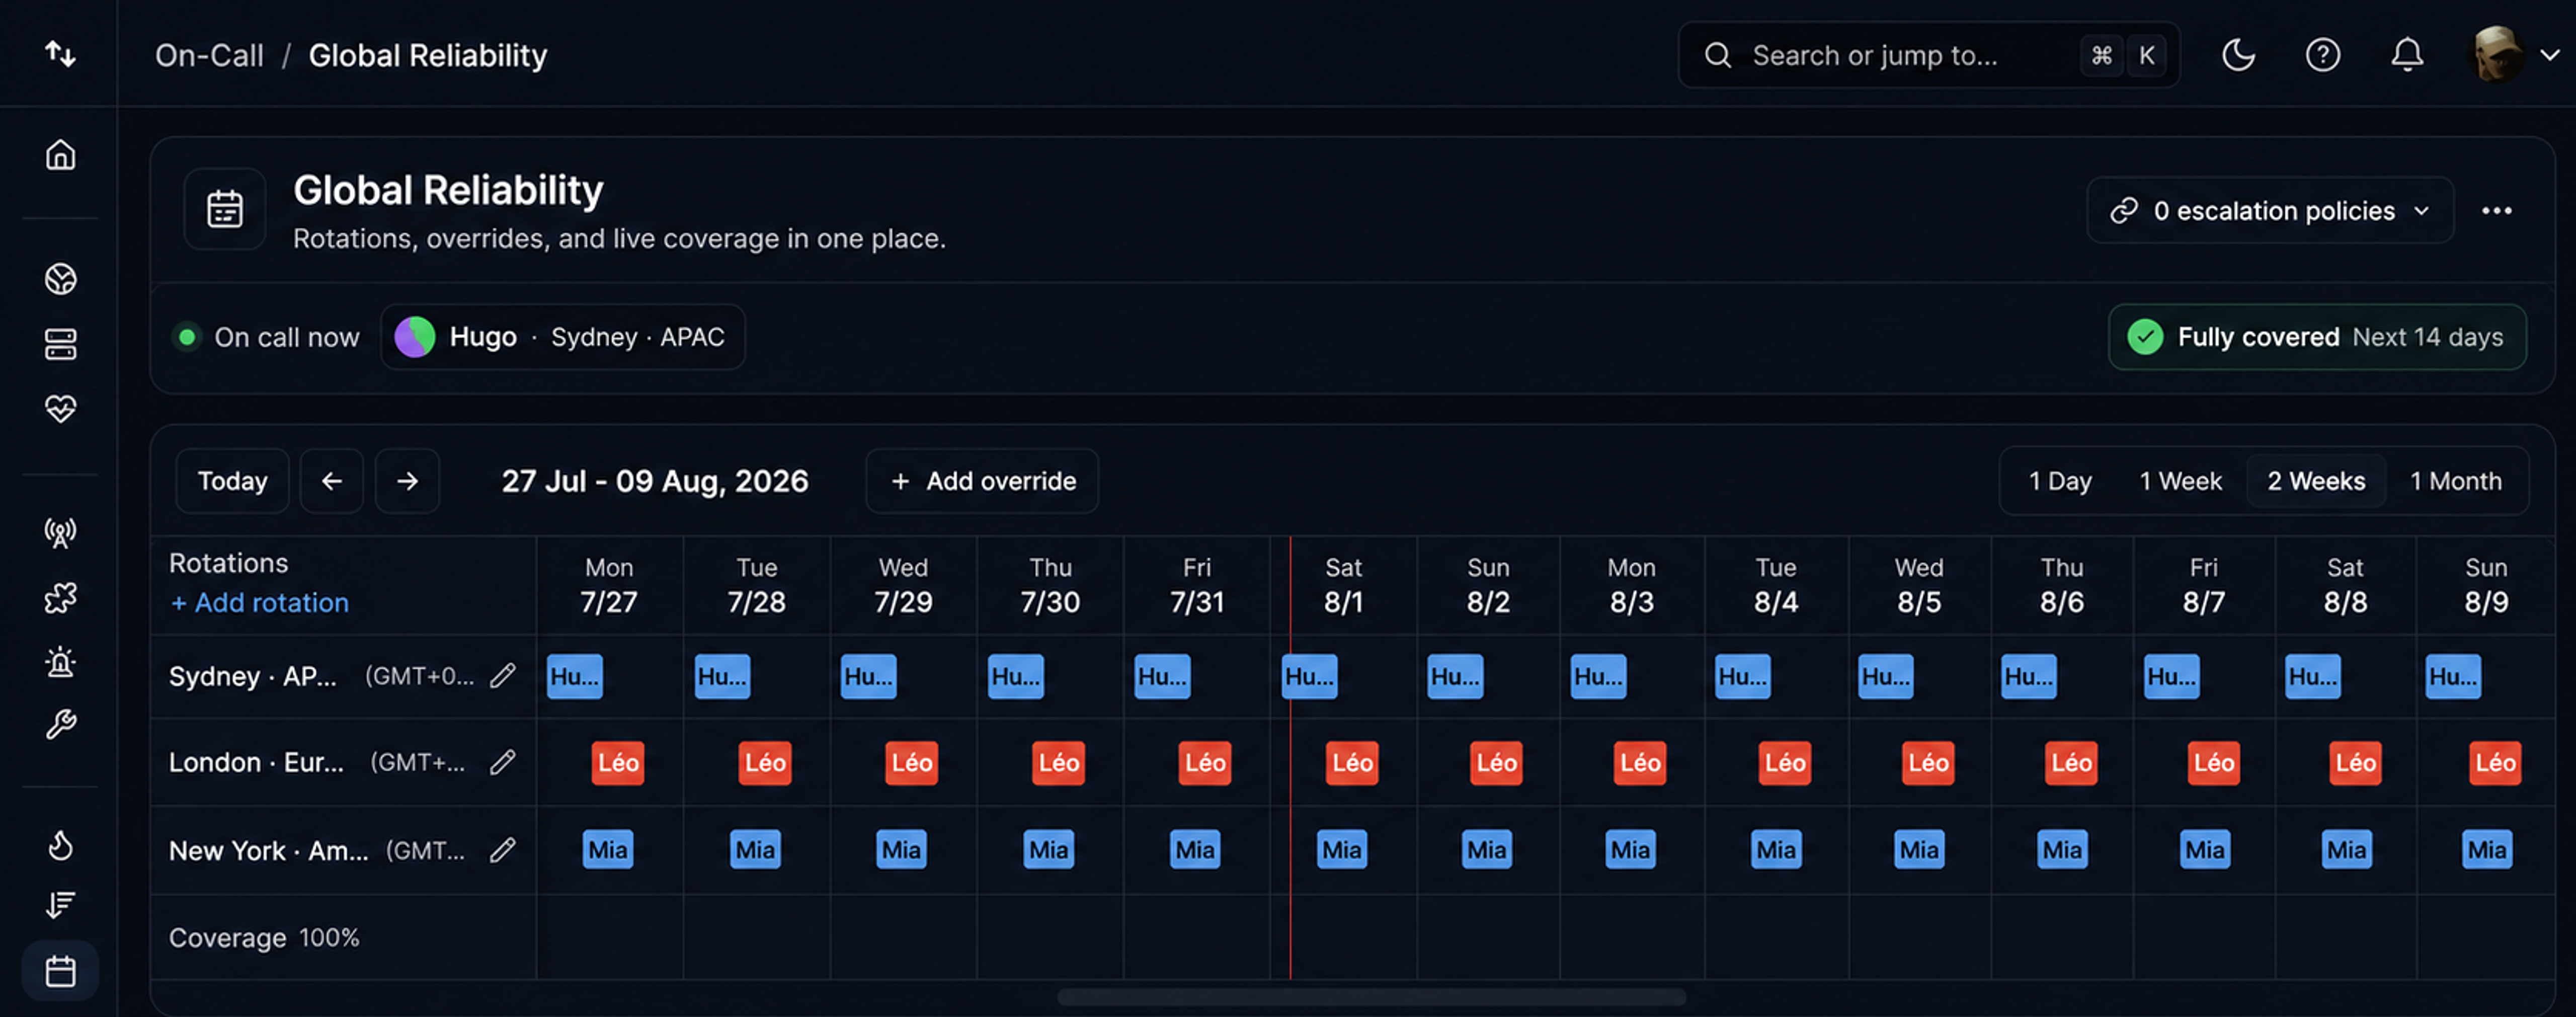
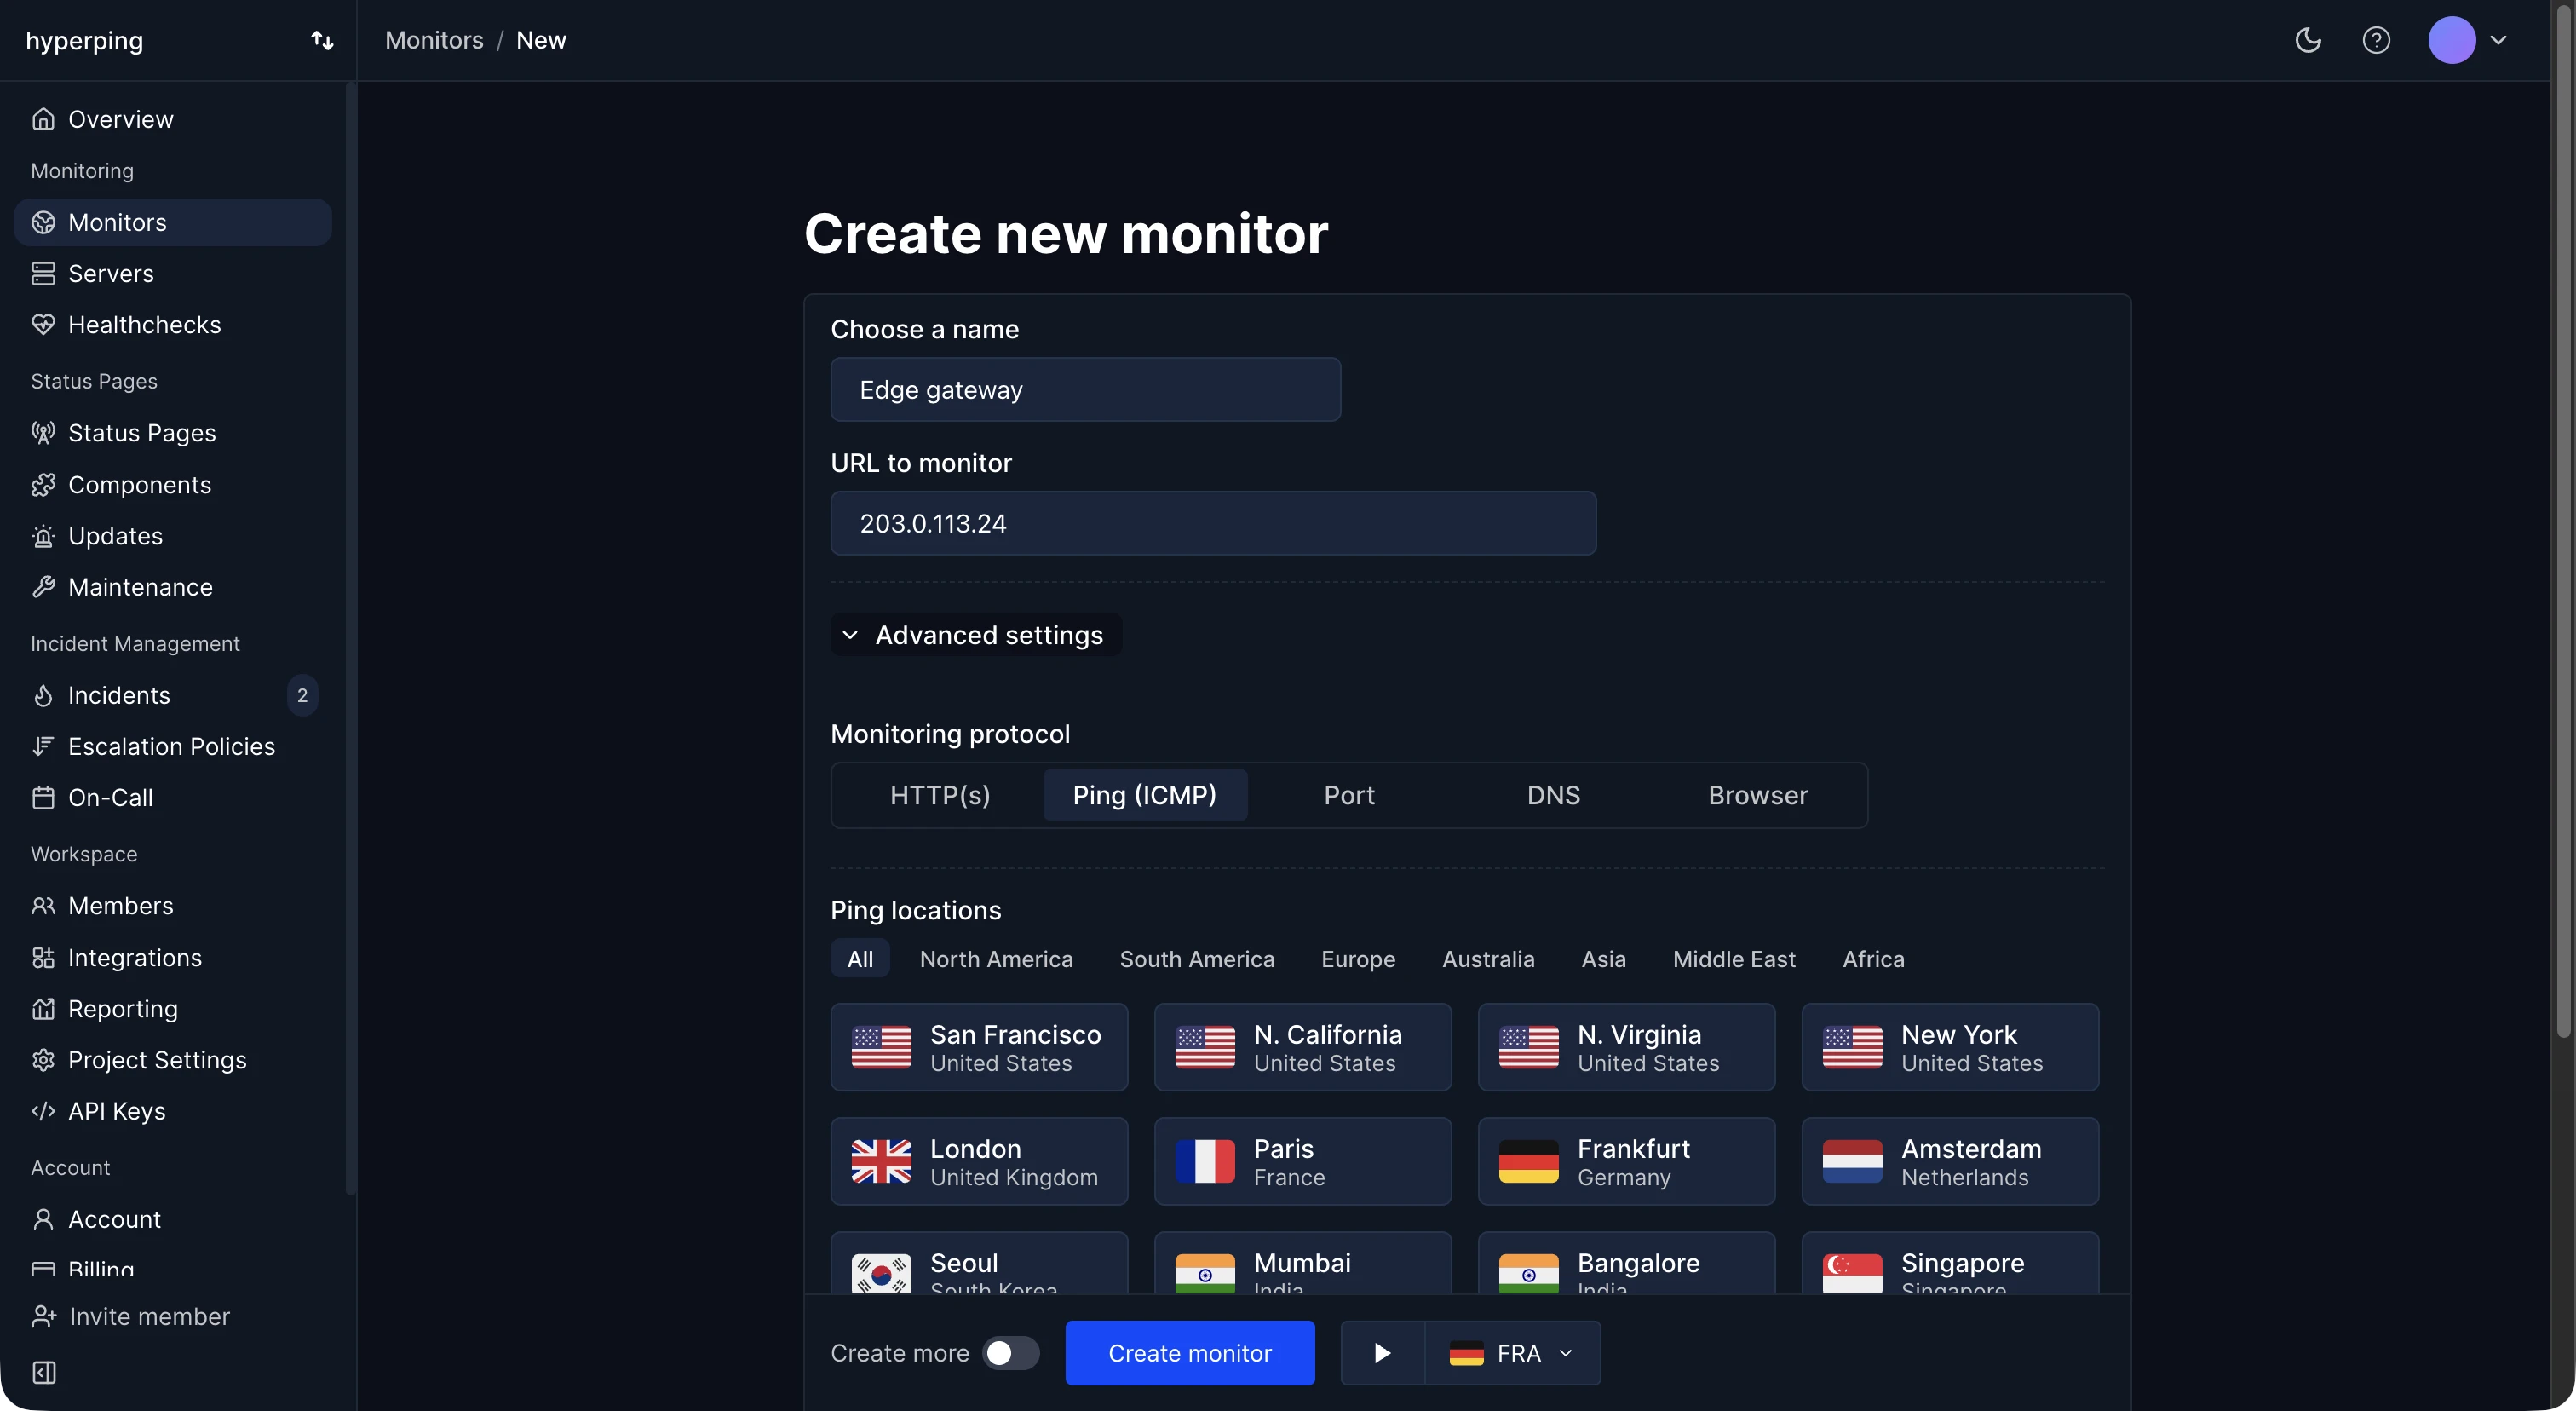
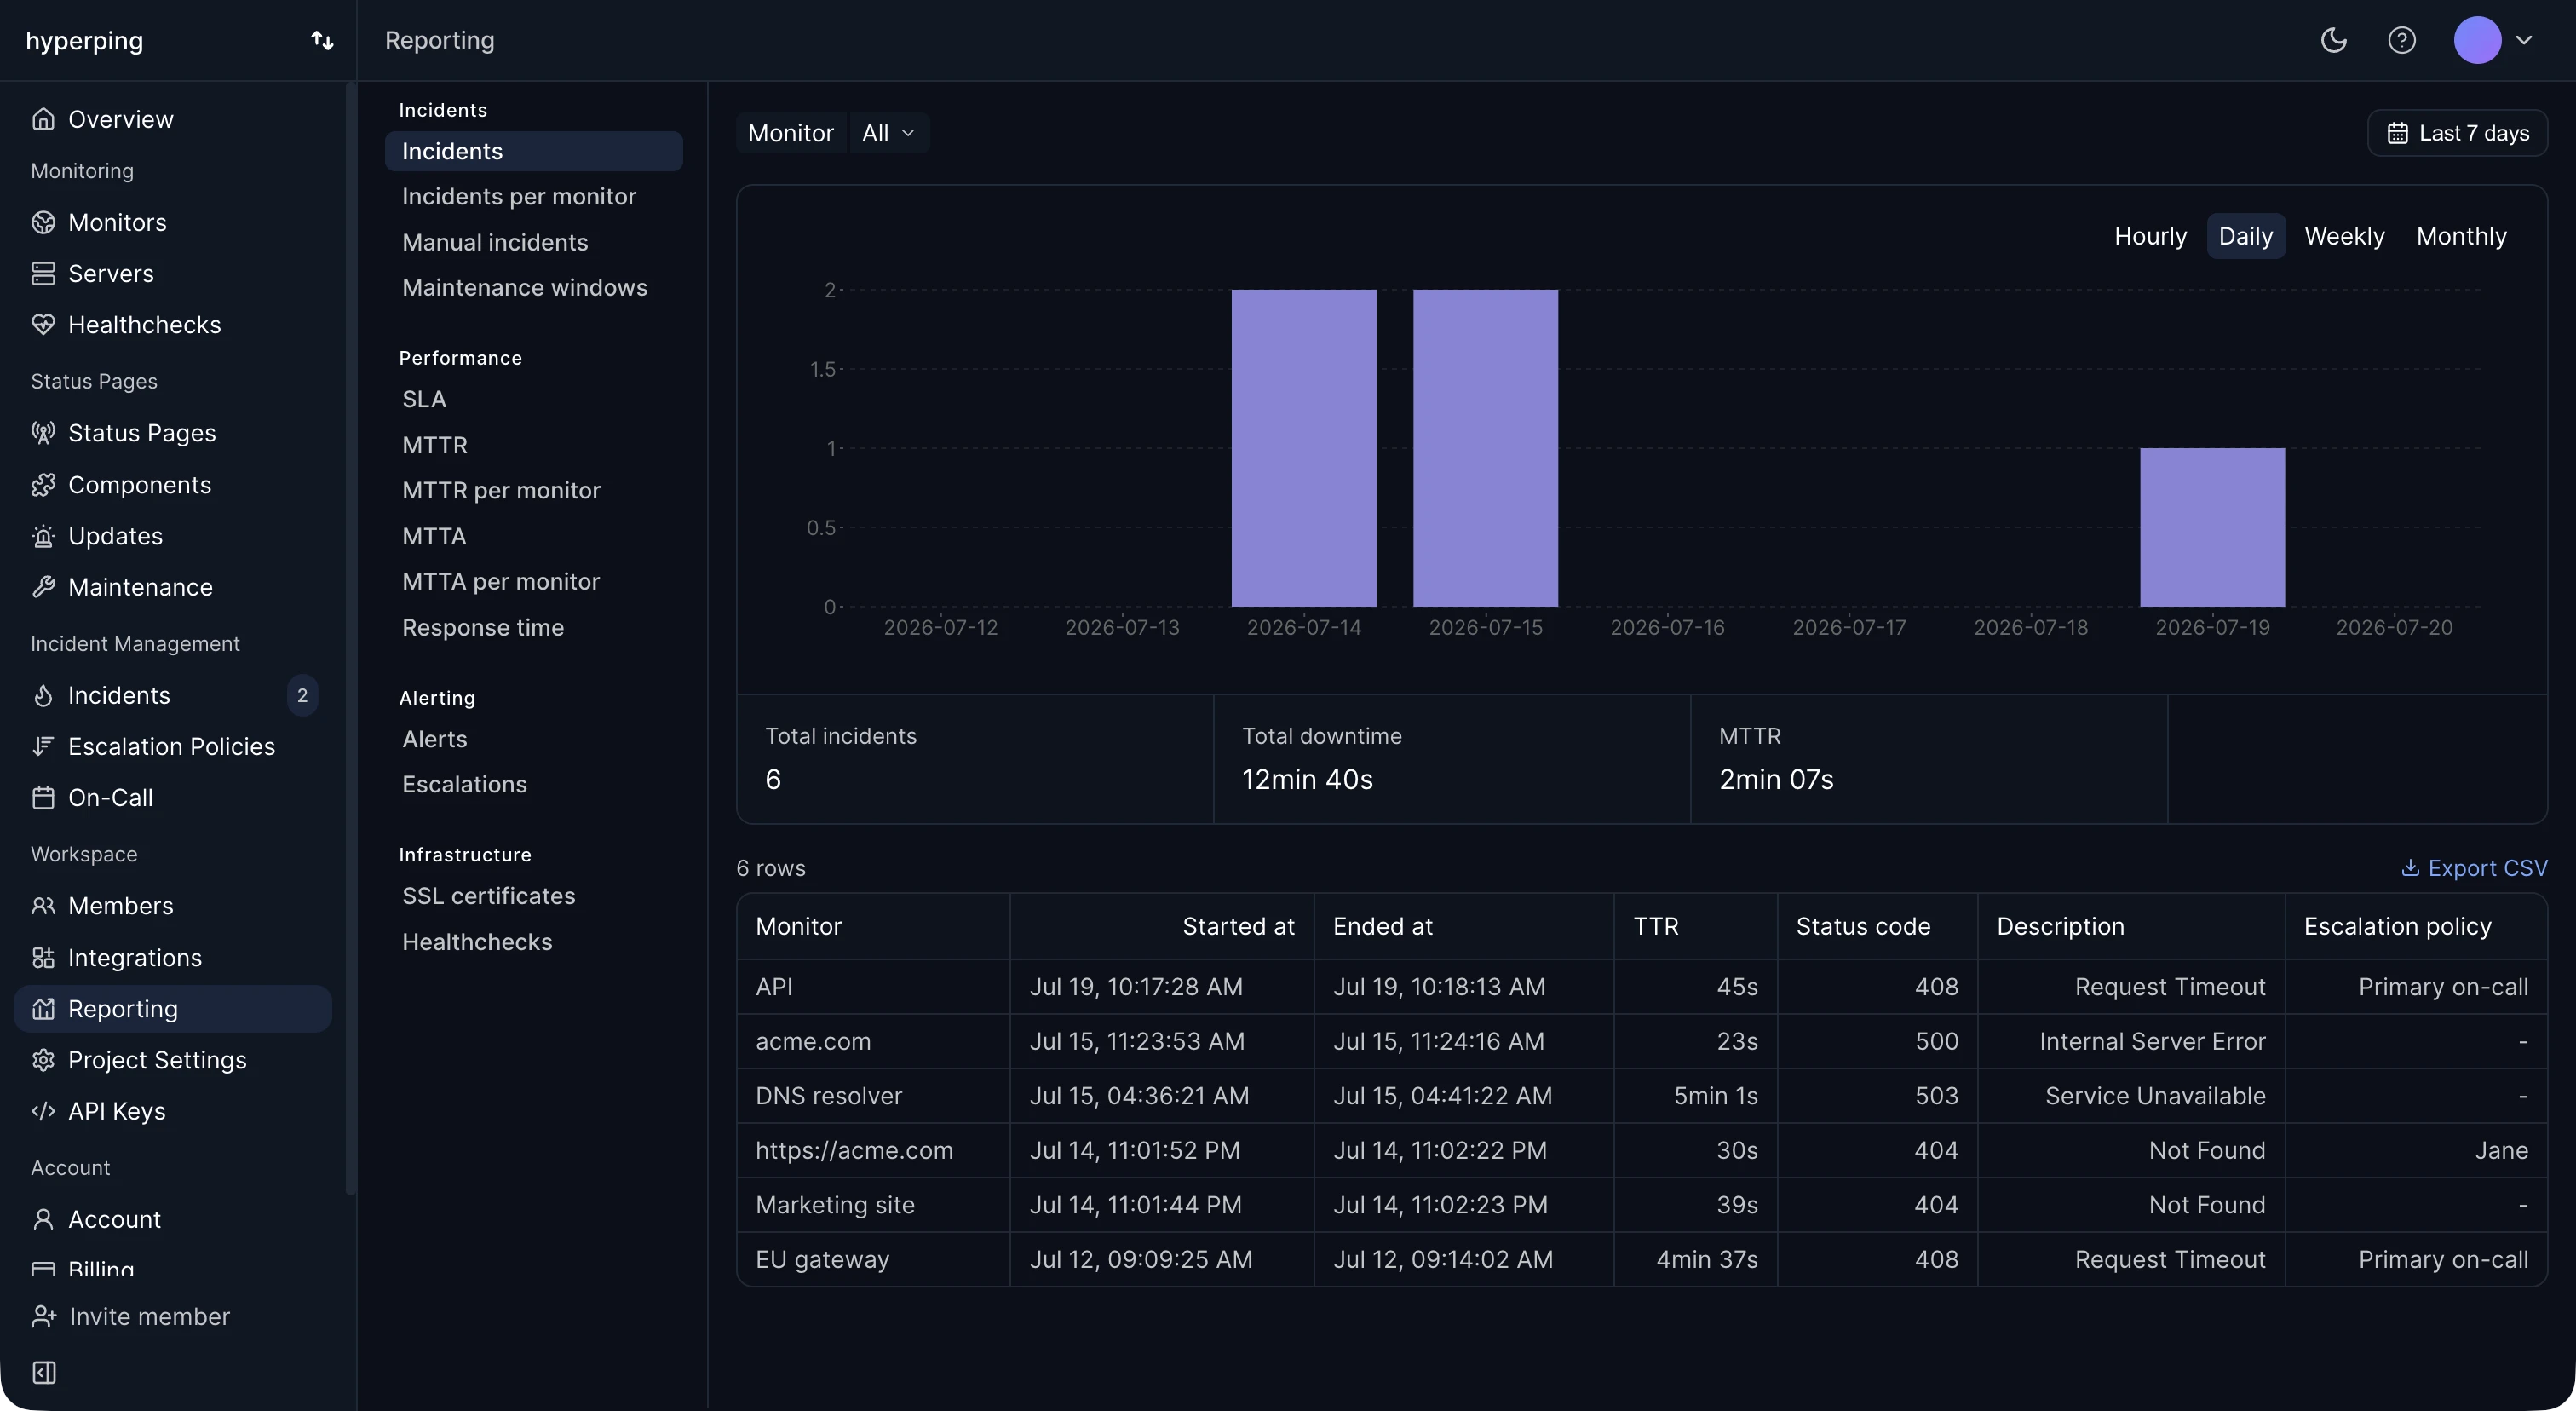
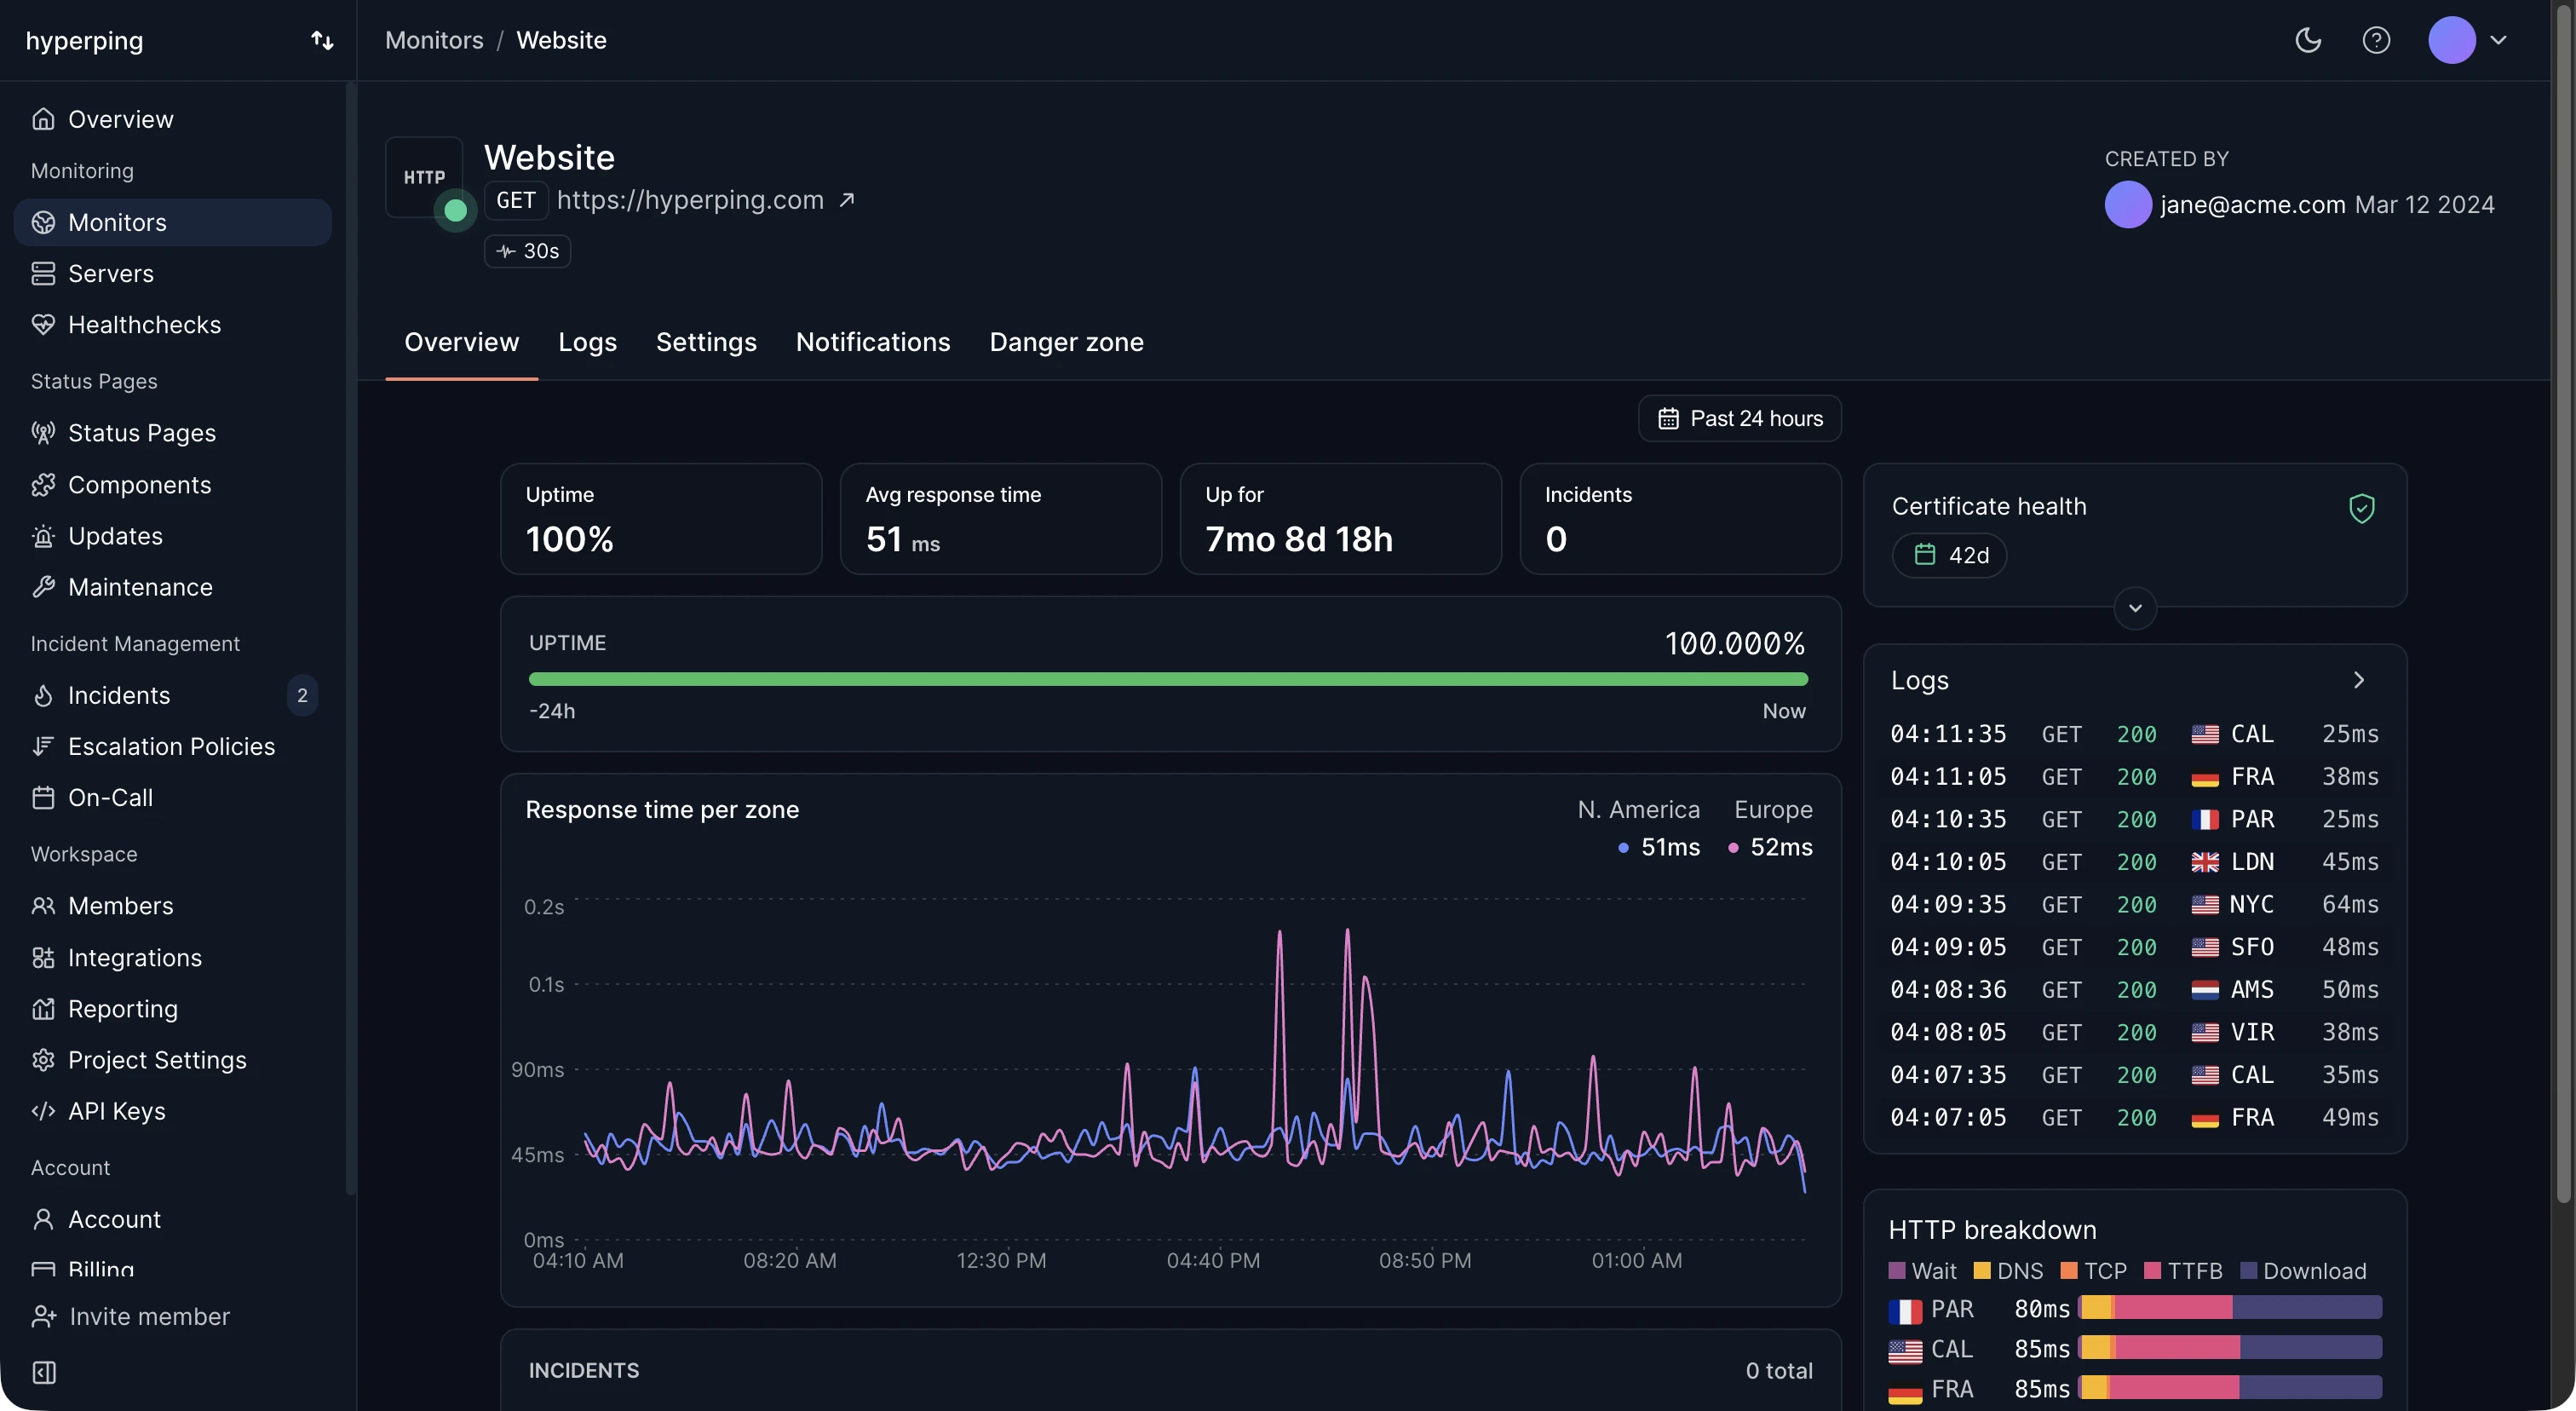
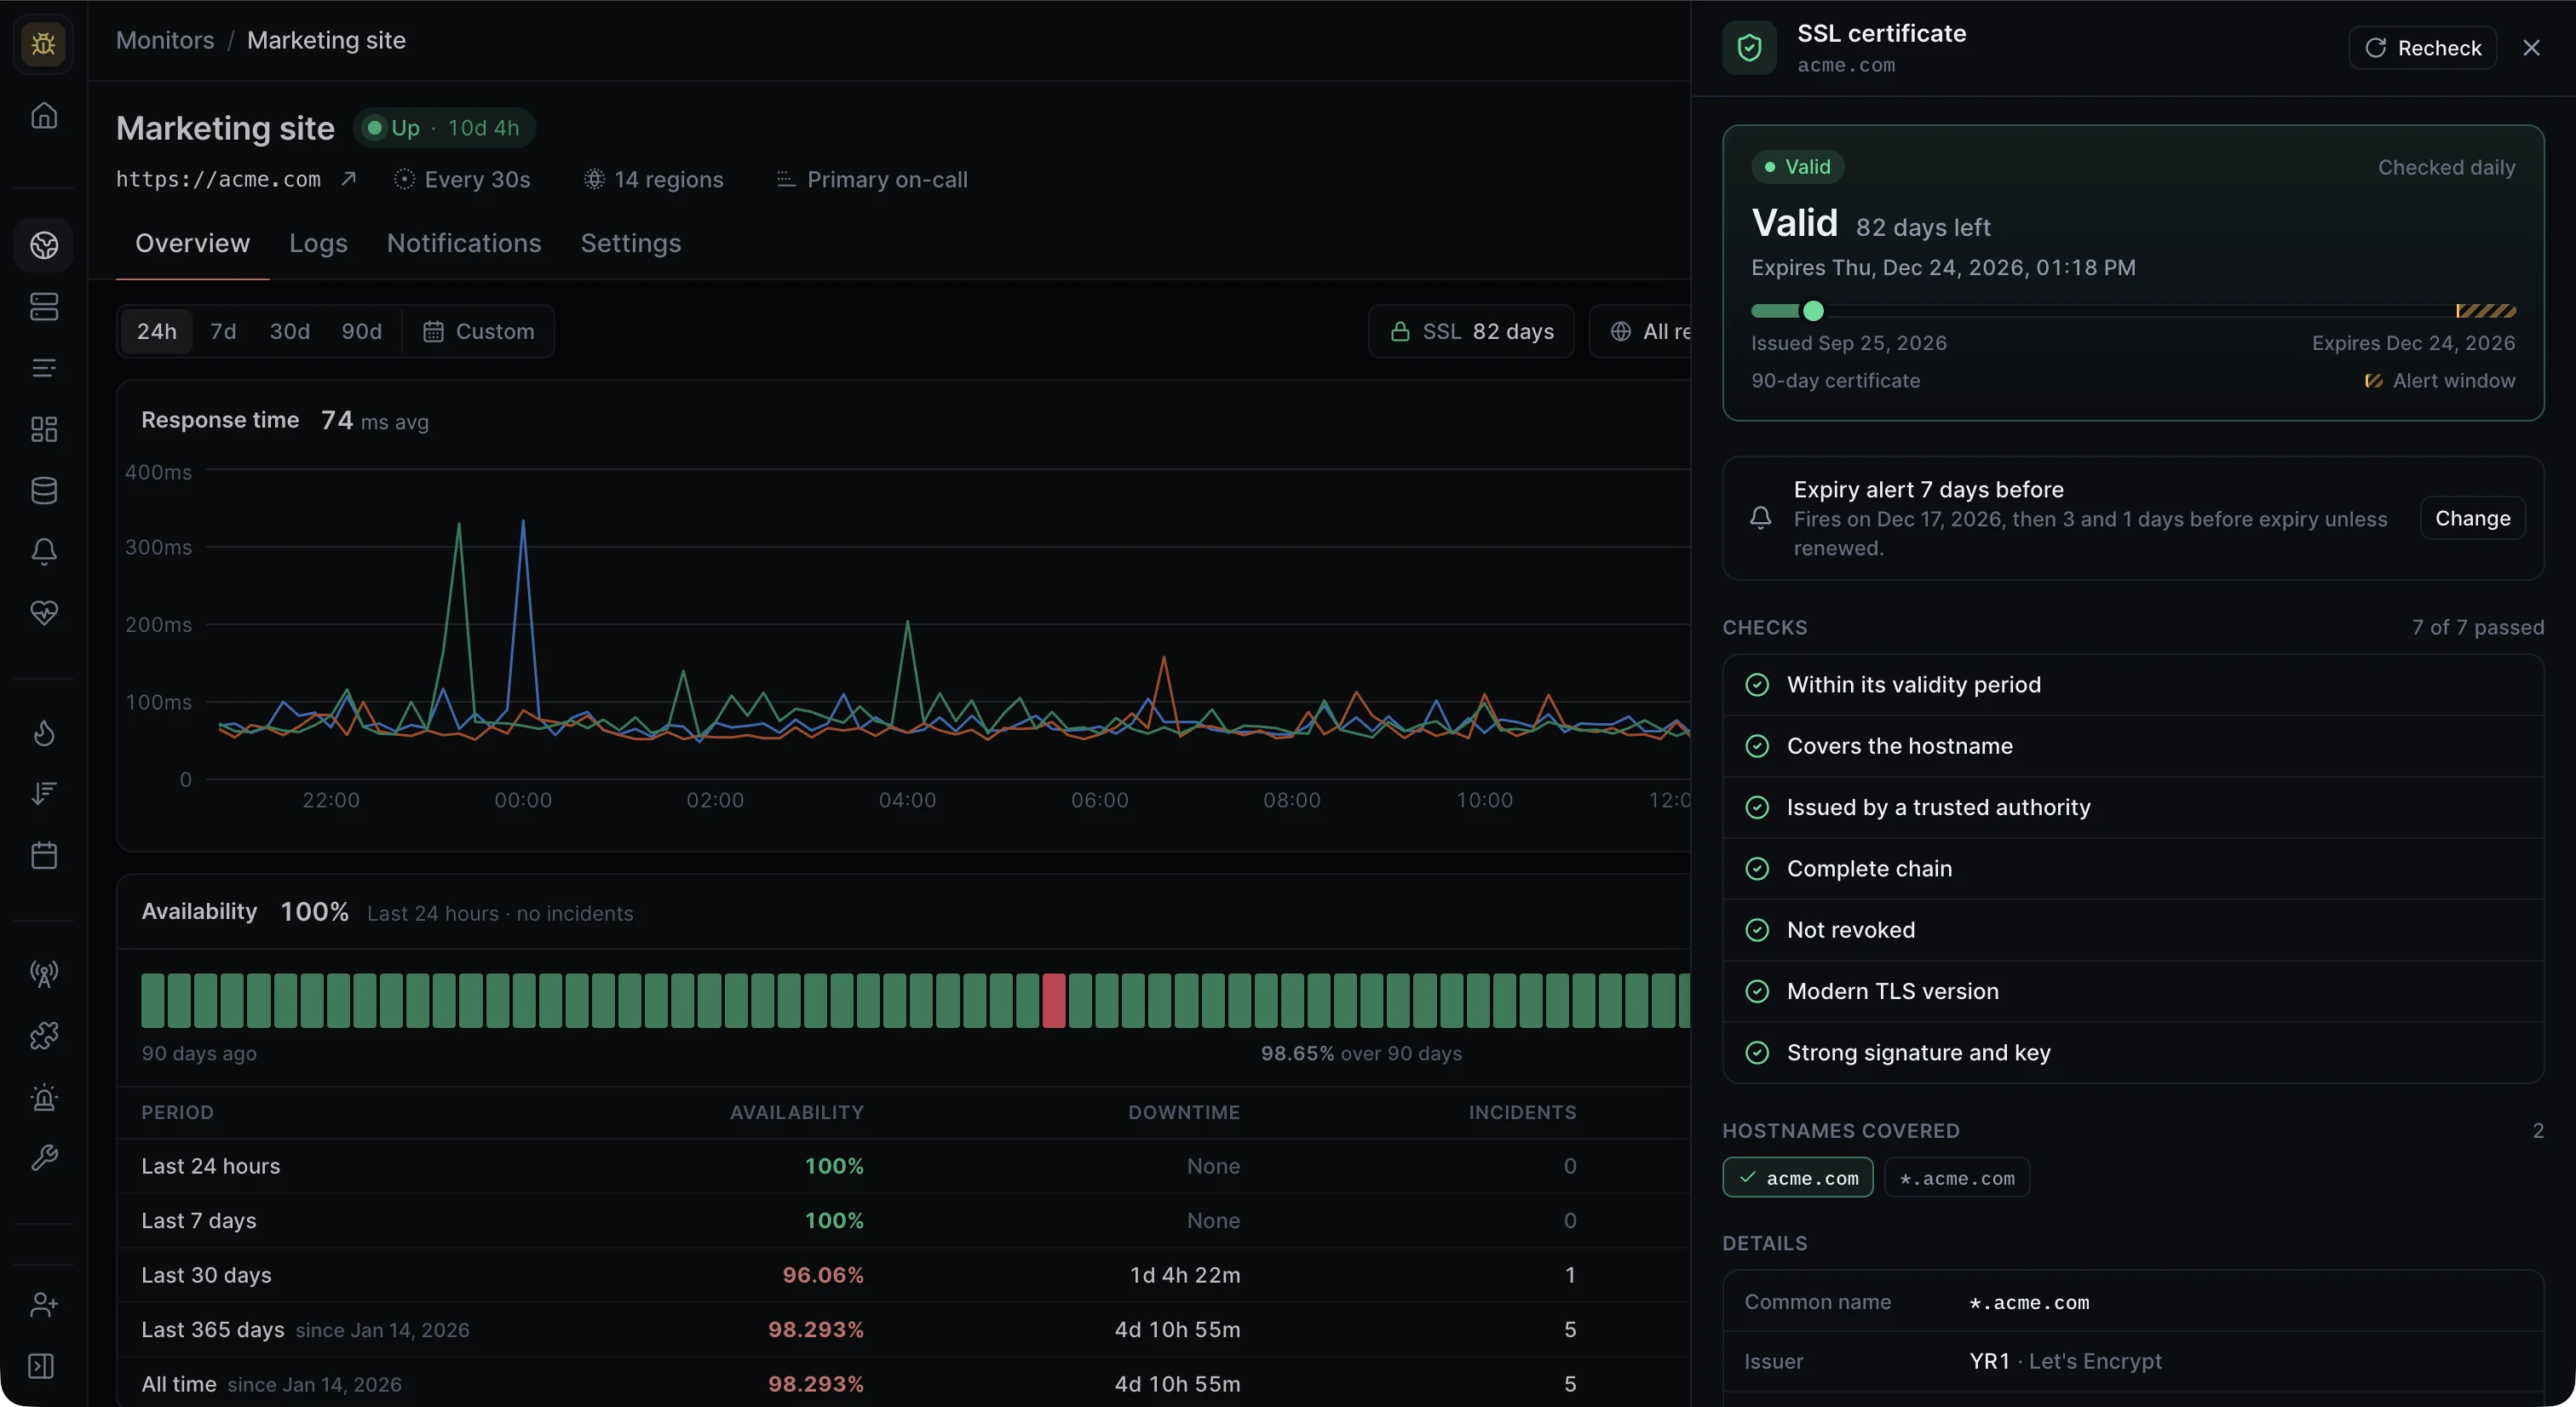
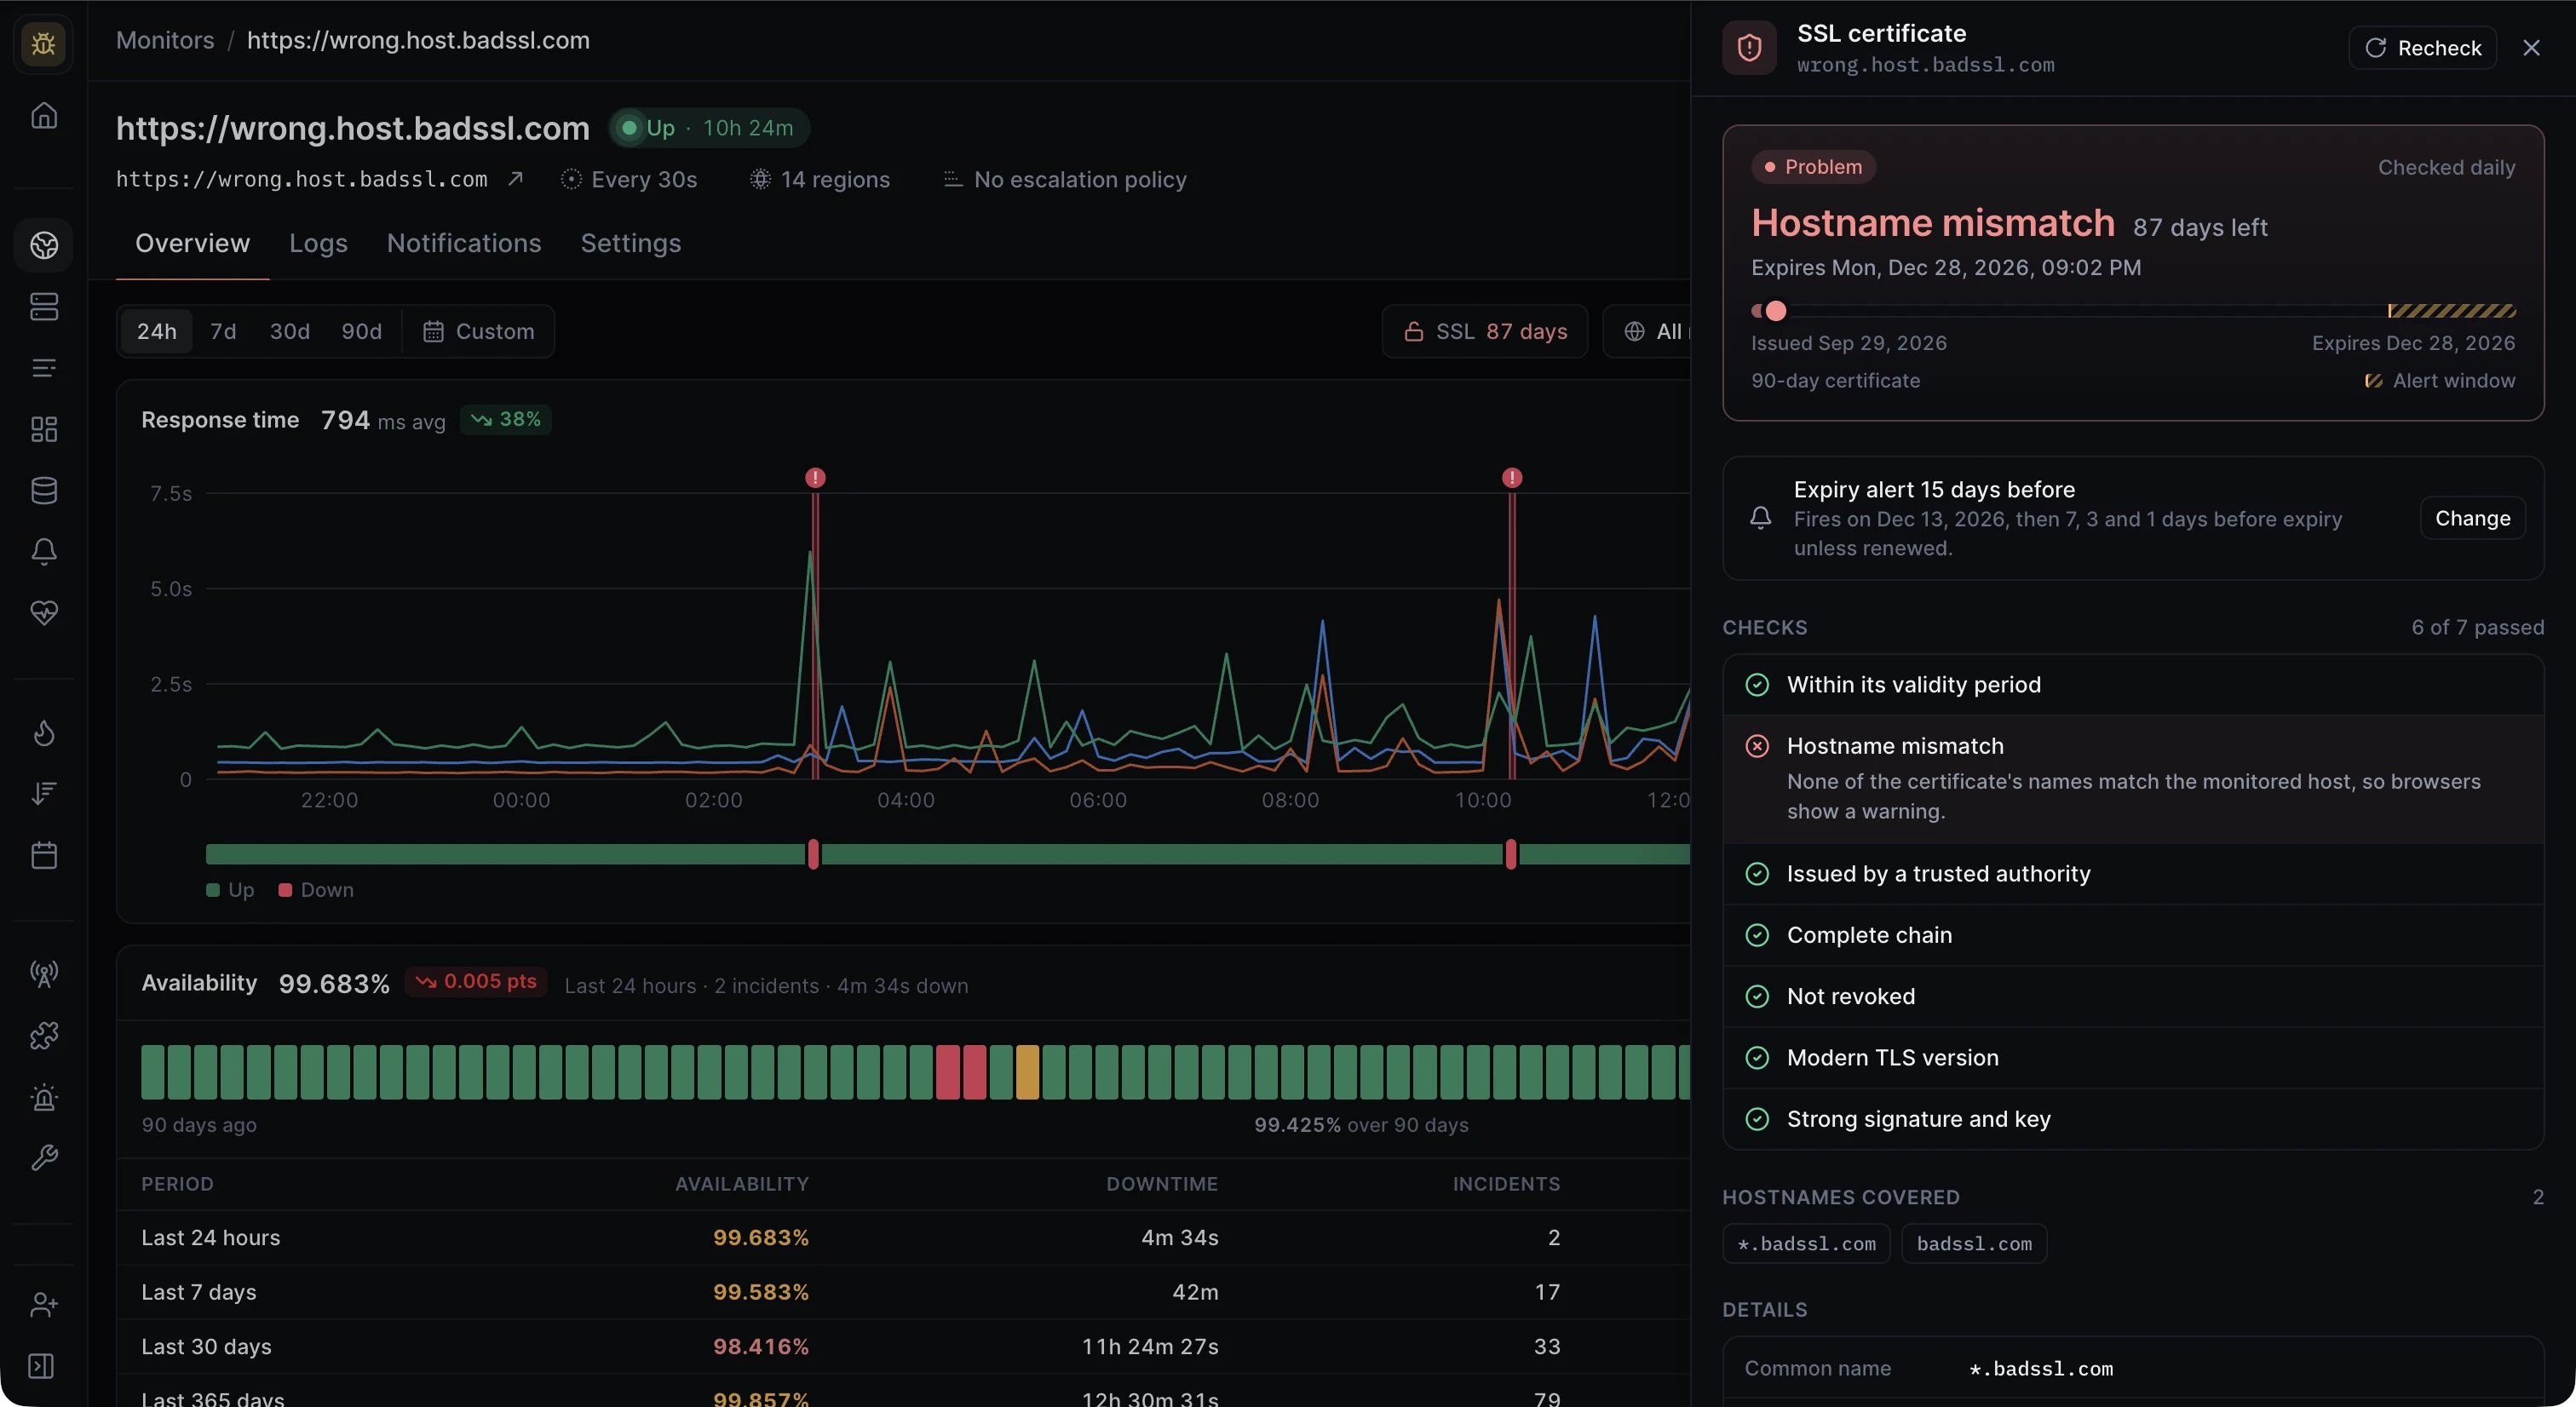
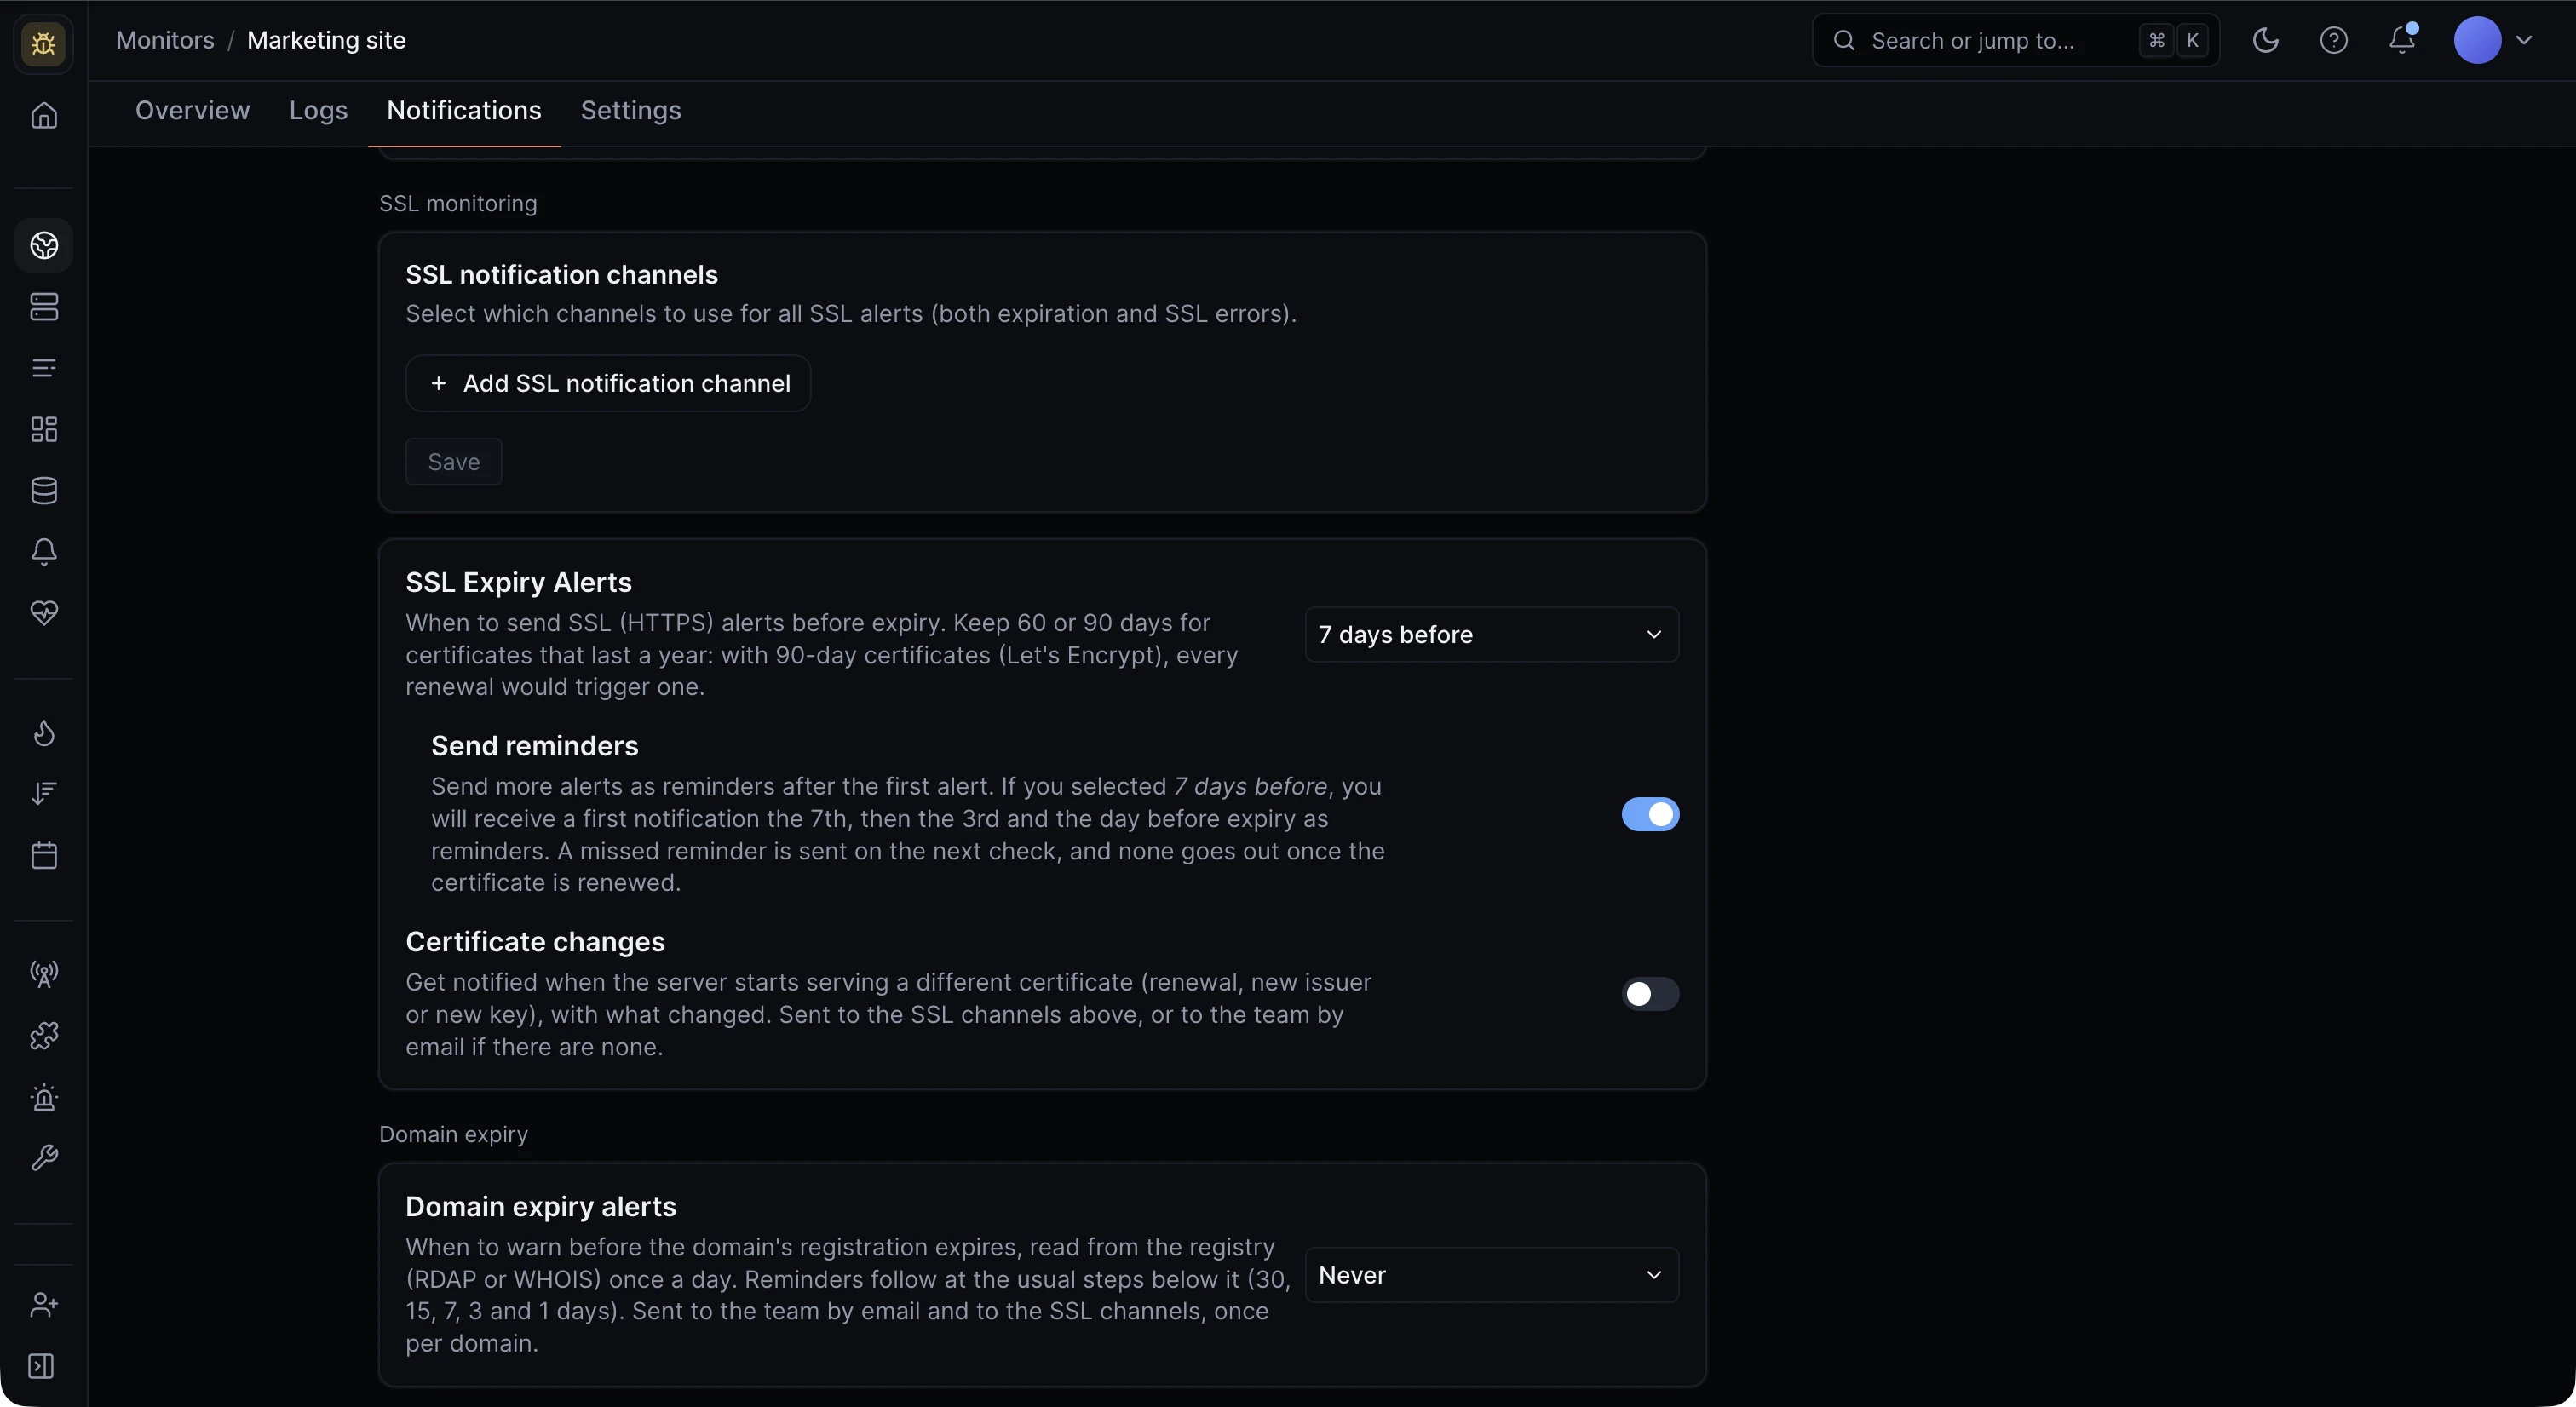
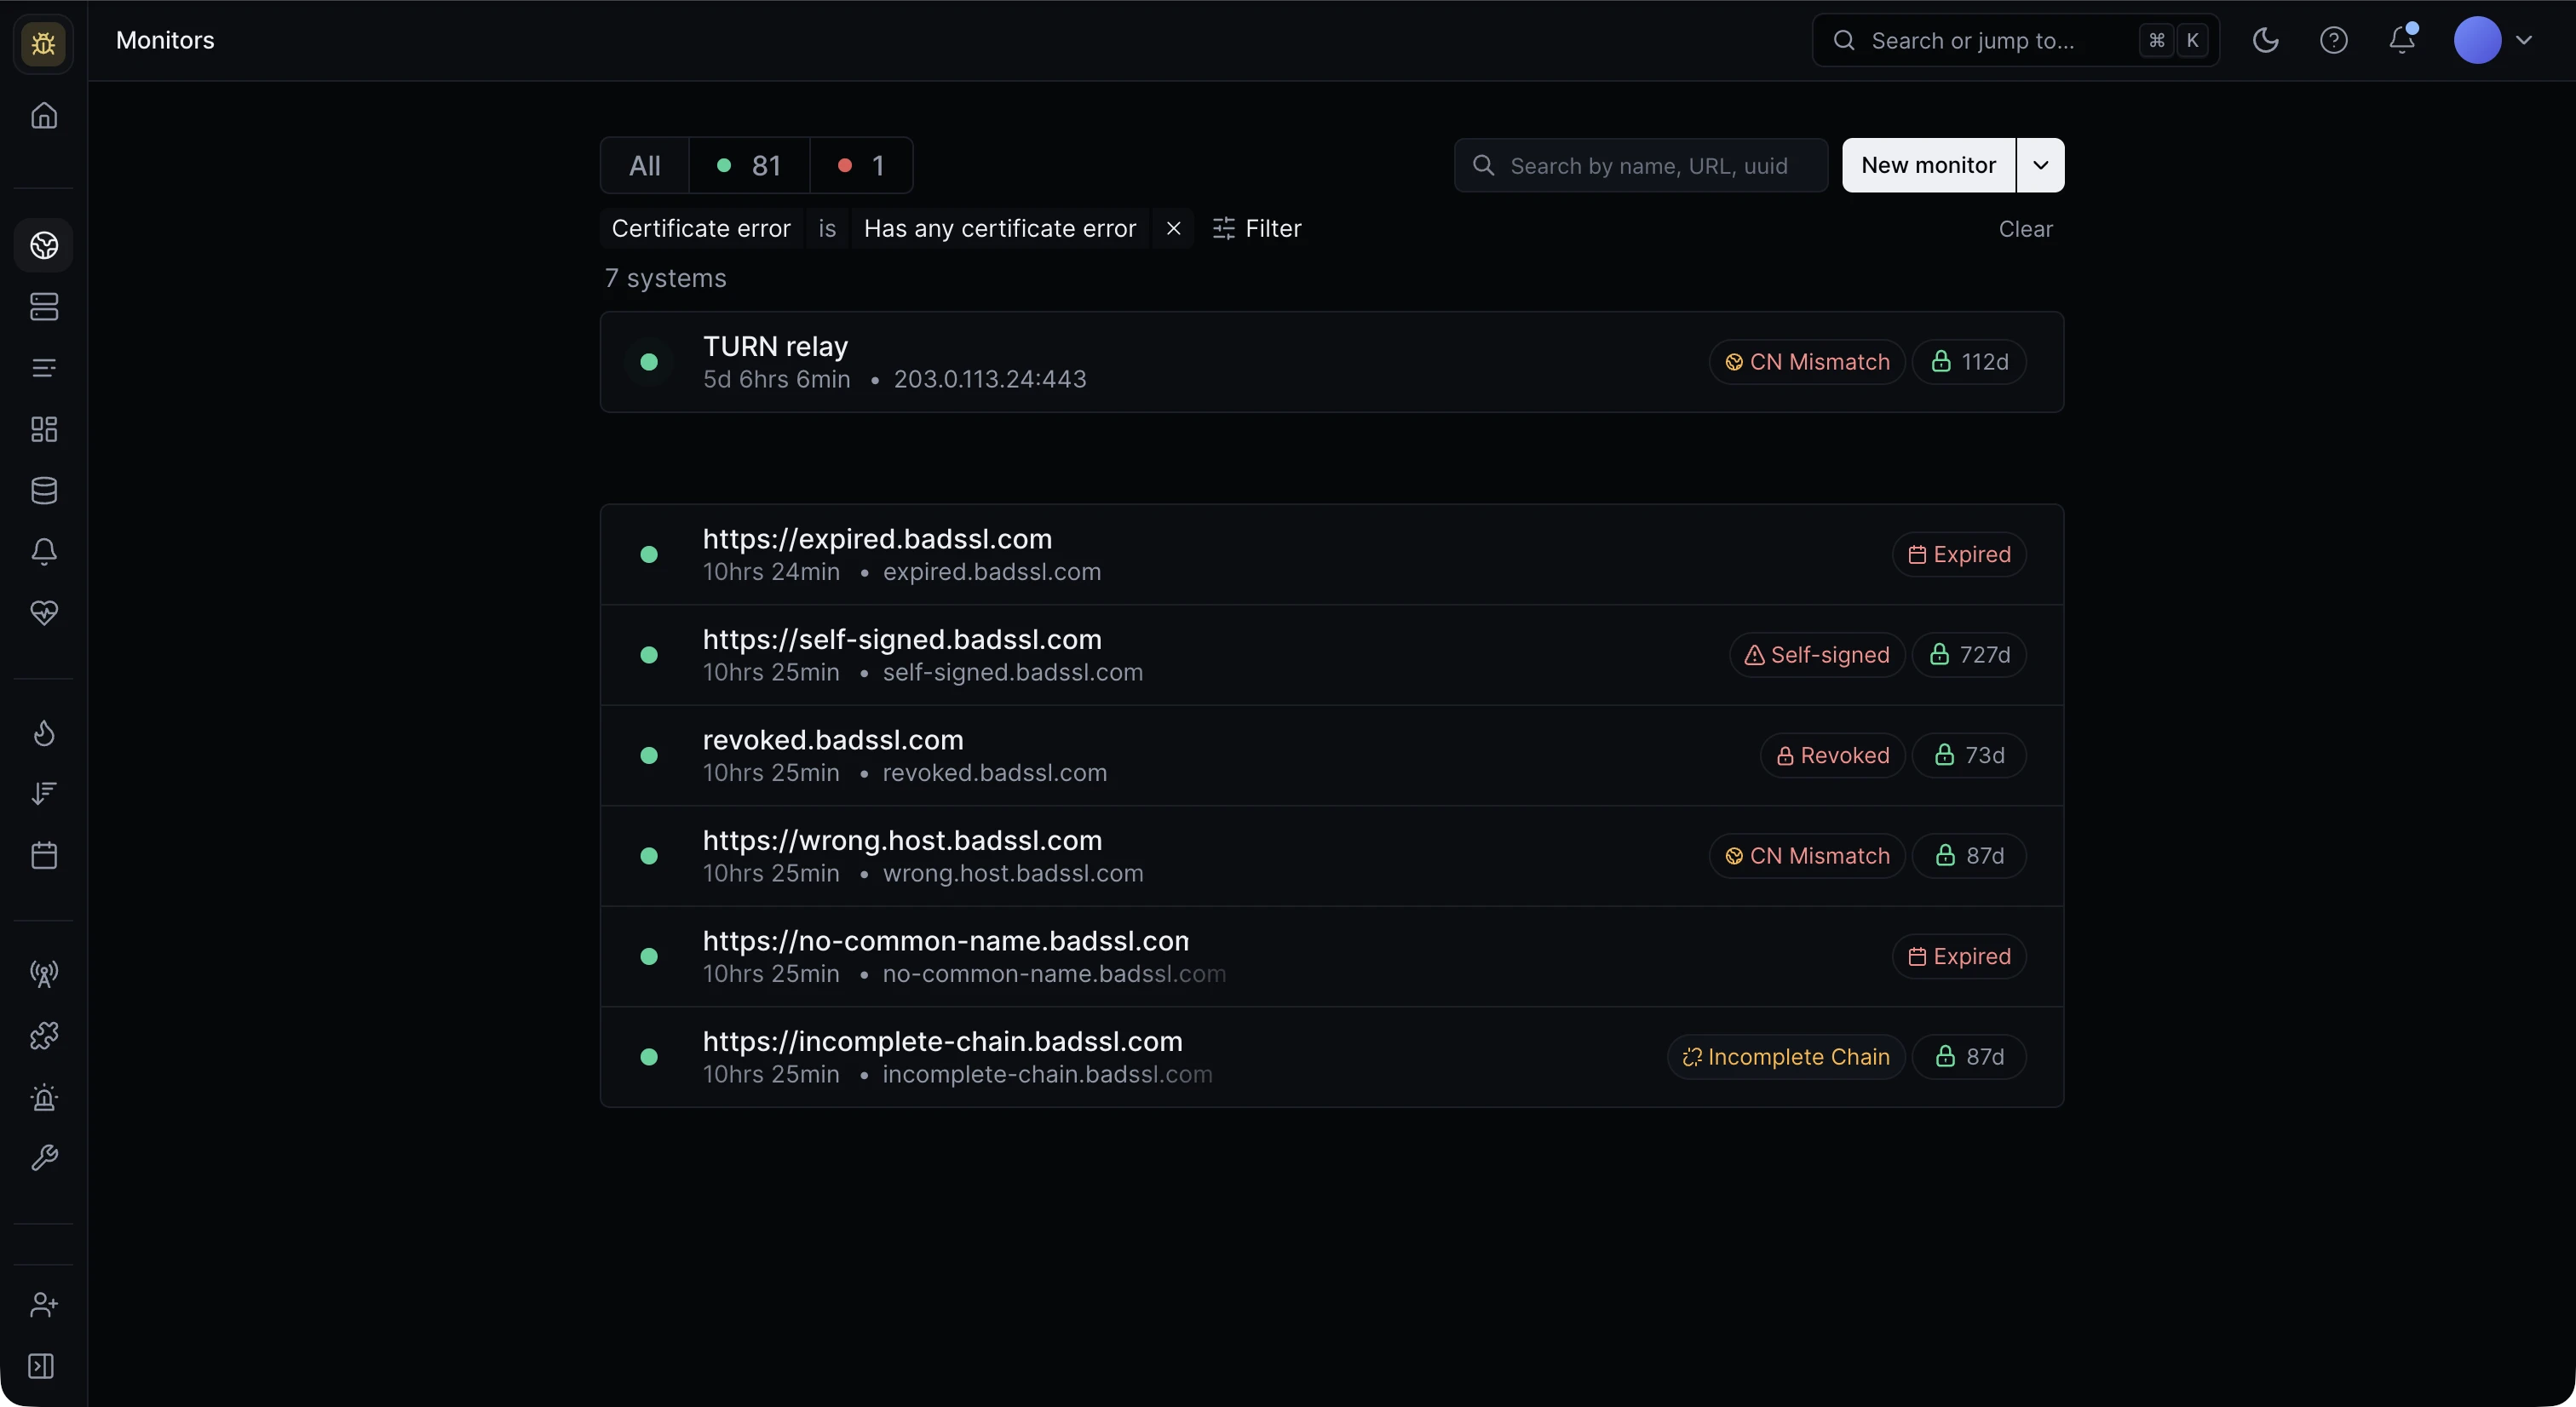
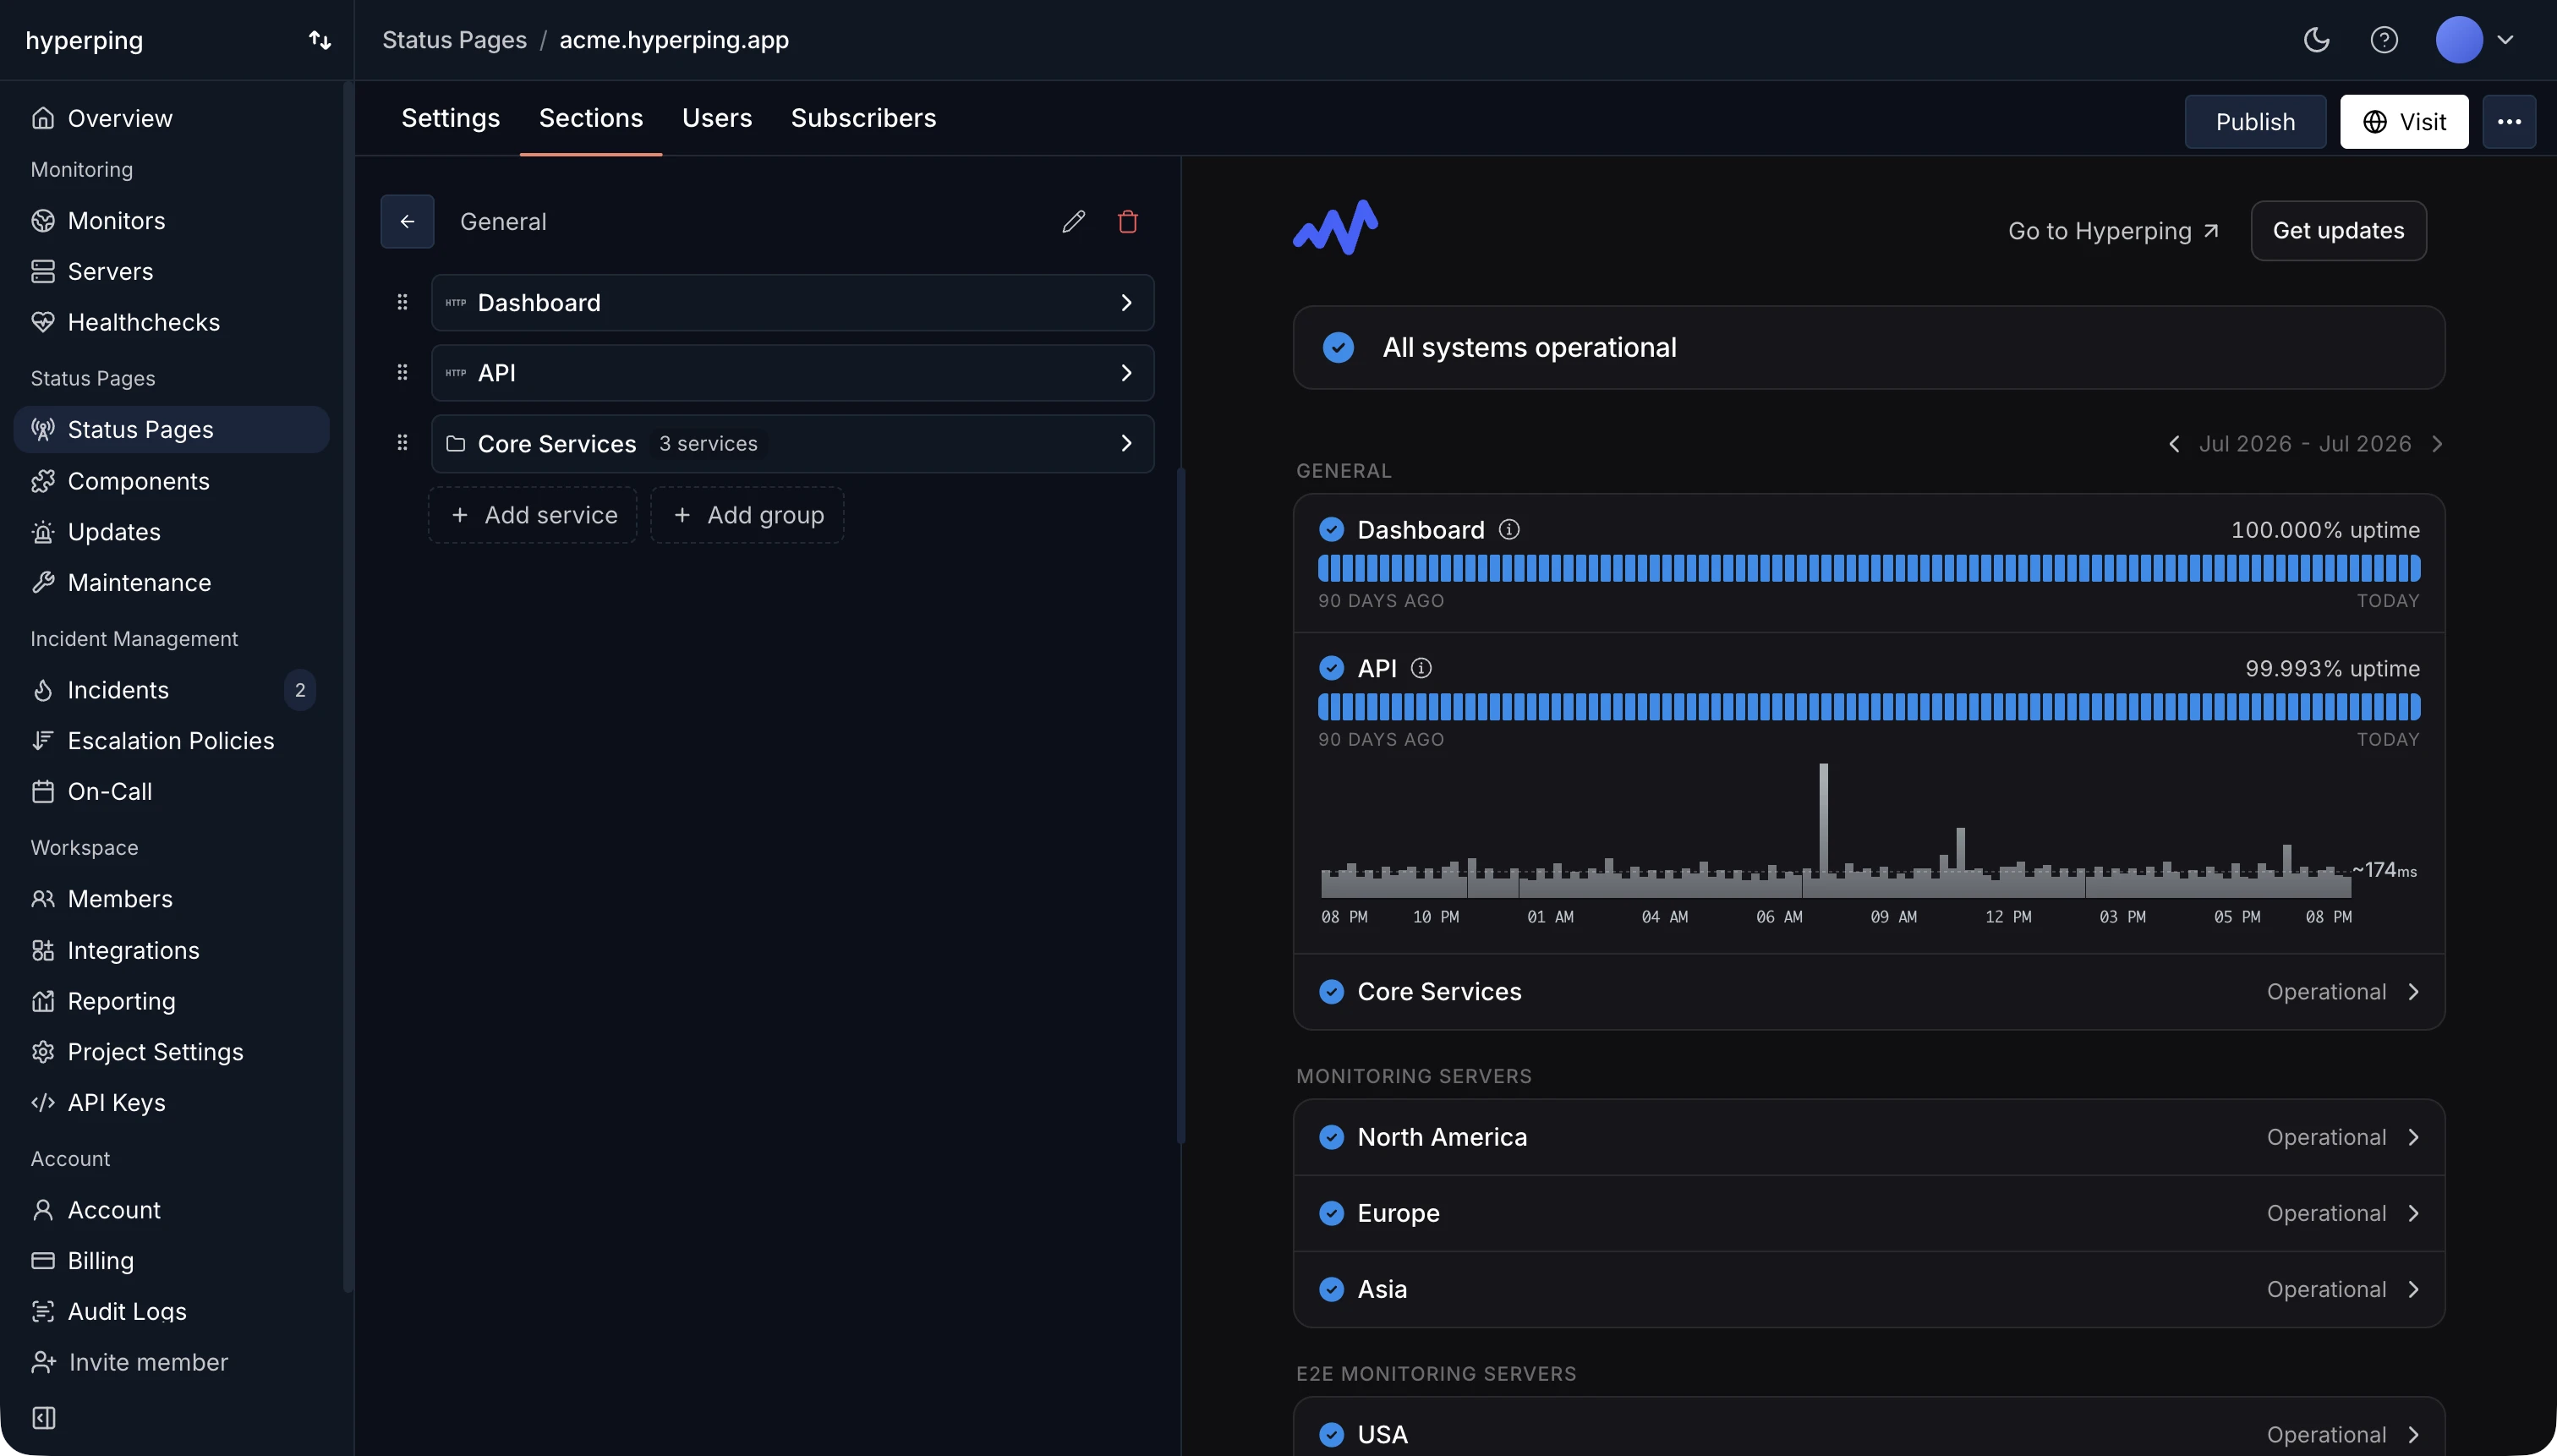
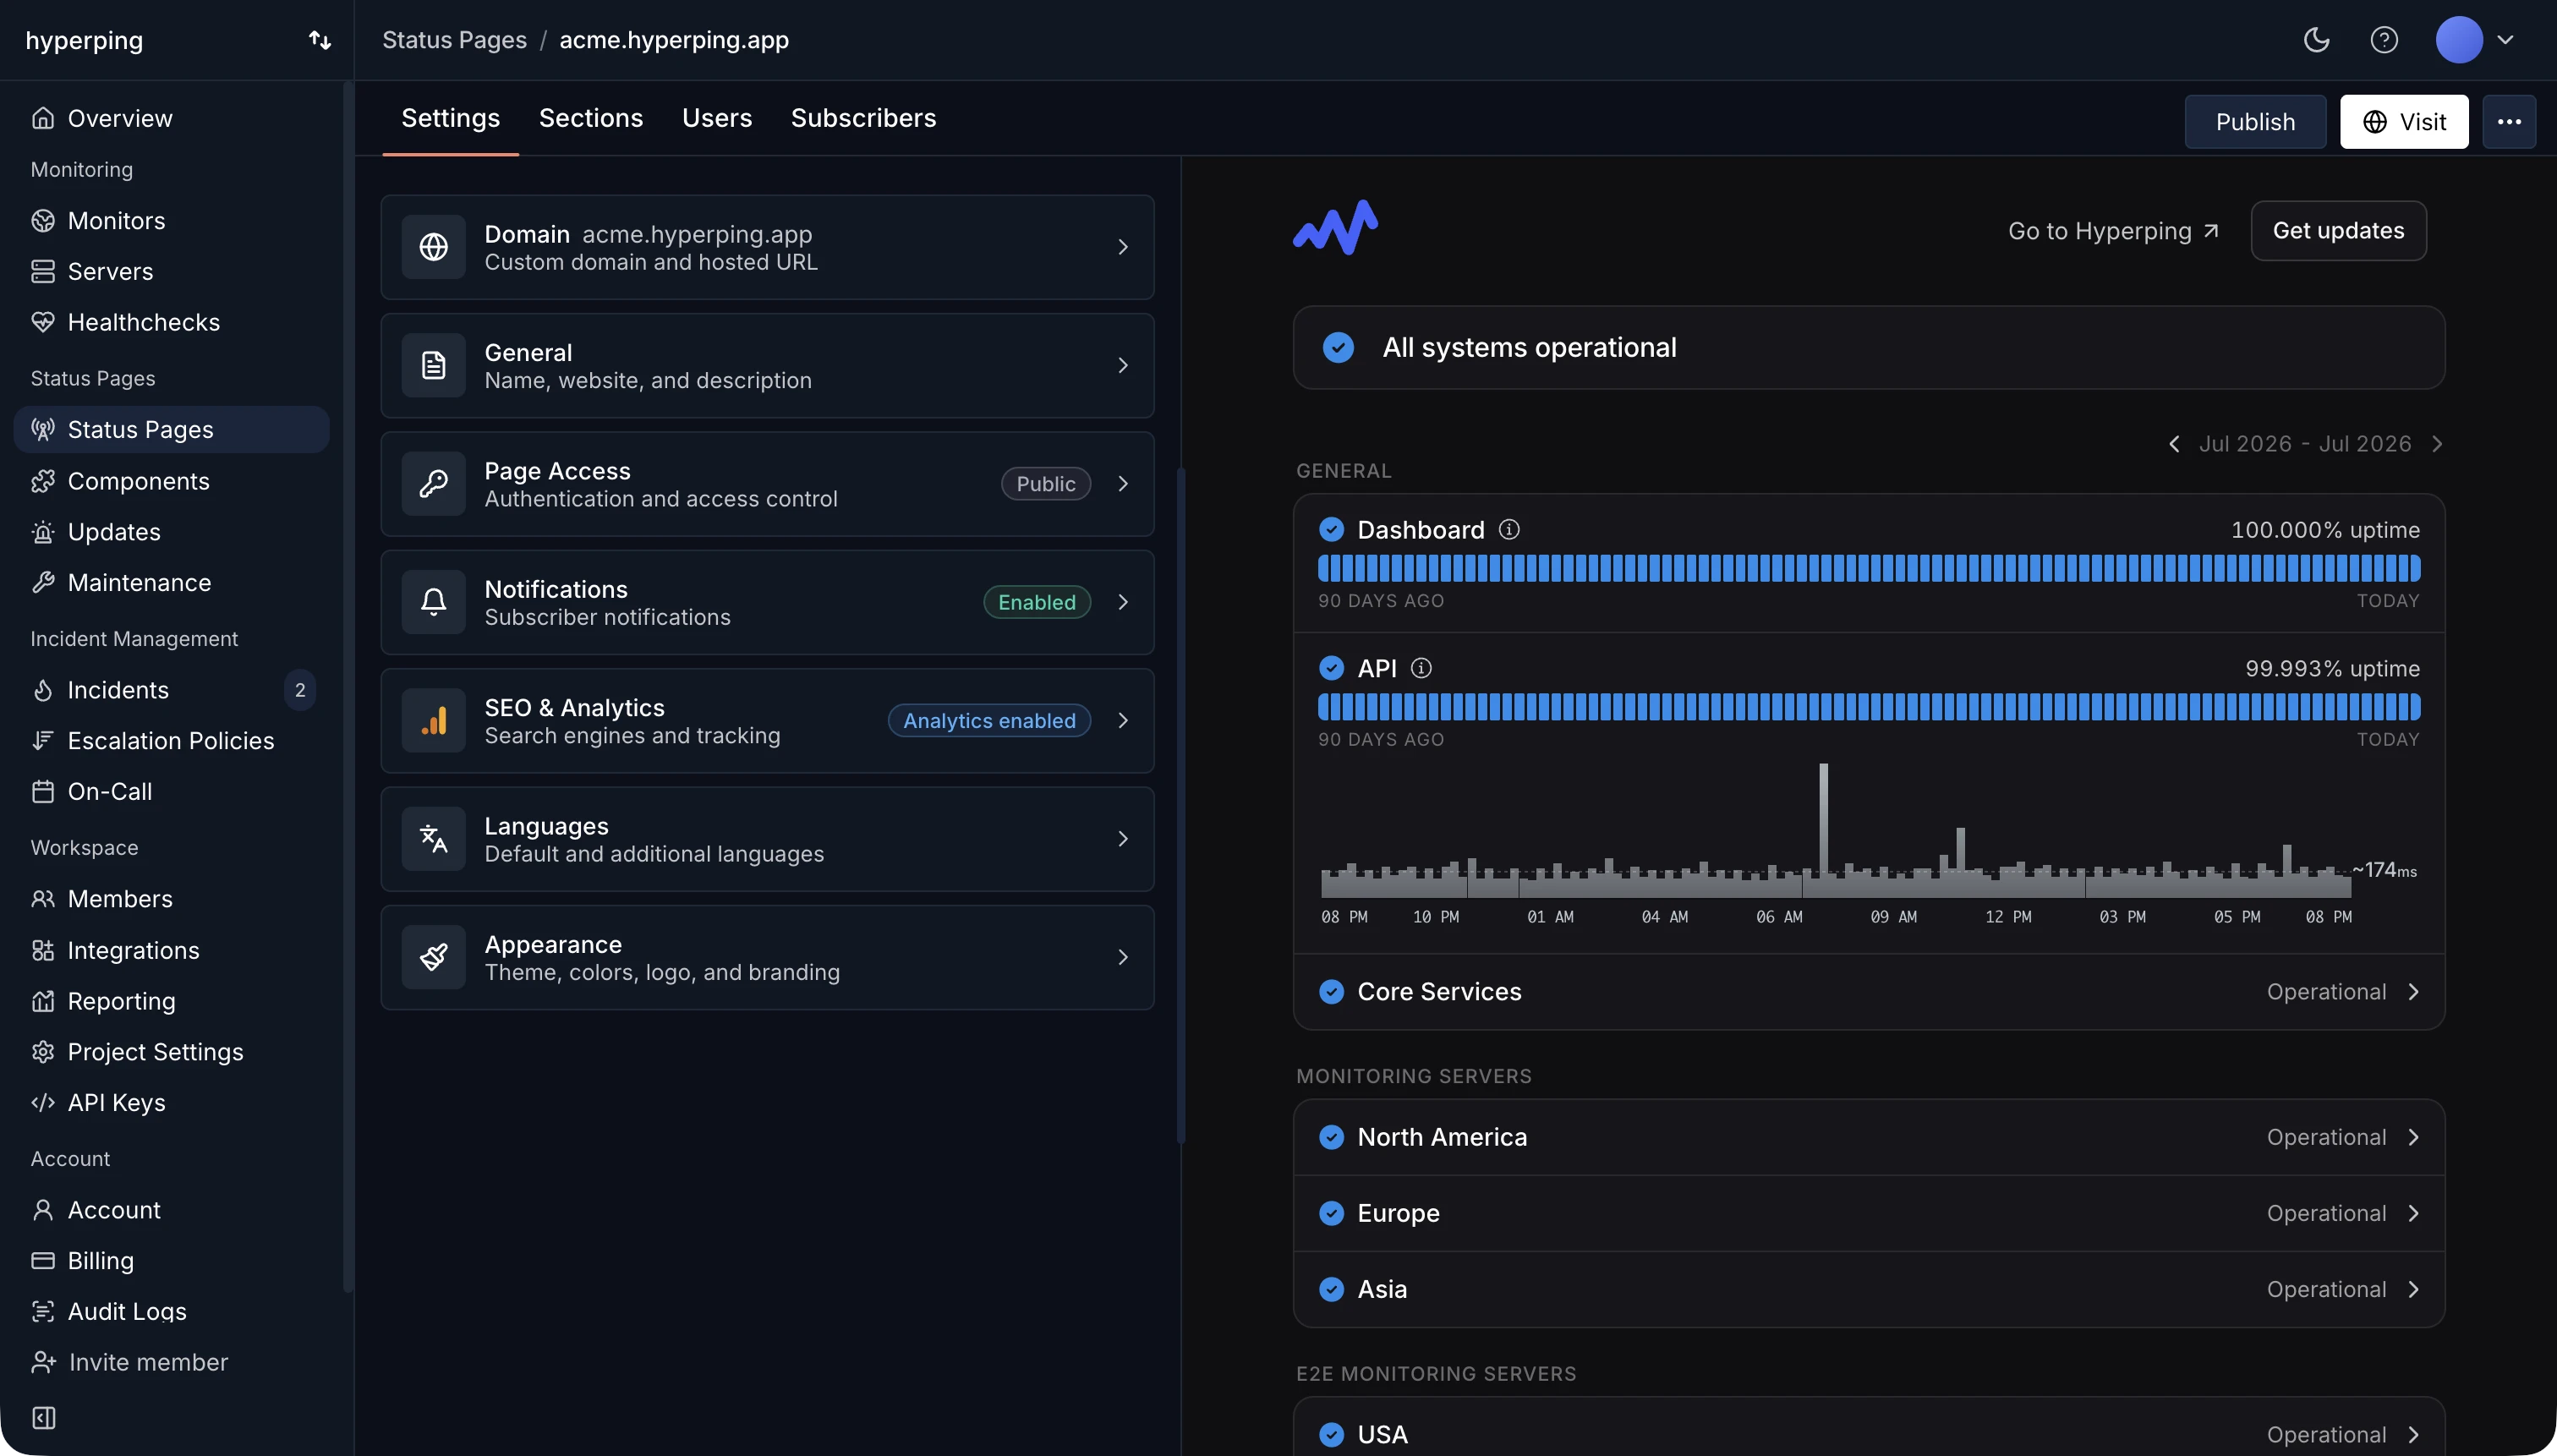
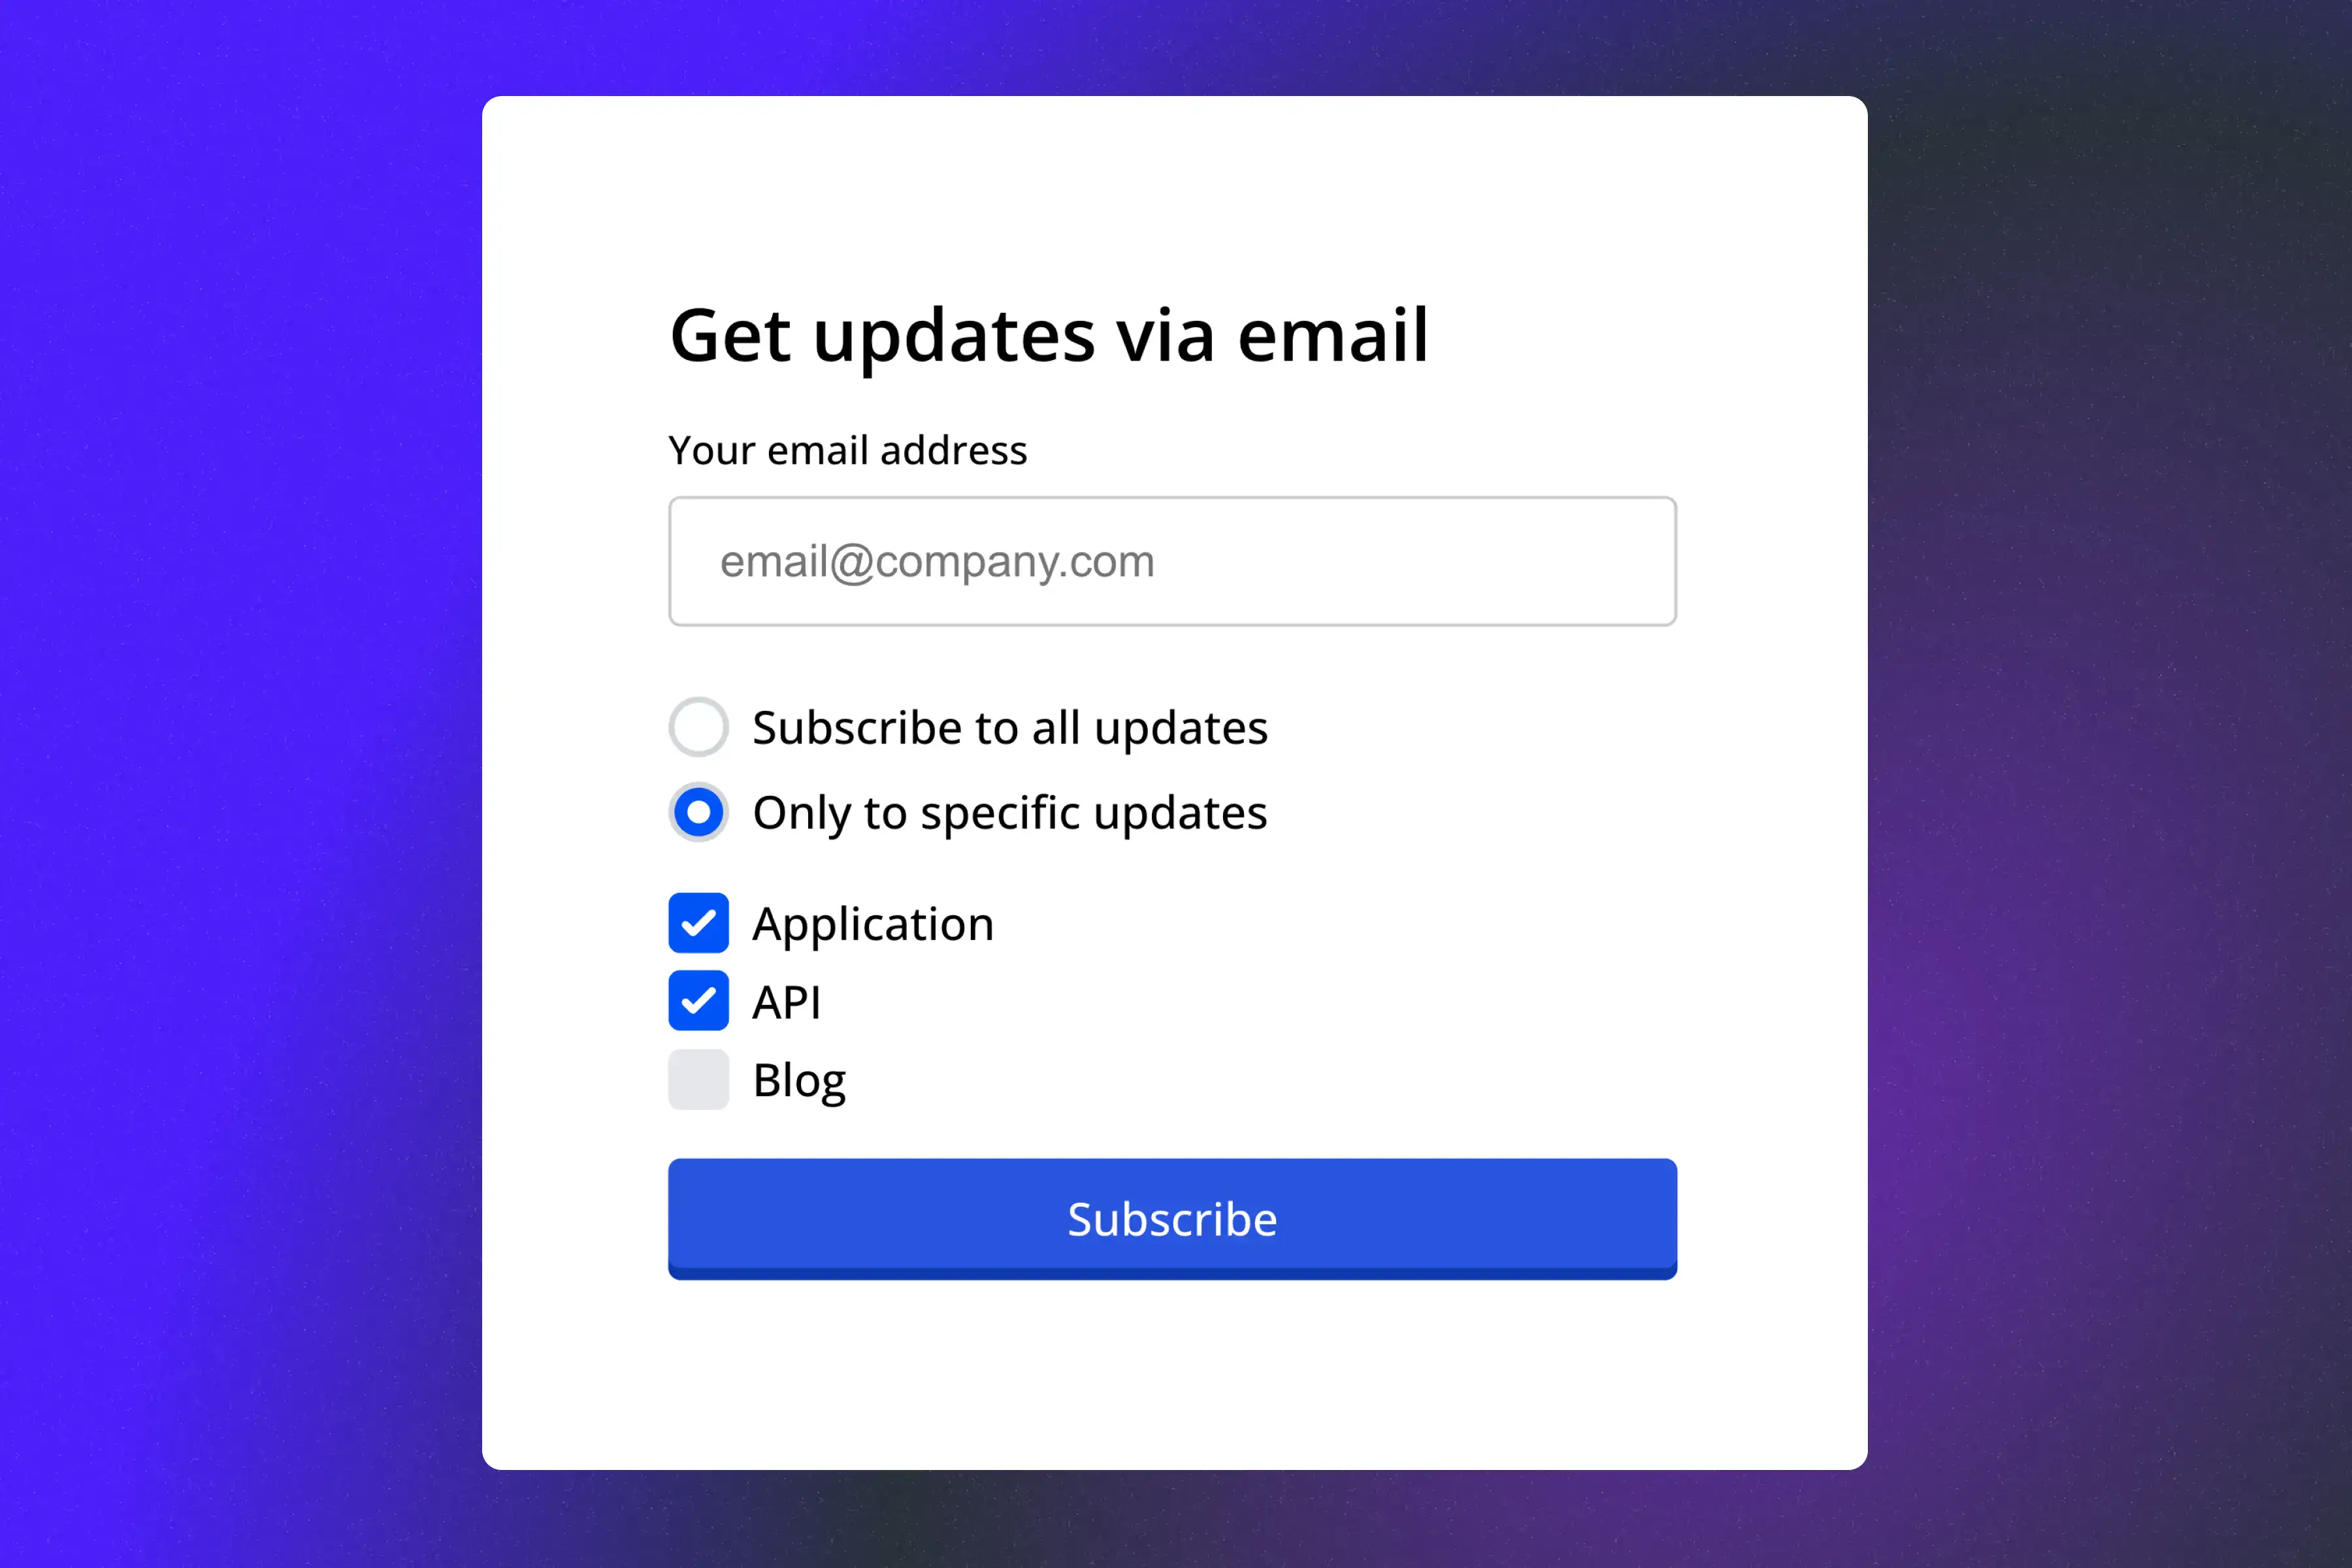
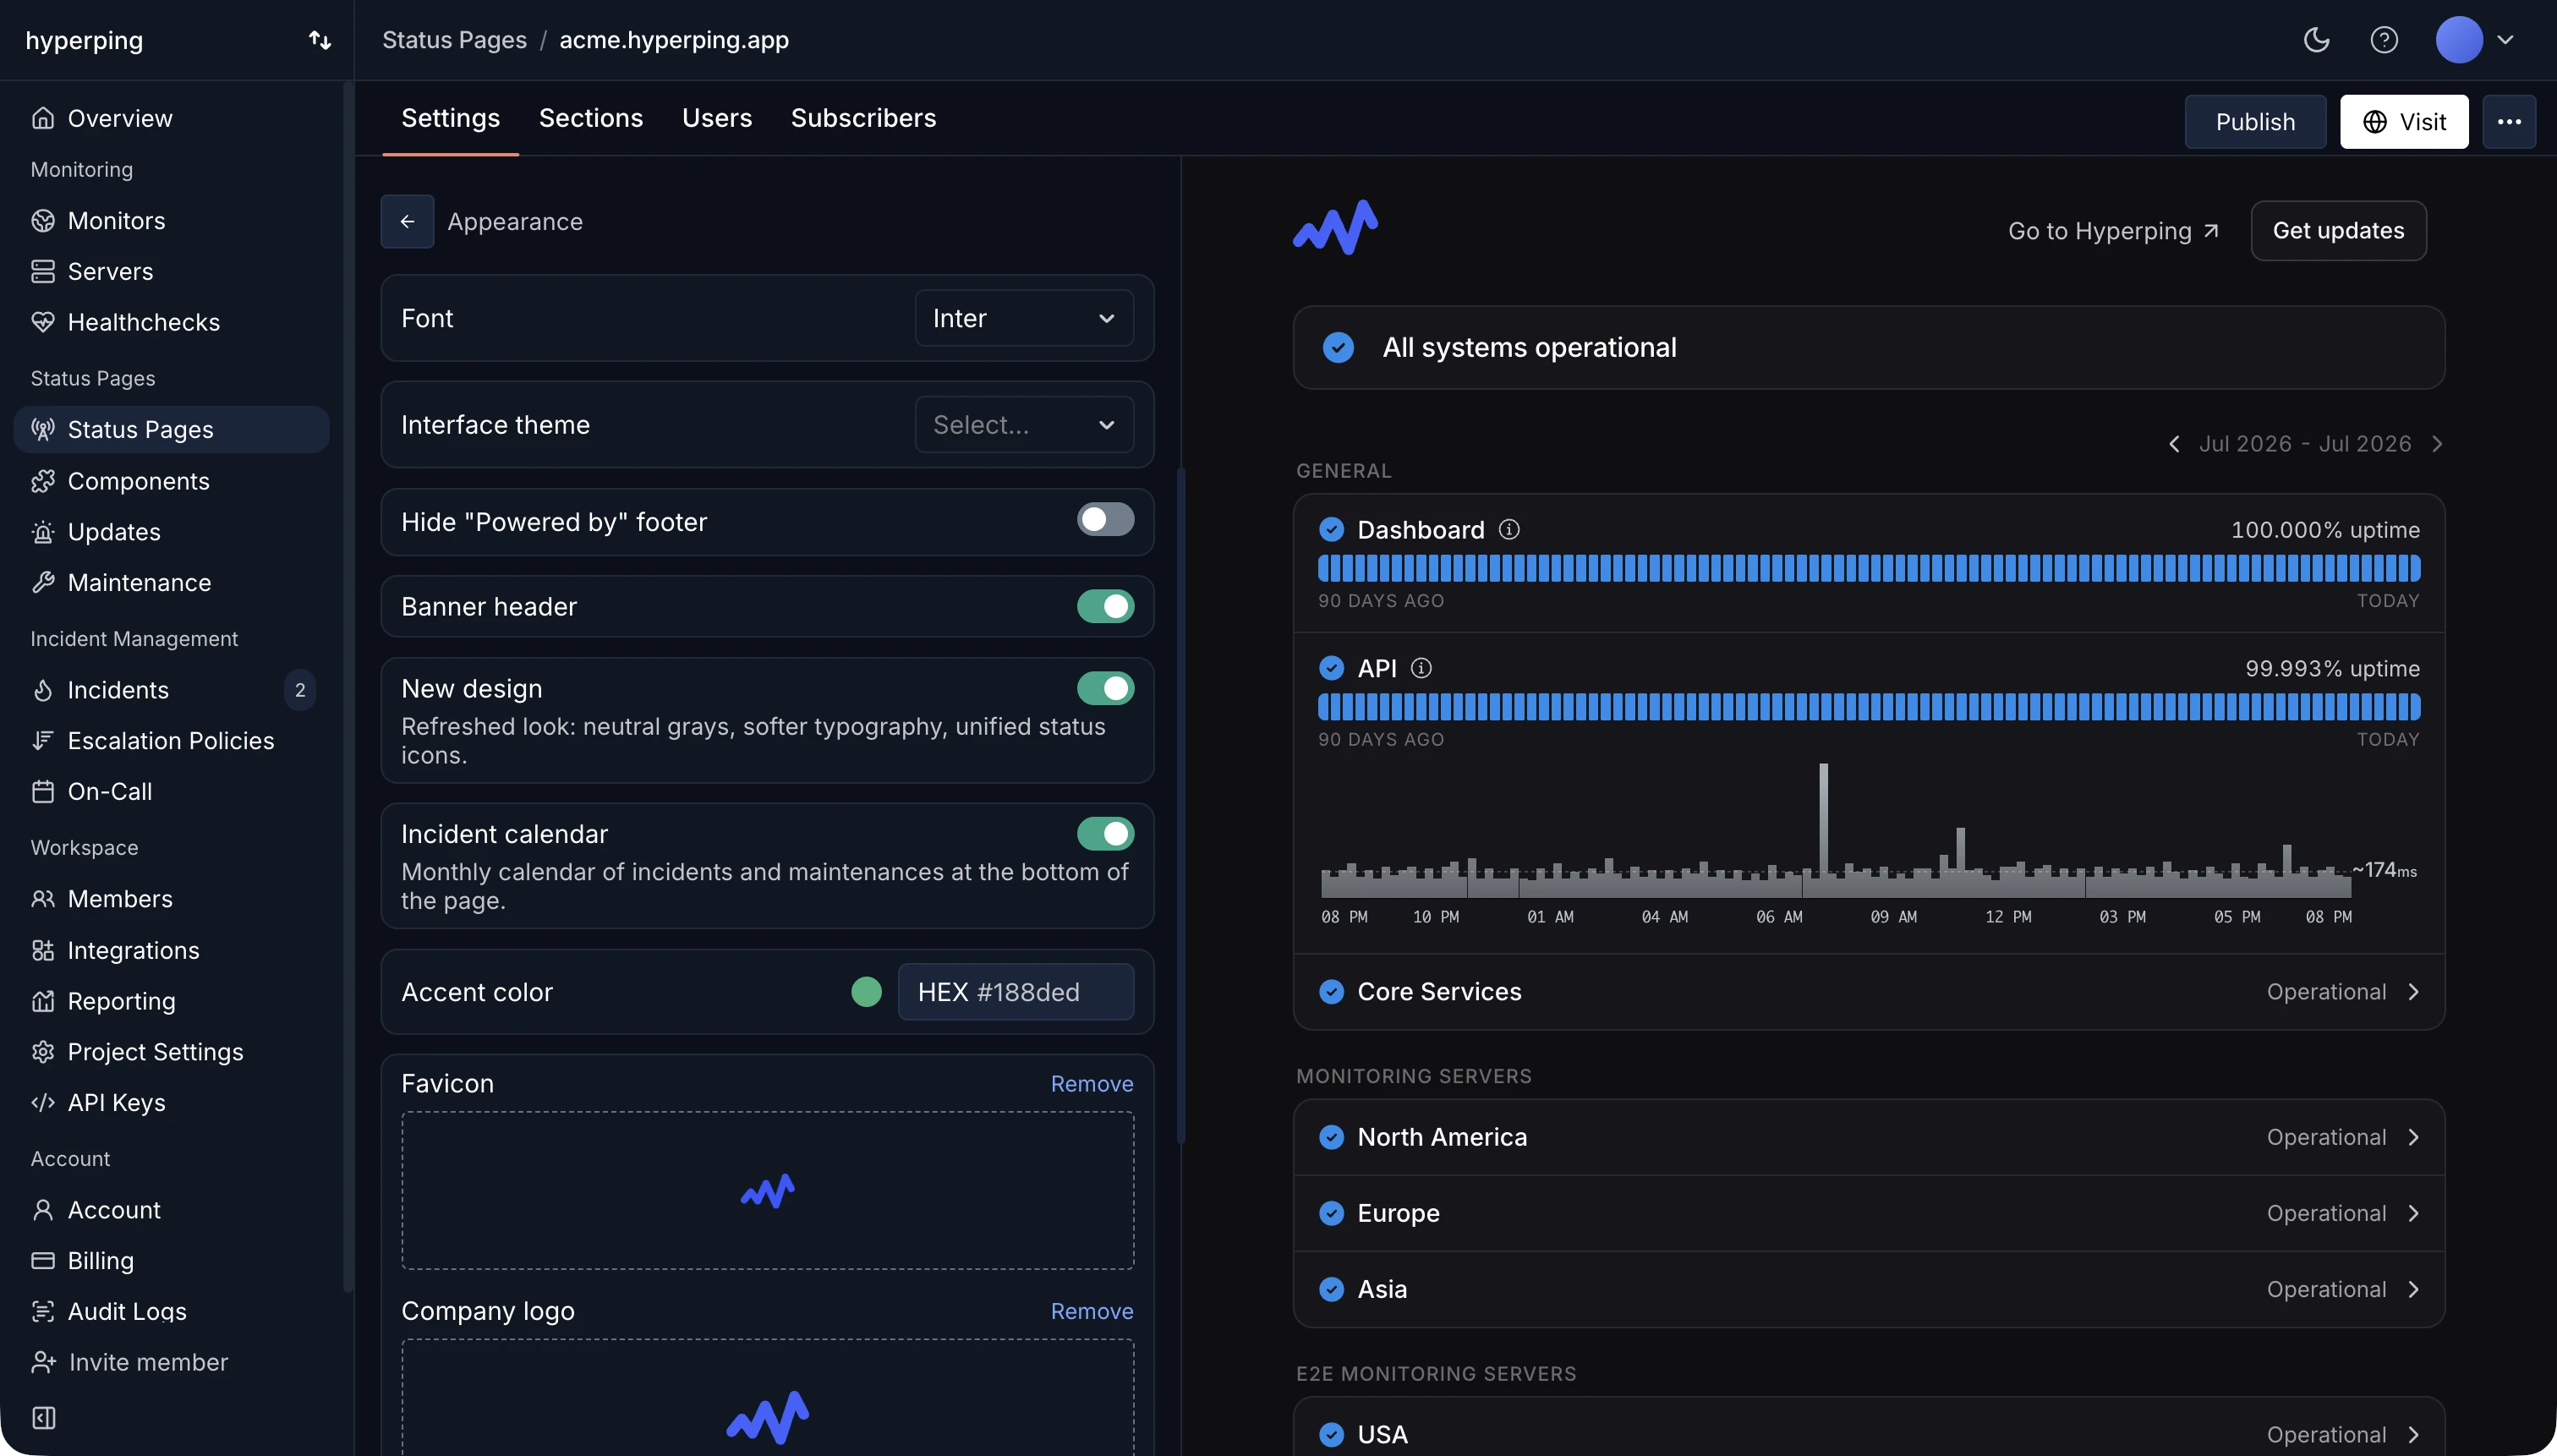
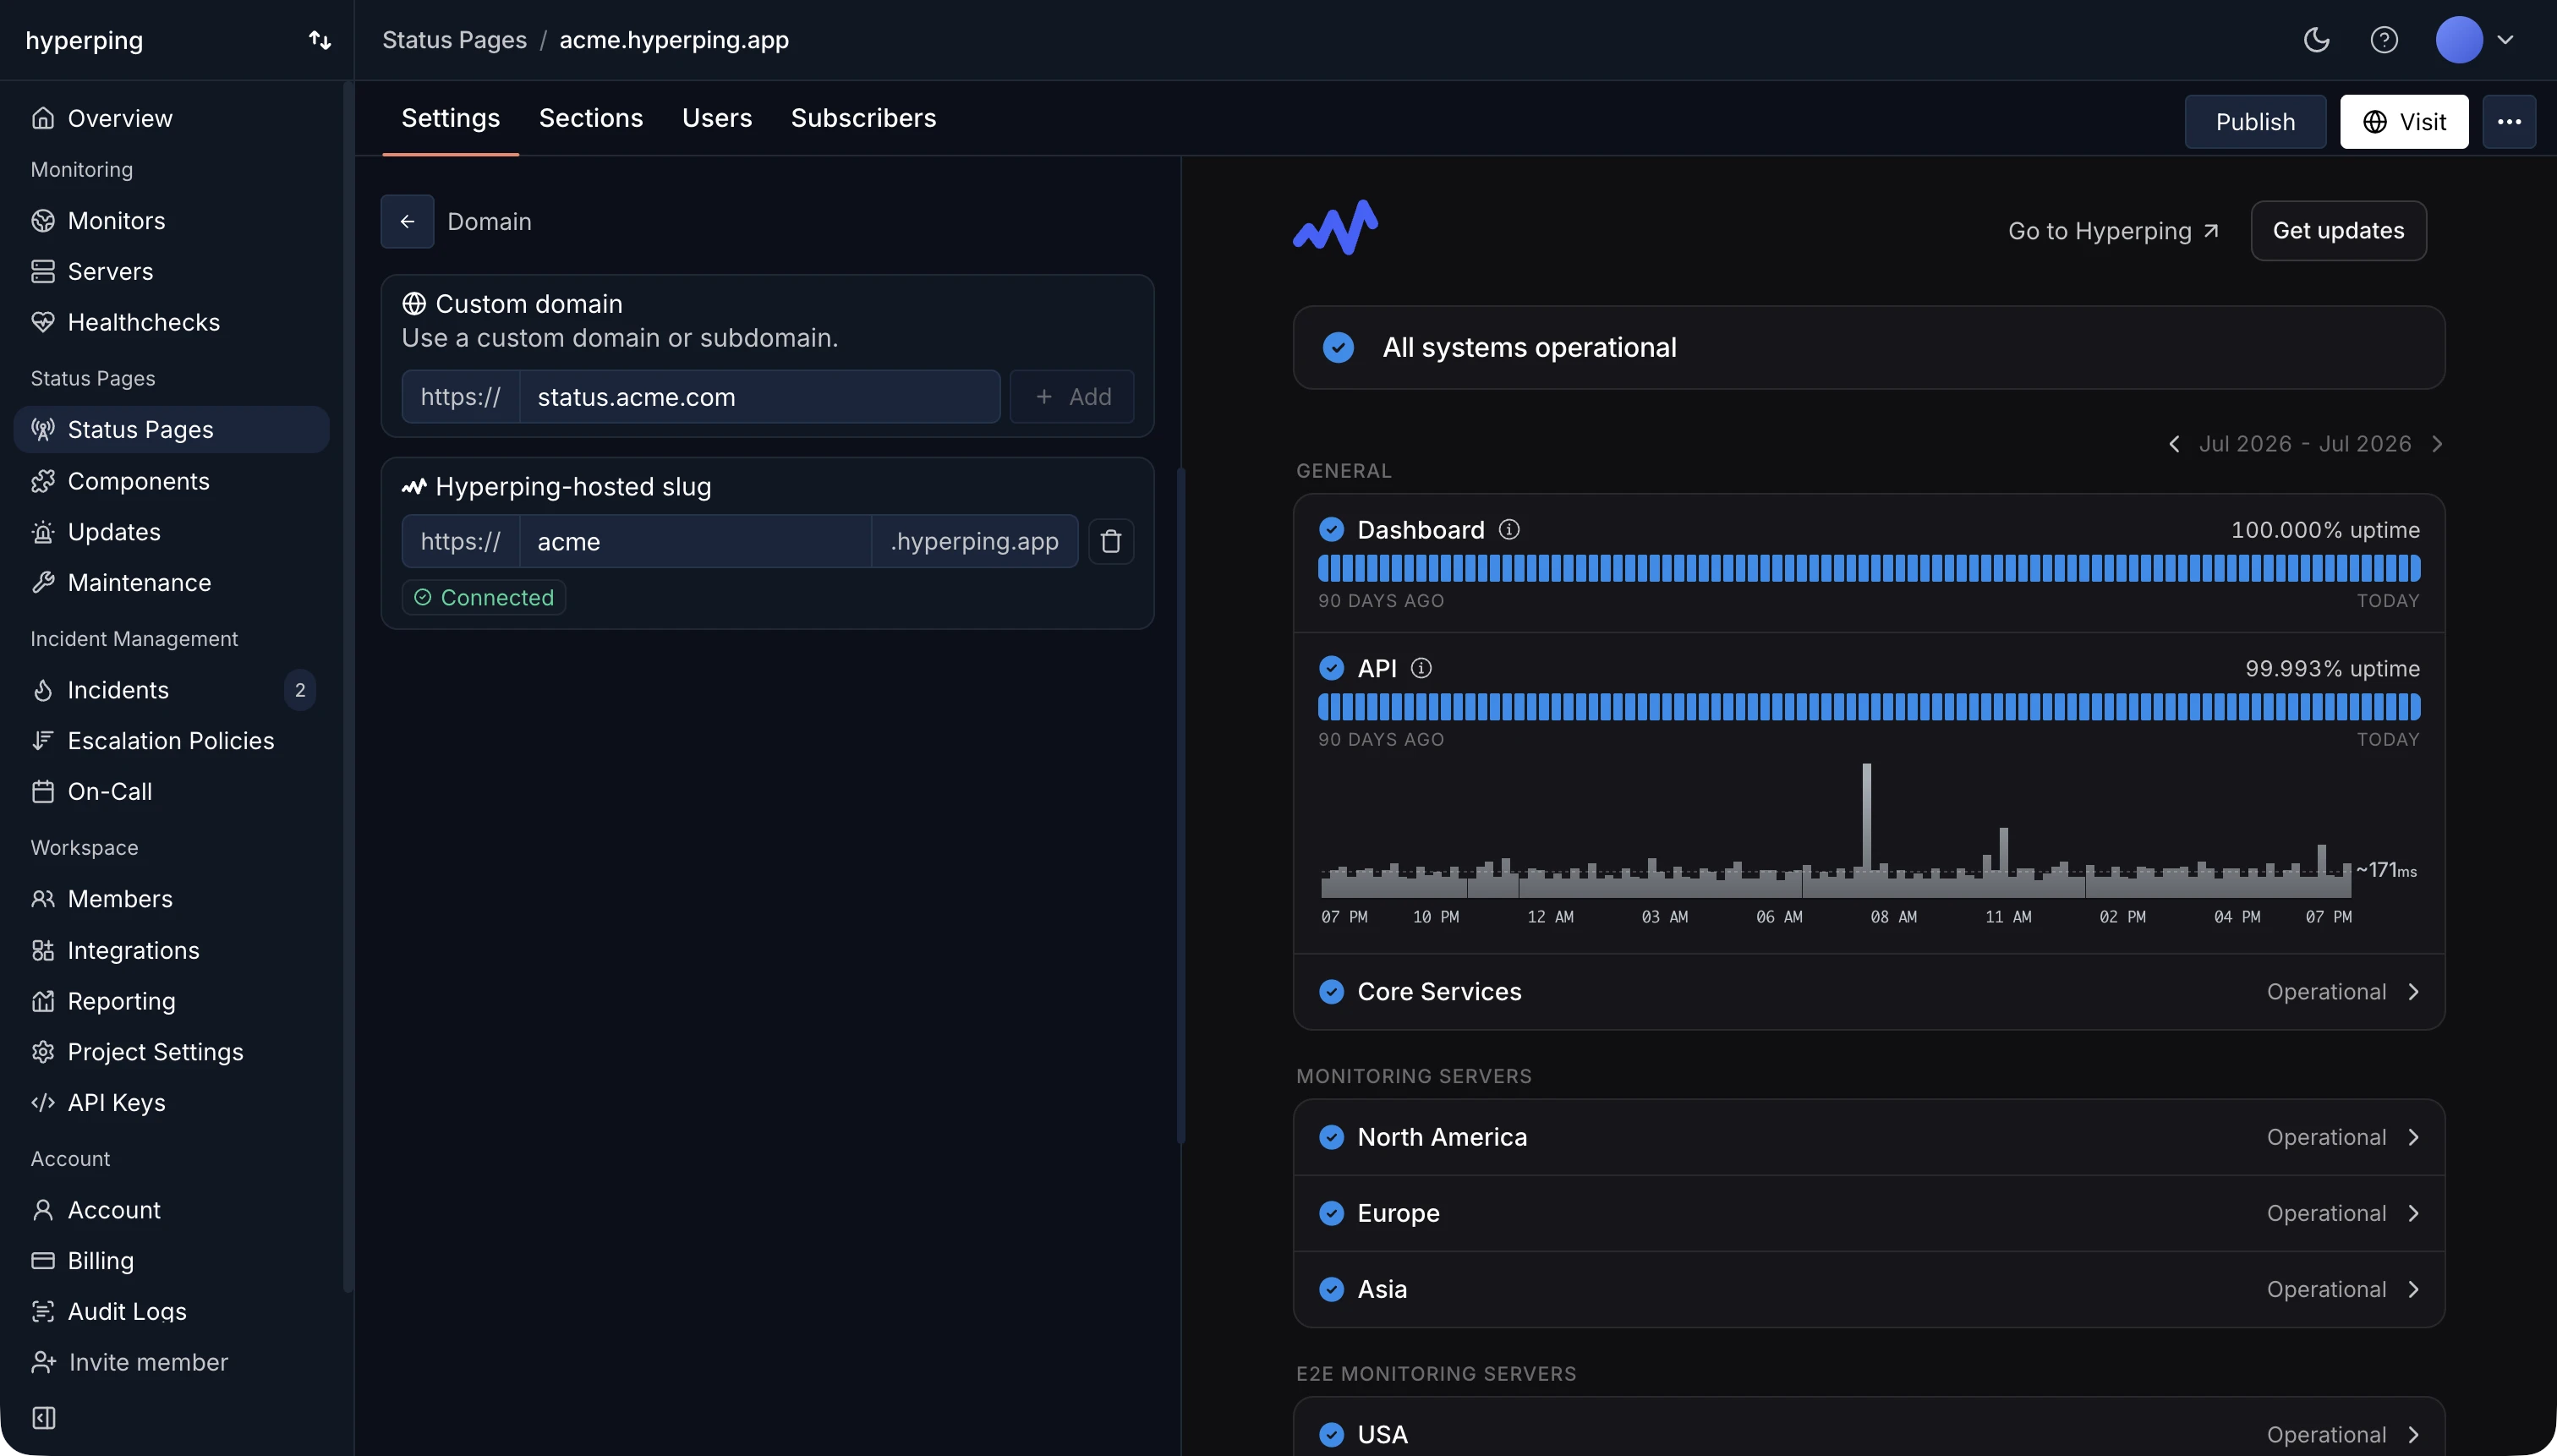
``` 2. Load the badge script Add the Hyperping badge's script to your website. ```html ``` 3. Initialize it with your settings Paste the generated code that includes your badge's settings. ```html ``` Try it out here: [https://hyperping.com/badge-builder](https://hyperping.com/badge-builder). ## Next steps [ Status page JSON→ The public endpoint the badge reads its status and uptime from. ](https://hyperping.com/docs/status-page/status-page-json)[ How we calculate uptime→ The math behind the uptime number your badge can display. ](https://hyperping.com/docs/status-page/uptime-calculation)[ Create a status page→ Build the status page your badge links to. ](https://hyperping.com/docs/status-page/create-status-page)[ Go-live checklist→ Everything to verify before you announce your status page. ](https://hyperping.com/docs/status-page/go-live-checklist) [← Status page public API](https://hyperping.com/docs/status-page/public-api)[SEO and analytics →](https://hyperping.com/docs/status-page/seo-analytics) [](https://x.com/hyperping)[](https://www.linkedin.com/company/hyperping) © 2026 Hyperping --- Source: https://hyperping.com/docs/status-page/go-live-checklist # Go-live checklist Your status page is built. Run through this checklist before you share the URL, so the page your users discover is complete, branded, and the only source of truth from day one. ## 1\. Get services and sections ready The page is only useful if it shows the services your users actually care about. 1. Add your services Services pull their real-time status from your monitors. [Add them](https://hyperping.com/docs/status-page/add-services) from the Sections tab, and use the Gear icon to rename any service whose monitor name would confuse outsiders. 2. Organize them into sections Group services into [sections](https://hyperping.com/docs/status-page/sections), and into groups within sections, by product area, region, or team. Reorder them so the most important services come first. 3. Choose the metrics to display Each service can show an uptime graph of the past 90 days and a response time graph of the past 24 hours. Toggle them from the Gear icon on the selected service. ## 2\. Put it on your own domain A status page on your own domain is easier to find and easier to trust. Follow the [custom domain guide](https://hyperping.com/docs/status-page/custom-domain). 1. Configure DNS For a subdomain like status.acme.com, create a CNAME record pointing to cname.hyperping.io. For an apex domain, create an A record pointing to 216.150.1.1. 2. Publish and verify HTTPS Enter the domain in your status page settings and hit Publish. Every status page is served over HTTPS only, with an automatic SSL certificate renewed 30 days before expiry. 3. Keep the hyperping.app URL as a fallback DNS propagation can take up to 24 hours. Your Hyperping-hosted slug (yourname.hyperping.app) is instantly available, so you can test and demo while you wait. ## 3\. Brand it and white label it Make the page unmistakably yours before anyone sees it. The [white labeling guide](https://hyperping.com/docs/status-page/white-labeling) covers the full setup. 1. Apply your visual branding Set your company logo (with an optional dark mode logo), favicon, accent color, font, and theme from the [status page builder](https://hyperping.com/docs/status-page/create-status-page). Visual branding is available on all plans. 2. Remove Hyperping branding On the Business plan, hide the "Powered by Hyperping" footer and send subscriber emails from your own domain, so every touchpoint carries your brand. 3. Set indexing and analytics Decide whether search engines should find the page with the "Hide from search engines" toggle, and add your Google Analytics tag if you want traffic data. Both live in the builder's Settings tab. ## 4\. Open subscriber notifications Subscribers hear about incidents from you, not from Twitter. Set the channels up in the [Subscribers tab](https://hyperping.com/docs/status-page/subscribers). 1. Pick the channels Offer up to 4 channels: email, Slack, Microsoft Teams, and SMS. SMS requires connecting [your own Twilio account](https://hyperping.com/docs/status-page/sms-notifications), so only enable it if you use Twilio. 2. Bring your existing subscribers over Manually add email subscribers from your previous tool, up to 500 addresses at once, or use the Subscribers API. Slack, Teams and SMS subscribers must subscribe through their own channels, so invite them to re-subscribe on the new page. ## 5\. Decide who can see it Leave the page public, or restrict it before the URL starts circulating. 1. Public page Nothing to do. Anyone with the URL can view it, which is what most customer-facing status pages want. 2. Private page Go to Settings → Page Access and protect it with a password, Google SSO, email access codes, or single sign-on through your identity provider (SAML or OpenID Connect). The [private status pages guide](https://hyperping.com/docs/status-page/private-status-pages) compares the four options. ## 6\. Announce it and switch over The final step is making the new page the only one your users ever see. 1. Import your incident history Coming from StatusPage.io? [Import your historical incidents and maintenances](https://hyperping.com/docs/status-page/import-from-statuspage) first, so the new page launches with your track record instead of an empty history. 2. Communicate the new URL and update your links Share the new address with your users, then update every link that pointed to the old page: your website, your emails, and your docs. Add the [footer badge](https://hyperping.com/docs/status-page/footer-badge) to your site so real-time status is one click away. 3. Turn off the old status page Once the new page is live and linked, shut the old one down. Running two pages means posting every update twice, and the stale one will eventually contradict the real one. > **Go-live recap, in 6 points** > > - Services added, renamed for outsiders, and grouped into sections. > - Custom domain live with automatic HTTPS. > - Branding applied, Hyperping branding removed if white labeled. > - Subscriber channels open and existing subscribers imported. > - Access set: public, or protected the way you want. > - New URL announced, links updated, old page turned off. ## Next steps [ Publish and manage incidents→ Report incidents, post updates, and notify subscribers at every step. ](https://hyperping.com/docs/status-page/incidents)[ How we calculate uptime→ The math behind the uptime bars your visitors now see. ](https://hyperping.com/docs/status-page/uptime-calculation)[ Incident calendar→ Give visitors a month-at-a-glance view of past incidents and maintenances. ](https://hyperping.com/docs/status-page/incident-calendar)[ Import from StatusPage.io→ Migrate your historical incidents and maintenances in a few clicks. ](https://hyperping.com/docs/status-page/import-from-statuspage) [← How we calculate uptime](https://hyperping.com/docs/status-page/uptime-calculation)[Publish incidents →](https://hyperping.com/docs/status-page/incidents) [](https://x.com/hyperping)[](https://www.linkedin.com/company/hyperping) © 2026 Hyperping --- Source: https://hyperping.com/docs/status-page/import-from-statuspage # Import from StatusPage.io Learn how to migrate your incidents and maintenances from StatusPage.io to Hyperping. Our import tool allows you to easily migrate your historical incidents and scheduled maintenances from StatusPage.io to your Hyperping status page. > **Moving your whole setup off StatusPage.io?** > > This page covers the importer for your historical incidents and maintenances. For the complete move (concept mapping, monitors, domain, branding, and subscribers), follow the [Migrate from Statuspage.io guide](https://hyperping.com/docs/migrate/from-statuspage). ![Import from StatusPage.io interface](https://hyperping.com/import-from-statuspage.png) The StatusPage.io import tool ## How it works The import process is straightforward and gives you full control over what gets migrated: 1. Export your data from StatusPage.io Get your incidents and maintenances as JSON files. 2. Upload to Hyperping Use our import tool at [app.hyperping.io/statuspage/import](https://app.hyperping.io/statuspage/import). 3. Match components Map your StatusPage.io components to Hyperping monitors/components. 4. Choose destination Select which status page each incident/maintenance will appear in. 5. Import Review and import your selected items. ![StatusPage.io import UI](https://hyperping.com/ui-import-from-statuspage.png) Matching components and choosing destinations before importing ## Step 1: Export data from StatusPage.io To get your data from StatusPage.io, you'll need to access their API endpoints directly. Add the following paths to your StatusPage.io URL: ### For incidents: Add `/api/v2/incidents.json` to your StatusPage.io URL **Example:** `https://yourcompany.statuspage.io/api/v2/incidents.json` ### For scheduled maintenances: Add `/api/v2/scheduled-maintenances.json` to your StatusPage.io URL **Example:** `https://yourcompany.statuspage.io/api/v2/scheduled-maintenances.json` Save these JSON files to your computer: you'll upload them in the next step. ## Step 2: Import to Hyperping Navigate to [app.hyperping.io/statuspage/import](https://app.hyperping.io/statuspage/import) and upload your JSON file(s). ## Step 3: Match components During the import process, you'll be able to match StatusPage.io components to your existing Hyperping monitors or components. This ensures that imported incidents appear on the correct services in your status page. ## Step 4: Choose status pages If you have multiple status pages in Hyperping, you can choose which status page each incident or maintenance should appear on. This gives you flexibility in organizing your historical data. ## Import recommendations - **Start small**: We recommend trying a few incidents/maintenances first to test the process - **Batch size**: The system processes imports in batches of 15 items at a time from the frontend - **Large imports**: For large datasets, consider splitting your JSON files into chunks of a few hundred incidents maximum - **Review before importing**: Use the preview feature to review what will be imported before finalizing ## What gets imported The import tool will migrate: - Incident details (title, description, status, timestamps) - Maintenance windows (title, description, scheduled times) - Component associations - Status updates and timeline ## Need help? If you need assistance with the import process or encounter any issues, don't hesitate to reach out to us via the chat or email at hello@hyperping.io. We're here to help make your migration as smooth as possible. ## Next steps [ Migrate from Statuspage.io→ The complete migration guide, from concept mapping to going live. ](https://hyperping.com/docs/migrate/from-statuspage)[ Publish incidents→ Report incidents, post updates, and notify subscribers at every step. ](https://hyperping.com/docs/status-page/incidents)[ Incident calendar→ Give visitors a month-at-a-glance view of past incidents and maintenances. ](https://hyperping.com/docs/status-page/incident-calendar)[ Go-live checklist→ Everything to verify before you announce your status page. ](https://hyperping.com/docs/status-page/go-live-checklist) [← Migrate to version 2](https://hyperping.com/docs/status-page/migrate-to-v2) [](https://x.com/hyperping)[](https://www.linkedin.com/company/hyperping) © 2026 Hyperping --- Source: https://hyperping.com/docs/status-page/incident-calendar # Incident calendar Show a monthly calendar of incidents and maintenances at the bottom of your status page. ![Incident calendar on a status page, with an incident marked on July 7](https://hyperping.com/static/incident-calendar-2884a5d6829c766c20fea94853157e3f.webp) Incident calendar on a status page, with an incident marked on July 7 The calendar gives visitors a month-at-a-glance view of your reliability. Days with incidents or maintenances are circled, and hovering a day lists what happened with links to the full incident details. It complements the incident history section, which stays chronological. - Show customers evaluating your service that incidents are rare, on a single screen. - Let visitors check whether a specific date had an incident without scrolling through history. - Display upcoming maintenance windows on their scheduled date. ## Enable the calendar 1. Open your status page Navigate to **Status Pages** and select your status page. 2. Open the Appearance settings In the **Settings** tab, open **Appearance**. 3. Turn on Incident calendar Enable the **Incident calendar** option. 4. Publish Click **Publish**. The calendar is off by default and is configured per status page. ## What visitors see The calendar renders at the bottom of the page, after the incident history. Weeks run Monday to Sunday, and the arrows next to the month name navigate to past or future months. A day with at least one event shows its number in a colored circle. The color reflects the most severe event of that day: | Color | Event type | | --- | --- | | Red | Outage | | Amber | Incident | | Blue | Maintenance | Hovering a marked day opens a tooltip with the date and the list of events, each linking to its incident page. Scheduled maintenances appear on their planned date, so visitors can also see what is coming up. Weekday and month names follow the language of the status page. On [multi-language status pages](https://hyperping.com/docs/status-page/create-status-page), the calendar is localized like the rest of the page. > **Where do these events come from?** > > Incidents are published from your dashboard or opened automatically by monitoring: see [Publish and manage incidents](https://hyperping.com/docs/status-page/incidents). Planned work comes from [maintenance windows](https://hyperping.com/docs/maintenance/create-maintenance), shown on their scheduled date. ## Next steps [ Publish incidents→ Report incidents, post updates, and notify subscribers. ](https://hyperping.com/docs/status-page/incidents)[ Maintenance windows→ Schedule planned work so visitors see it coming. ](https://hyperping.com/docs/maintenance/create-maintenance)[ How we calculate uptime→ The formula behind the uptime numbers your visitors see. ](https://hyperping.com/docs/status-page/uptime-calculation)[ Create a status page→ Every setting of the status page builder, explained. ](https://hyperping.com/docs/status-page/create-status-page) [← Sections](https://hyperping.com/docs/status-page/sections)[Custom domain →](https://hyperping.com/docs/status-page/custom-domain) [](https://x.com/hyperping)[](https://www.linkedin.com/company/hyperping) © 2026 Hyperping --- Source: https://hyperping.com/docs/status-page/incidents # Publish and manage incidents Report incidents on your status page, post updates as you work through them, and notify subscribers at every step. When something breaks, your status page is where customers look first. Hyperping lets you publish an incident, attach it to the affected services, and keep the timeline updated until resolution. Subscribers are notified on the channel they picked, so your support inbox stays quieter during an outage. - Announce a degraded third-party dependency that your monitoring may not catch. - Keep customers informed during an outage without leaving your incident workflow. - Build a public history that shows how you communicate when things go wrong. > **Plan availability** > > Publishing incidents and maintenances to a status page is included in paid plans. See the [pricing page](https://hyperping.com/pricing) for details. ## Manual incidents and automated outage detection Incidents appear on your status page in two ways: - Hyperping monitors your services and automatically creates incidents when outages are detected. The affected service is marked as down on your status page without any manual work. - You can also declare incidents yourself from the dashboard, with a description and immediate team notification. Use manual incidents for problems your monitoring cannot see, such as a degraded feature that still returns a 200, or an upstream provider issue. A manual report has a criticality, either **incident** or **outage**, which reflects how severe the event is. The [incident calendar](https://hyperping.com/docs/status-page/incident-calendar) shows outages in red and incidents in amber. ![Updates list in the Hyperping dashboard](https://hyperping.com/static/incidents-updates-list-158113ef195ff5ae45c5e4efeaa54309.webp) The Updates view lists every incident you published, with its status and update count > **Announcing planned work rather than an incident?** > > Schedule a [maintenance window](https://hyperping.com/docs/maintenance/create-maintenance) instead. It appears on your status page on its scheduled date, so visitors see it coming. ## Create an incident from the dashboard 1. Create a new incident Open your project dashboard and create a new incident. 2. Write a clear title On multi-language status pages, you can provide the title in each language of the page. 3. Choose the type Either outage or incident, reflecting how severe the event is. 4. Select the affected services This determines which components show as impacted, and which subscribers get notified. 5. Choose the status pages If you run several status pages, choose which pages the incident is reported on. 6. Publish the first update Write the first update, usually an investigating message, and publish. ![New incident composer in the Hyperping dashboard](https://hyperping.com/static/incidents-new-update-49885382fee8b6dd9f9d38bef2761a6f.webp) The composer: title, lifecycle status, criticality, and the status pages to publish on ## Post updates through the incident lifecycle An incident is a timeline of updates. Each update has a status that tells visitors where you are in the resolution process: | Status | When to use it | | --- | --- | | Investigating | You are aware of the problem and looking into the cause. | | Identified | You found the cause and are working on a fix. | | Update | Intermediate progress that does not change the status. | | Monitoring | A fix is deployed and you are watching for recurrence. | | Resolved | The incident is over. This closes the timeline. | You do not have to go through every status. A short incident can jump from investigating straight to resolved. Use rich text formatting in the update body to keep longer updates readable. ![Incident timeline with identified and resolved updates](https://hyperping.com/static/incidents-update-detail-f6490046b9dbda4133bcc960f91ba24e.webp) An incident timeline: each update is stamped with its status and time ## Explain the incident with a post-mortem Once an incident is resolved, you can publish a post-mortem on it: what happened, why, and what you changed. It appears at the top of the incident on your status page, as a **Postmortem - Read details** entry in the history and in full on the incident page. You can keep it as a draft while your team reviews it, or start from the internal post-mortem of the alerting incident. See [Public post-mortems](https://hyperping.com/docs/status-page/post-mortems). ## How subscribers get notified Visitors can subscribe to your status page through up to four channels: email, Slack, Microsoft Teams, and SMS. Every update you publish notifies subscribers on the channel they chose. See [Subscribers](https://hyperping.com/docs/status-page/subscribers) for how each channel works and how to enable them. Notifications are scoped by the services you select on the incident. Subscribers who follow specific services only hear about incidents affecting those services. SMS notifications to subscribers require connecting your own Twilio account. Follow the [SMS notifications guide](https://hyperping.com/docs/status-page/sms-notifications) to set it up. ## Acknowledge and escalate monitor-detected outages When a monitor detects an outage, your team is alerted through your configured [notification channels](https://hyperping.com/docs/projects/notification-channels). Acknowledging the outage takes ownership of it and stops repeat alerts. The steps of its escalation policy still fire on schedule until the outage is resolved, so the next level is paged, on the channels defined for it, if the problem lasts. With the [Slack integration](https://hyperping.com/docs/integrations/slack), you can acknowledge incidents directly from Slack without opening the dashboard. Hyperping tracks who acknowledged each incident and how long it took, so you can measure MTTA and MTTR across your team. ## Post incident updates to a Slack channel The Slack Incident Manager integration posts to your preferred Slack channel every time you manually publish an incident to your status page. You can create a new channel for every incident, or use a permanent one. After connecting Slack, invite the **@Hyperping Ongoing Incident** bot to the channel of your choice. Setup instructions are in the [notification channels guide](https://hyperping.com/docs/projects/notification-channels). ## Show your incident history Resolved incidents remain visible in the incident history of your status page. Moving from StatusPage.io? You can bring your historical incidents and maintenances with you using the [import tool](https://hyperping.com/docs/status-page/import-from-statuspage). > **Want a month-at-a-glance view of this history?** > > Enable the [incident calendar](https://hyperping.com/docs/status-page/incident-calendar) to show past incidents and upcoming maintenances on a monthly calendar at the bottom of your page. ## Automate incidents with the API Everything above can be done programmatically. The [Incidents API](https://hyperping.com/docs/api/incidents) lets you list, create, update, and delete incidents, and add updates to an existing incident, using the same update statuses as the dashboard. Titles and update text accept localized values for multi-language status pages. For example, create an incident with its first investigating update: ```bash curl -X POST https://api.hyperping.io/v3/incidents \ -H "Authorization: Bearer ${API_TOKEN}" \ -H "Content-Type: application/json" \ -d '{ "title": { "en": "We are investigating the issue", "fr": "Nous enquêtons sur le problème" }, "type": "outage", "affectedComponents": ["comp_123"], "statuspages": ["sp_123"], "updates": [ { "date": "2023-10-01T13:00:00Z", "text": { "en": "We are investigating the issue", "fr": "Nous enquêtons sur le problème" }, "type": "investigating" } ] }' ``` **Response201 Created** ```json { "uuid": "inci_cDAqydvnNnyc8D", "date": "2023-10-01T13:00:00.000Z", "title": { "en": "We are investigating the issue", "fr": "Nous enquêtons sur le problème" }, "type": "outage", "affectedComponents": ["comp_123"], "statuspages": ["sp_123"], "updates": [ { "uuid": "upd_abc123", "date": "2023-10-01T13:00:00.000Z", "text": { "en": "We are investigating the issue", "fr": "Nous enquêtons sur le problème" }, "type": "investigating" } ] } ``` Start with [Create an incident](https://hyperping.com/docs/api/incidents/create) and [Add an update](https://hyperping.com/docs/api/incidents/add-update). AI agents can publish, update, correct and resolve status page incidents, and declare, acknowledge and escalate the incidents that page your on-call team, through the [MCP server](https://hyperping.com/docs/mcp). ## Next steps [ Subscribers→ Email, Slack, Teams, and SMS notifications for your visitors. ](https://hyperping.com/docs/status-page/subscribers)[ Incidents API→ List, create, update, and delete incidents programmatically. ](https://hyperping.com/docs/api/incidents)[ Public post-mortems→ Publish what happened and what you changed once an incident is resolved. ](https://hyperping.com/docs/status-page/post-mortems)[ Import from StatusPage.io→ Bring your historical incidents and maintenances with you. ](https://hyperping.com/docs/status-page/import-from-statuspage) [← Incident calendar](https://hyperping.com/docs/status-page/incident-calendar)[Custom domain →](https://hyperping.com/docs/status-page/custom-domain) [](https://x.com/hyperping)[](https://www.linkedin.com/company/hyperping) © 2026 Hyperping --- Source: https://hyperping.com/docs/status-page/languages # Multi-language status pages Serve your status page, your service names, and every incident update in more than one language. A status page has one default language, and can carry any number of additional ones. Once a second language is on, everything a visitor reads becomes translatable: the page description, your service names, and the text of each incident and maintenance update. Visitors pick their language from the page itself. This matters when: - Your customers are spread across countries and read your status page during an outage, which is the worst moment to ask them to parse a second language - You operate in a market where communicating in the local language is expected, or required - Your support team already answers in several languages and the status page is the one place that does not ## Available languages English, French, German, Dutch, Polish, Russian, and Swedish. Any of them can be the default, and any of them can be added alongside it. > **Plan availability** > > Choosing your default language works on every plan. Adding more languages requires the Pro plan. ## Set it up 1. Open the Languages settings Go to [Status Pages](https://app.hyperping.io/v2/statuspage), pick your page, then open the **Languages** category. 2. Pick your default language The **Default language** is what every visitor sees first, and the language your service names and updates fall back to. 3. Add the others Add each language you want under **Additional languages**. They appear as tags you can remove later. 4. Translate what visitors read Your service names and page description now show one input per language. Fill them in, then hit Publish. ## Writing incidents in several languages With more than one language enabled, the incident and maintenance editors show a language tab above each text field. Write the title and each update once per language, and the visitor sees the version matching their choice. A language tab you leave blank publishes blank, so during a fast-moving incident the pragmatic move is to write the same text in every tab first and refine the translations afterwards. Editing an update later works exactly like editing any other incident update. > **Check every tab before you publish** > > Nothing blocks you from publishing an update with only one language filled in, and subscriber notifications go out with whatever you wrote. If a large part of your audience reads another language, it is worth a glance at the tabs before hitting publish. ## How visitors choose A language picker appears on the status page once a second language is enabled. The page opens in your default language, not in the visitor's browser language, and their choice is remembered in their browser for the next visit. ## Languages in the machine-readable outputs | Output | Behavior | | --- | --- | | [RSS and Atom feeds](https://hyperping.com/docs/status-page/rss-atom-feeds) | Served in the default language, or another one with `?lang=fr` | | [Public API](https://hyperping.com/docs/status-page/public-api) | Returns a `title` object keyed by language code | | [status.json](https://hyperping.com/docs/status-page/status-page-json) | Language independent, it carries no text | ## Troubleshooting **I cannot add a second language** Additional languages require the Pro plan. The default language selector stays available on every plan. **An incident update looks empty in one language** That language tab was left blank when the update was published. Open the incident, fill the tab in, and save. An update written before you added a second language is not affected: text typed while the page had a single language is reused for every language you add later. **I removed a language and the translations are gone** Removing a language drops the text written for it. Re-adding the language gives you empty fields again, so export or copy anything you want to keep before removing one. **The language I need is not in the list** Tell us which one through the chat or by email. Adding a language means translating the interface strings on our side, so it is a request we act on rather than a setting you can flip. ## Next steps [ Publish incidents→ Write updates, including the per-language tabs. ](https://hyperping.com/docs/status-page/incidents)[ Add services→ Name and translate the services on your page. ](https://hyperping.com/docs/status-page/add-services)[ RSS and Atom feeds→ Serve your history per language with the lang parameter. ](https://hyperping.com/docs/status-page/rss-atom-feeds)[ Create a status page→ Every other setting of the status page builder. ](https://hyperping.com/docs/status-page/create-status-page) [← White labeling](https://hyperping.com/docs/status-page/white-labeling)[SMS notifications →](https://hyperping.com/docs/status-page/sms-notifications) [](https://x.com/hyperping)[](https://www.linkedin.com/company/hyperping) © 2026 Hyperping --- Source: https://hyperping.com/docs/status-page/migrate-to-v2 # Migrate to version 2 Learn how to migrate your status page to our revamped version. Our status page product has been revamped to a second, much improved version. Some of the new features involve: - **Static served** - Allows to serve ultra-fast status pages - **Hosted on a reliable hosting provider** - rather than an in-house solution. - **Private/internal status pages** - Using Google SSO - **Updated design** - **Multi-lang support** - **TV Mode/auto refresh stats** - **Light/Dark modes** - **Fixes and improvements from the v1** - **Updated designs of incident emails** ## Switch to V2 1. Open Status Pages If you already have a version 1 status page, when clicking "Status Pages", you will be redirected to the "https://app.hyperping.io/statuspage" page. 2. Click "Switch to v2" To view the v2 status page, click the "Switch to v2" button at the top-right of the Status Page's view. You will then be redirected to a "https://app.hyperping.io/v2/statuspage" page. You can switch back to v1 at anytime. Learn more about [how to create a status page](https://hyperping.com/docs/status-page/create-status-page) (v2). > **The v1 is no longer maintained** > > We recommend migrating to the new status page version as soon as possible, as we are not maintaining the v1 anymore. ## Need help? Whether you need help or don't have the time, we can help migrate your status page ourselves by replicating your v1 over the v2. We will take care of migrating your subscribers over your new status page as well. Do not hesitate to ask us via the chat or via email at hello@hyperping.io. ### Do not forget about the CNAME record! > **Update your DNS record** > > Old status pages were using the _status.hyperping.io_ CNAME record. With the newer version, you now must use _cname.hyperping.io_. ## Next steps [ Create a status page→ Every customization option in the v2 status page builder. ](https://hyperping.com/docs/status-page/create-status-page)[ Custom domain→ Point your domain at cname.hyperping.io with automatic HTTPS. ](https://hyperping.com/docs/status-page/custom-domain)[ Import from StatusPage.io→ Bring your historical incidents and maintenances with you. ](https://hyperping.com/docs/status-page/import-from-statuspage)[ Go-live checklist→ Everything to verify before you announce your new page. ](https://hyperping.com/docs/status-page/go-live-checklist) [← Footer badge](https://hyperping.com/docs/status-page/footer-badge)[Import from statuspage.io →](https://hyperping.com/docs/status-page/import-from-statuspage) [](https://x.com/hyperping)[](https://www.linkedin.com/company/hyperping) © 2026 Hyperping --- Source: https://hyperping.com/docs/status-page/post-mortems # Public post-mortems Explain what happened after an incident, on the status page your customers already check. Once an incident is resolved, you can attach a written post-mortem to it. It appears at the top of the incident on your status page, above the updates you posted during the outage. Visitors see a **Postmortem - Read details** line in your incident history and the full text on the incident page. You write it in the dashboard, keep it as a draft while your team reviews it, and publish it when it is ready. - Tell customers what caused an outage and what you changed so it does not happen again. - Answer the "what happened yesterday?" emails with a single link. - Give security reviewers and enterprise buyers a public record of how you handle incidents. ![Status page incident history with a Postmortem - Read details entry](https://hyperping.com/static/post-mortem-history-a8ddbb81d0d2bd98525bfdac5dafcecf.webp) In the incident history, a published post-mortem shows as the newest entry of the incident ## Key terms used in this article - **Public post-mortem**: the write-up you publish on the status page, attached to a status page incident. - **Internal post-mortem**: the write-up on the Post-Mortem tab of an alerting incident, under **Incidents**. It stays in the dashboard and never reaches your status page. - **Draft**: a post-mortem that is saved but not published. Only your team can see it. See the [Glossary](https://hyperping.com/glossary) for a full list of terms. > **Plan availability** > > Post-mortems are published on status page incidents, which are included in paid plans. See the [pricing page](https://hyperping.com/pricing) for details. ## Write and publish a post-mortem Go to [Status Pages → Updates → Choose an incident](https://app.hyperping.io/incidents) to open the incident you want to explain. 1. Open a resolved incident Once the latest update of an incident is **Resolved**, a **Public post-mortem** block appears at the top of its timeline. To start one before the incident is resolved, open the **...** menu next to the incident title and select **Write post-mortem**. 2. Click Write post-mortem The editor opens with a template: Summary, Impact, Root cause, Resolution, and What we are changing. Replace each section with your own text, or delete the ones you do not need. 3. Write each language On a multi-language status page, the editor has one tab per language. A language you leave empty shows the text of the page's default language. 4. Save a draft or publish Click **Save draft** to keep working on it without showing it to visitors, or **Publish** to add it to every status page the incident is published on. ![Public post-mortem editor in the Hyperping dashboard, with Save draft and Publish buttons](https://hyperping.com/static/post-mortem-editor-8a2233d4ef9ca81e015d1609a4d1e254.webp) The editor, with the same formatting tools as incident updates The editor supports headings, bold, italic, strikethrough, inline code, links, and bulleted or numbered lists. Anything else, such as scripts, embedded frames, or inline styles, is removed when you save. ## Start from your internal post-mortem If the status page incident was published from an alerting incident that already has an internal post-mortem, the block offers a second button: **Start from internal post-mortem**. It copies the internal text into the editor so you do not start from a blank page. Read it through before you publish. The internal version was written for your team: it usually names people, internal systems, and action items that customers do not need to see. The public version works best when it covers what customers experienced, the cause in plain language, and what you changed. The [post-mortem template playbook](https://hyperping.com/docs/playbooks/post-mortem-template) covers how to run the internal review itself. ## What visitors see A published post-mortem is the newest entry of the incident timeline, dated with its publication date: - In the incident history and the recent incidents on your home page, the entry reads **Postmortem - Read details**. Clicking it opens the incident page. - On the incident page, the entry shows the full post-mortem. You can link to it directly by adding `#postmortem` to the incident URL. The labels follow the visitor's language on multi-language pages. ![Status page incident page showing the full post-mortem above the incident updates](https://hyperping.com/static/post-mortem-status-page-de1ed6bb895ec07eab926d0574b187d7.webp) On the incident page, the post-mortem sits above the updates posted during the outage ## Edit, unpublish, or delete Once saved, the post-mortem shows in the incident timeline of the dashboard with a **Draft** or **Published** label. Open its **...** menu to change it: | Action | What happens on your status page | | --- | --- | | **Edit** | A published post-mortem is updated as soon as you click **Save**. It keeps its original publication date, so fixing a typo does not move it. | | **Publish** | The draft appears on every status page the incident is published on. | | **Unpublish** | The post-mortem is removed from the status page and kept as a draft. | | **Delete** | The post-mortem is removed from the status page and from the dashboard. This cannot be undone. | ![Published public post-mortem in the incident timeline of the Hyperping dashboard](https://hyperping.com/static/post-mortem-dashboard-1070da34d25d00b74d547310f70de9c2.webp) A published post-mortem in the dashboard, above the incident updates On the alerting incident, the Post-Mortem tab shows whether the public version is written, in draft, or published, with a link to it. ## Examples - Two days after a regional API outage, a SaaS team publishes the root cause and its new deploy safeguards, then links the post-mortem in its reply to every customer who opened a ticket. - After a payment provider failure, an e-commerce team explains how it failed over and what it will do next time, so customers know the problem is handled. - A company whose status page is in English and French writes both versions in the same editor and publishes them together. ## Troubleshooting **The post-mortem does not show on my status page** Check that it is published: a draft only shows in the dashboard. Then check that the incident is published on that status page, in the **Status pages** list of the incident. Status pages refresh within a few seconds of publishing. **The Write post-mortem button is missing** The block appears once the latest update of the incident is **Resolved**. Before that, use **Write post-mortem** in the **...** menu next to the incident title. **Do subscribers get notified when I publish?** No. Publishing a post-mortem does not send email, SMS, Slack, or Teams notifications. To notify subscribers, post an **Update** on the incident with a short summary and a link to the post-mortem. **Can I publish a post-mortem through the API?** Not yet. The [Incidents API](https://hyperping.com/docs/api/incidents) manages incidents and their updates. Post-mortems are written in the dashboard. ## Next steps [ Publish incidents→ Post updates while you work through an incident. ](https://hyperping.com/docs/status-page/incidents)[ Post-mortem template→ Run the internal review before you write the public version. ](https://hyperping.com/docs/playbooks/post-mortem-template)[ Subscribers→ Email, Slack, Teams, and SMS notifications for your visitors. ](https://hyperping.com/docs/status-page/subscribers)[ Incident calendar→ Show past incidents on a monthly calendar. ](https://hyperping.com/docs/status-page/incident-calendar) [← Publish incidents](https://hyperping.com/docs/status-page/incidents)[Incident calendar →](https://hyperping.com/docs/status-page/incident-calendar) [](https://x.com/hyperping)[](https://www.linkedin.com/company/hyperping) © 2026 Hyperping --- Source: https://hyperping.com/docs/status-page/private-status-pages # Private status pages Protect your status pages with Password protection, Google SSO, email access codes, or single sign-on through your company's identity provider, over SAML or OpenID Connect. ![Page access options](https://hyperping.com/static/page-access-options-827a84623491e323f93a815b91cd5a64.png) Page access options in your status page settings Go to [Status Pages → Choose a status page → Settings → Page Access](https://app.hyperping.io/v2/statuspage) to configure access controls. > **Which access control should you pick?** > > Password protection is the simplest: one shared password. Email access codes restrict access to specific people or teams without requiring SSO infrastructure. Google SSO fits teams already using Google Workspace, and SSO connections cover enterprise identity providers like Entra ID, Okta and Auth0. Pro includes 3 public or private status pages, password protection, email access codes, and multilingual pages. Google SSO and SSO connections for status page visitors require Business; SSO connections are billed separately. ## Password protection Require a shared password to access your status page. Simple and effective for basic access control. Toggle "Password protection" and set your password. You can edit the password at any time. ## Google SSO Allow users to sign in with their Google account. Perfect for teams already using Google Workspace. #### Allowed domains You will need to add allowed email domains in order to let anyone with "@yourcompany.com" domains log in to the status page. 1. Open the allowed domains settings Go to Status Pages → Choose a status page → Settings → "Allowed emails domains" section. 2. Add a domain An email will be sent to this email address to confirm it. ## Email access codes Restrict access to specific email addresses or entire domains. Visitors enter their email, receive a 6-digit code, and are granted access once verified. Codes expire after 10 minutes. This is ideal when you want to restrict access to specific people or teams without requiring SSO infrastructure. ### Setting up access rules 1. Turn on the email whitelist Go to **Status Pages → Choose a status page → Settings → Users**, then toggle "Email whitelist" on. 2. Add your access rules Manage your access rules in the **Access rules** tab. You can add two types of rules: - **Allowed domains**: anyone with an email at that domain (e.g. `*@acme.com`) can request access. - **Individual emails**: whitelist specific email addresses. Use "Bulk add" to paste multiple emails at once. ![Email whitelist access rules](https://hyperping.com/static/email-whitelist-rules-6c1663e9ae39e06d561123f41f9d64a5.png) Access rules: allowed domains and individual emails ### How visitors sign in When a whitelisted user visits the protected status page, they enter their email address. If it matches a rule, a 6-digit access code is sent to their inbox. They enter the code and are granted a session. ![Email access code verification](https://hyperping.com/static/email-access-code-73387a270604649577d3c77c9097bedd.png) The 6-digit access code verification Sessions and active users can be monitored and revoked from the **Sessions** tab. ## SAML SSO Sign in with enterprise identity providers like Microsoft Entra ID, Okta, Google Workspace, Auth0, and any other SAML or OpenID Connect provider. The **SAML SSO** option covers both protocols, through reusable SSO connections that can protect multiple status pages. The full walkthrough, from creating a connection to attaching it to a page, is in [Status page SSO](https://hyperping.com/docs/status-page/sso). ### SSO Connections Create and manage SSO connections from **Status Pages → SSO Connections**. Each connection can be used on multiple status pages. ![New SSO connection dialog with the identity providers and their prices](https://hyperping.com/static/sso-connection-create-24e0705e606b08bcfa77a256659fe551.webp) Creating an SSO connection Click **New connection**, pick your identity provider, name the connection, and click **Create connection**. The connection card then guides you through the configuration for your provider. ### Pricing | Provider | Price | | --- | --- | | Direct SAML (Azure AD, Okta, Google Workspace) | $49/mo | | OpenID Connect (Auth0, Keycloak, Okta, Entra ID, and more) | $49/mo | | Other providers (JumpCloud, OneLogin, Ping Identity, etc.) | $99/mo | ## Next steps [ White labeling→ Remove Hyperping branding and send emails from your own domain. ](https://hyperping.com/docs/status-page/white-labeling)[ Custom domain→ Serve your status page from your own domain with automatic HTTPS. ](https://hyperping.com/docs/status-page/custom-domain)[ Subscribers→ Let visitors subscribe to updates over email, Slack, Teams, and SMS. ](https://hyperping.com/docs/status-page/subscribers)[ Go-live checklist→ Everything to verify before you announce your status page. ](https://hyperping.com/docs/status-page/go-live-checklist) [← Subscribers](https://hyperping.com/docs/status-page/subscribers)[Status page SSO →](https://hyperping.com/docs/status-page/sso) [](https://x.com/hyperping)[](https://www.linkedin.com/company/hyperping) © 2026 Hyperping --- Source: https://hyperping.com/docs/status-page/public-api # Status page public API Read your incidents and scheduled maintenances as JSON, straight from your status page. Every status page serves two public JSON endpoints alongside the page itself. They need no API key, they return the same history your visitors see, and they use the response shapes statuspage.io publishes, so integrations written against a statuspage.io page keep working once you switch. Reach for them when: - You are building your own status widget, banner, or in-app notice - An internal tool needs to mirror your incidents without scraping HTML - A dashboard tracks the status of several vendors, yours among them - You are migrating from statuspage.io and would rather not rewrite what already consumes the feed > **Not the same thing as the REST API** > > These endpoints are public, read-only, and scoped to one status page. To create incidents, manage subscribers, or read data across your whole account, use the authenticated [Status Pages REST API](https://hyperping.com/docs/api/statuspages) on `api.hyperping.io` instead. ## Endpoints | Endpoint | Returns | | --- | --- | | `GET /api/v1/incidents.json` | Incidents and outages | | `GET /api/v1/scheduled_maintenances.json` | Maintenance windows | Both live on your status page domain, so a page on `status.acme.com` serves `https://status.acme.com/api/v1/incidents.json`. The Hyperping-hosted slug works the same way. ## Incidents ```bash curl https://meta.hyperping.app/api/v1/incidents.json ``` **Response200 OK** ```json [ { "id": "6kddbqdycckq", "start_date": "2026-07-06T23:18:06.000Z", "end_date": "2026-07-07T00:38:17.000Z", "name": "EU voice call phone number unavailable", "title": { "en": "EU voice call phone number unavailable" }, "type": "incident", "status": "resolved", "link": "https://meta.hyperping.app/history/inci_MiabOZOm5ObN2h" } ] ``` ### Query parameters | Parameter | Type | Default | Description | | --- | --- | --- | --- | | `status` | string | all | Filter by incident status | | `type` | string | all | Filter by incident type | | `limit` | integer | 50 | Results per page, 50 maximum | | `page` | integer | 1 | Page number | ### Status values | Value | Meaning | | --- | --- | | `ongoing` | No resolved update yet | | `resolved` | Closed with a resolved update | | `investigating` | Currently being investigated | | `identified` | Cause has been identified | | `update` | Progress update posted | | `monitoring` | Fix deployed, watching for stability | ### Type values `outage` for service outages, `incident` for everything else. ### Examples - `/api/v1/incidents.json?status=ongoing` returns only what is unresolved right now - `/api/v1/incidents.json?type=outage&status=resolved` returns resolved outages - `/api/v1/incidents.json?limit=20&page=2` pages through the history ## Scheduled maintenances ```bash curl "https://meta.hyperping.app/api/v1/scheduled_maintenances.json?status=upcoming" ``` **Response200 OK** ```json [ { "id": "t4btxayrds4g", "start_date": "2026-08-15T14:30:00.000Z", "end_date": "2026-08-15T18:30:00.000Z", "name": "API infrastructure upgrade", "title": { "en": "API infrastructure upgrade" }, "status": "upcoming", "link": "https://meta.hyperping.app/history/mw_6ckvtMuyDhMfto" } ] ``` ### Query parameters Same `limit` and `page` as incidents, plus a `status` filter with its own values: | Value | Meaning | | --- | --- | | `upcoming` | Scheduled for the future | | `inprogress` | Running right now | | `completed` | Finished | | `all` | Every maintenance window | With no `status` parameter you get upcoming and ongoing windows only, which is what a "what is coming up" widget usually wants. ## Response fields | Field | Type | Description | | --- | --- | --- | | `id` | string | Stable identifier for the entry | | `start_date` | string | ISO 8601 start of the incident or window | | `end_date` | string | ISO 8601 end, once there is one | | `name` | string | Title in the page's default language | | `title` | object | Title keyed by language code, for [multilingual pages](https://hyperping.com/docs/status-page/languages) | | `type` | string | Incidents only: `outage` or `incident` | | `status` | string | Current status, from the values above | | `link` | string | Permalink to the entry on your status page | ## A live reference on your own page Every status page hosts its own copy of this reference at `/docs`, filled in with your domain. Send integrators to `https://status.acme.com/docs` and they get the endpoints, parameters, and example responses without needing a Hyperping account. ## Access and caching Both endpoints are open to anonymous requests on public pages and send `Access-Control-Allow-Origin: *`, so a browser front-end can call them directly without a proxy. On a [protected page](https://hyperping.com/docs/status-page/private-status-pages) they answer 401 unless the request carries a valid session, the same rule the [feeds](https://hyperping.com/docs/status-page/rss-atom-feeds) follow. Publishing an incident update clears the cache immediately, so a poller sees a new incident on its next request. ## Troubleshooting **The endpoint returns a 401** The status page is password or SSO protected. These endpoints only serve anonymous requests on public pages. **I get fewer results than expected** `limit` is capped at 50 per request. Page through with `page=2`, `page=3`, and so on rather than raising the limit. **Maintenance windows I know about are missing** Without a `status` parameter the endpoint returns upcoming and ongoing windows only. Add `?status=all` to include completed ones. **I need the current up or down state, not history** Use the [status.json endpoint](https://hyperping.com/docs/status-page/status-page-json). It returns a single indicator and an uptime percentage, which is what a badge or a health check wants. ## Next steps [ Status page JSON→ Current status and uptime in one small payload. ](https://hyperping.com/docs/status-page/status-page-json)[ RSS and Atom feeds→ The same history, for feed readers instead of code. ](https://hyperping.com/docs/status-page/rss-atom-feeds)[ Status Pages REST API→ The authenticated API for creating and managing pages. ](https://hyperping.com/docs/api/statuspages)[ Import from statuspage.io→ Move over and keep your existing integrations pointed at the same paths. ](https://hyperping.com/docs/status-page/import-from-statuspage) [← Status page JSON](https://hyperping.com/docs/status-page/status-page-json)[Footer badge →](https://hyperping.com/docs/status-page/footer-badge) [](https://x.com/hyperping)[](https://www.linkedin.com/company/hyperping) © 2026 Hyperping --- Source: https://hyperping.com/docs/status-page/rss-atom-feeds # RSS and Atom feeds Let anyone follow your incident history in a feed reader, without giving you an email address. Every status page can serve its incident history as an RSS feed and an Atom feed. Feed readers, Slack's built-in RSS app, internal dashboards, and vendor status aggregators poll them directly. Nobody subscribes, so there is no list to manage and nothing to unsubscribe from. Feeds are useful when: - Customers want incident updates but will not hand over an email address - You want incidents to land in a Slack channel through Slack's RSS app - You are moving from statuspage.io and people already poll your feed URL - An internal tool or an aggregator tracks the status of several vendors at once ## Feed URLs Both feeds live at fixed paths on your status page domain: | Format | URL | Content type | | --- | --- | --- | | RSS 2.0 | `/history.rss` | `application/rss+xml` | | Atom 1.0 | `/history.atom` | `application/atom+xml` | On a custom domain that gives `https://status.acme.com/history.rss`. The Hyperping-hosted slug works too: `https://acme.hyperping.app/history.rss`. These are the same paths statuspage.io uses, so feed readers and integrations pointed at your old page keep working once the domain points to Hyperping. See the [import guide](https://hyperping.com/docs/status-page/import-from-statuspage) for the rest of the migration. ```bash curl https://meta.hyperping.app/history.rss ``` ## Turn feeds on 1. Open your status page settings Go to [Status Pages](https://app.hyperping.io/v2/statuspage), pick your page, then open the **Notifications** category. 2. Enable RSS & Atom feeds Turn on the **RSS & Atom feeds** toggle. Both feed URLs appear underneath, with a copy button on each. 3. Publish Hit Publish. The feeds are live straight away. New status pages have feeds on by default. Pages created before feeds shipped keep them off until you flip the toggle, so an older page returns a 404 on both URLs until then. > **Available on every plan** > > Feeds are not a notification channel. They have no subscribers and cost nothing to serve, so they work on all plans and they are independent of the [Subscribers](https://hyperping.com/docs/status-page/subscribers) toggle. You can run a page with feeds on and subscriptions off. ## What the feed contains Each feed carries the 25 most recent incidents and maintenance windows, sorted by latest activity. An incident that gets a new update moves back to the top, so a reader surfaces it again instead of leaving it buried under newer entries. Every entry holds: - The incident title and a link to its page on your status page - A publication date (when the incident started) and an updated date (its most recent update) - The full update timeline in the body, newest first, each one labelled Investigating, Identified, Update, Monitoring, or Resolved - The list of affected services - For maintenance windows, the scheduled start and end ```markup Elevated API error rates https://status.acme.com/history/inc_8Kd2mQ https://status.acme.com/history/inc_8Kd2mQ Mon, 20 Jul 2026 15:41:00 GMT Jul 20, 17:03 UTC
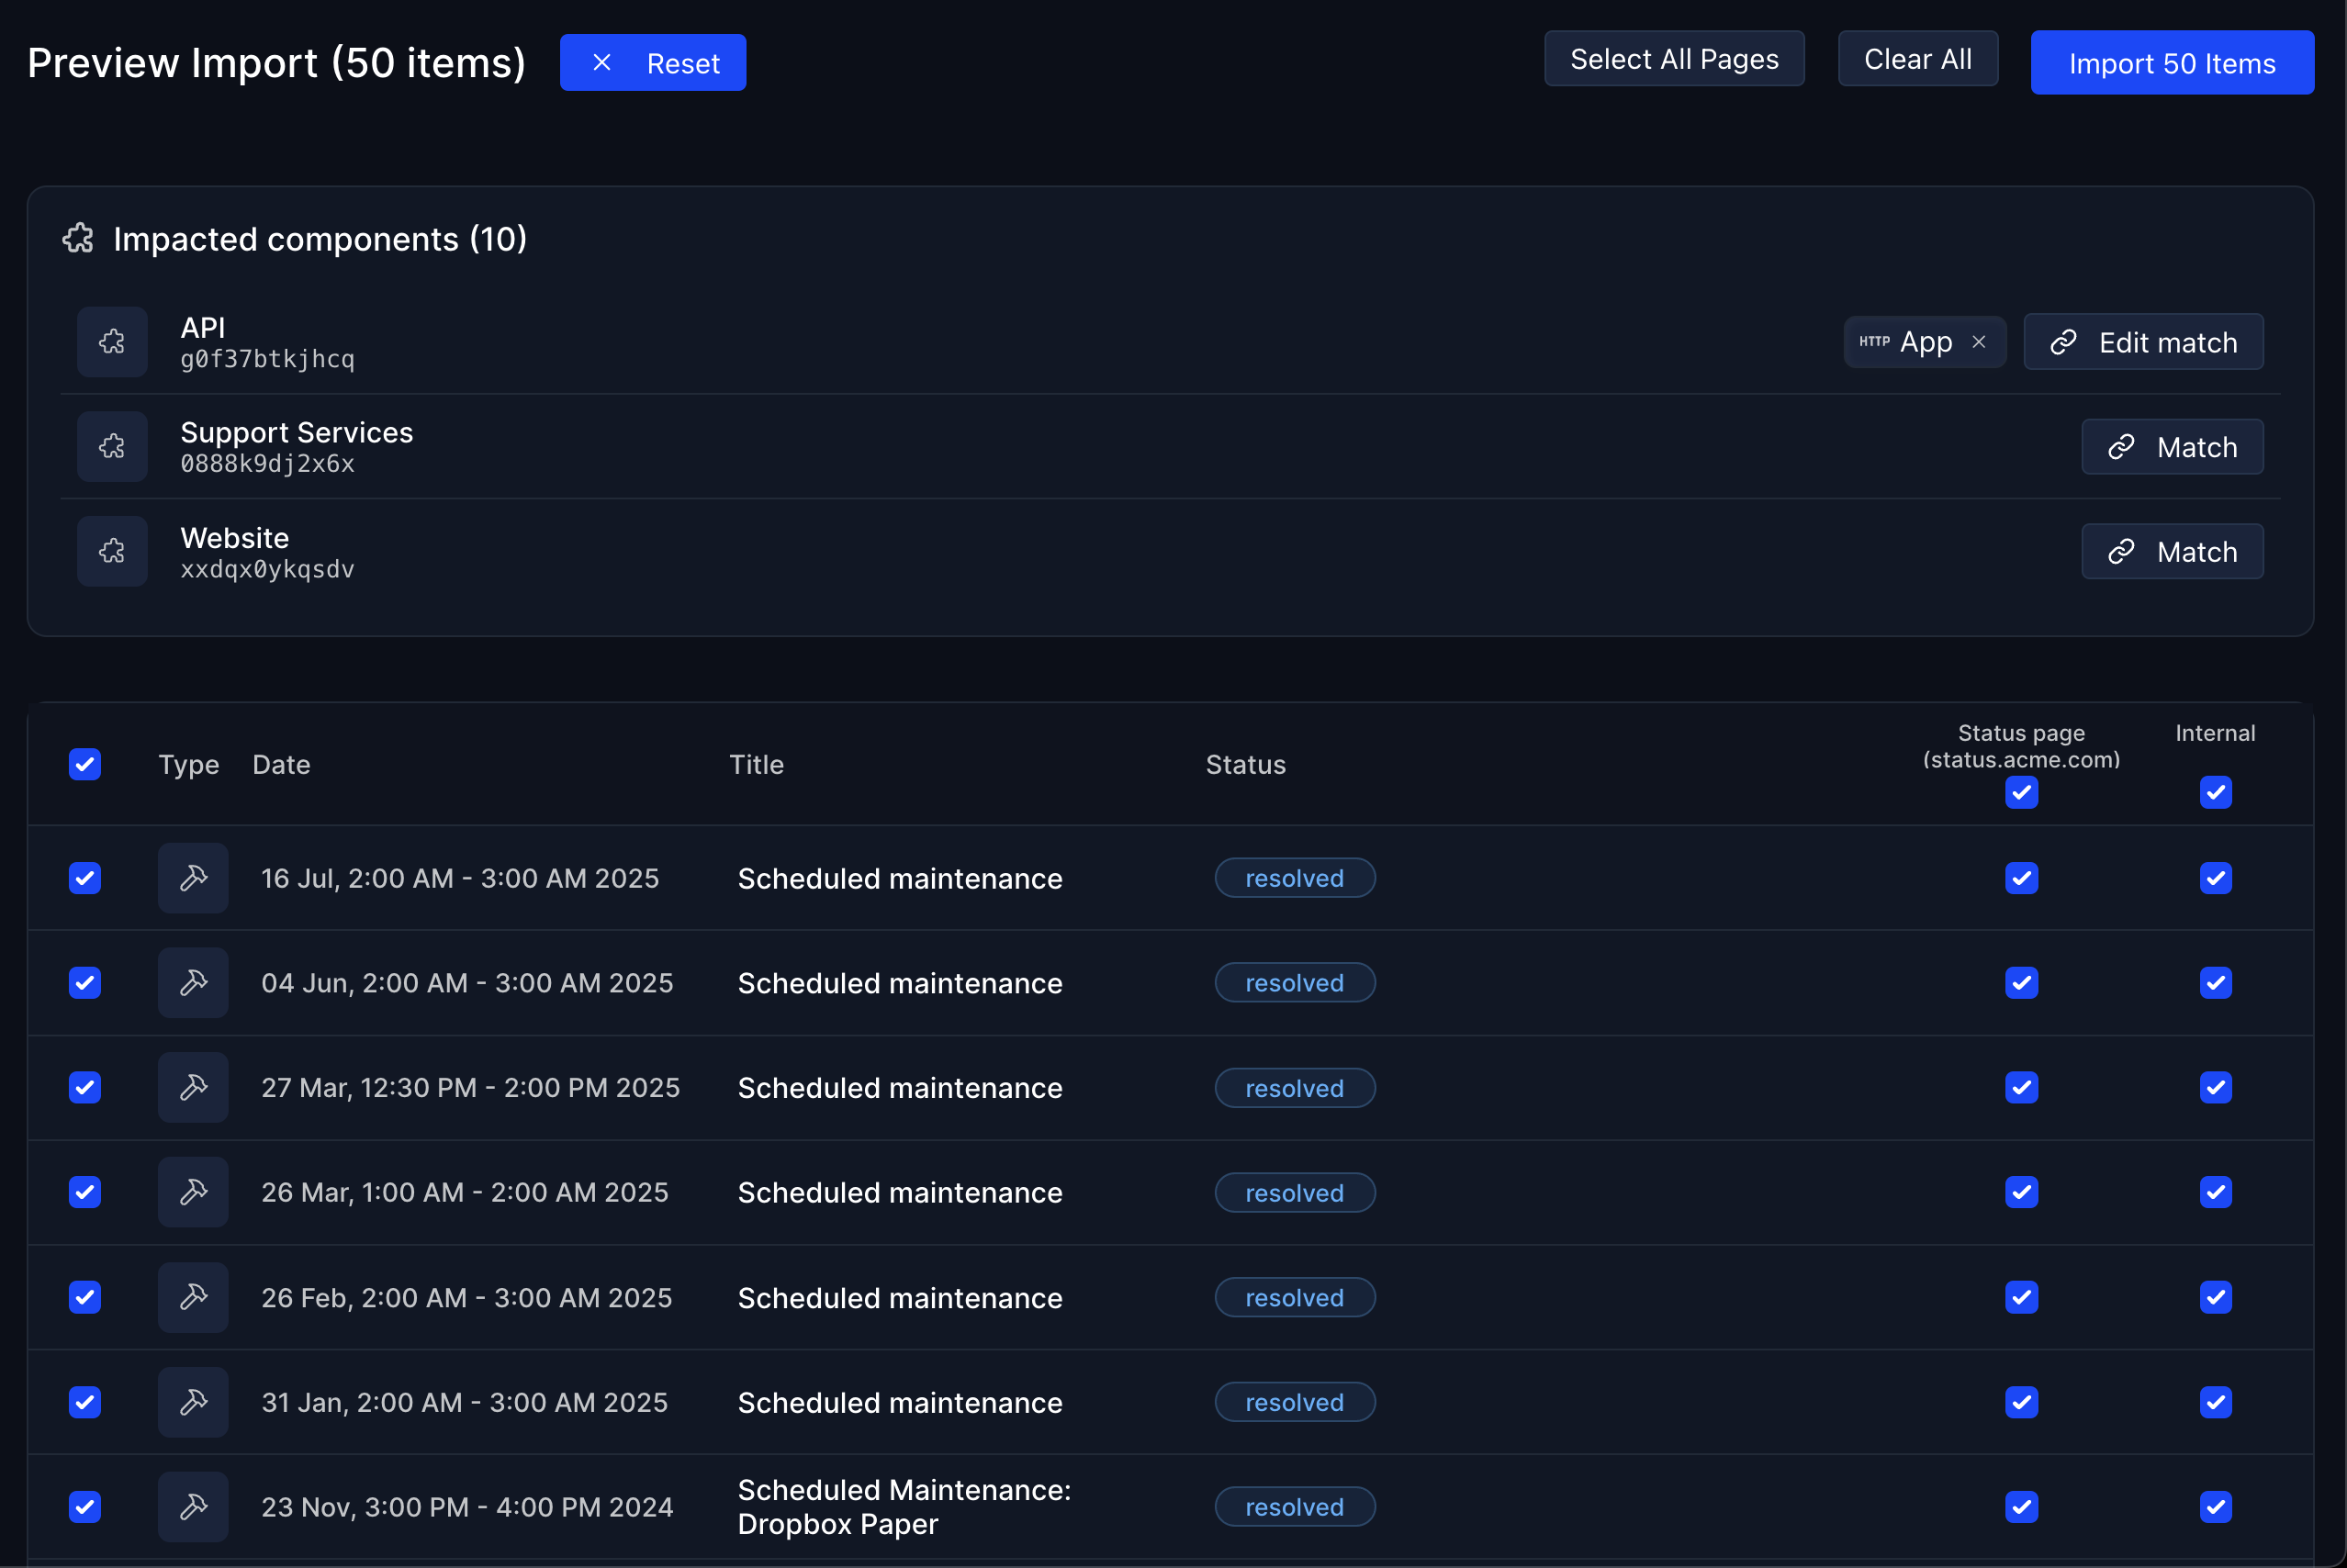
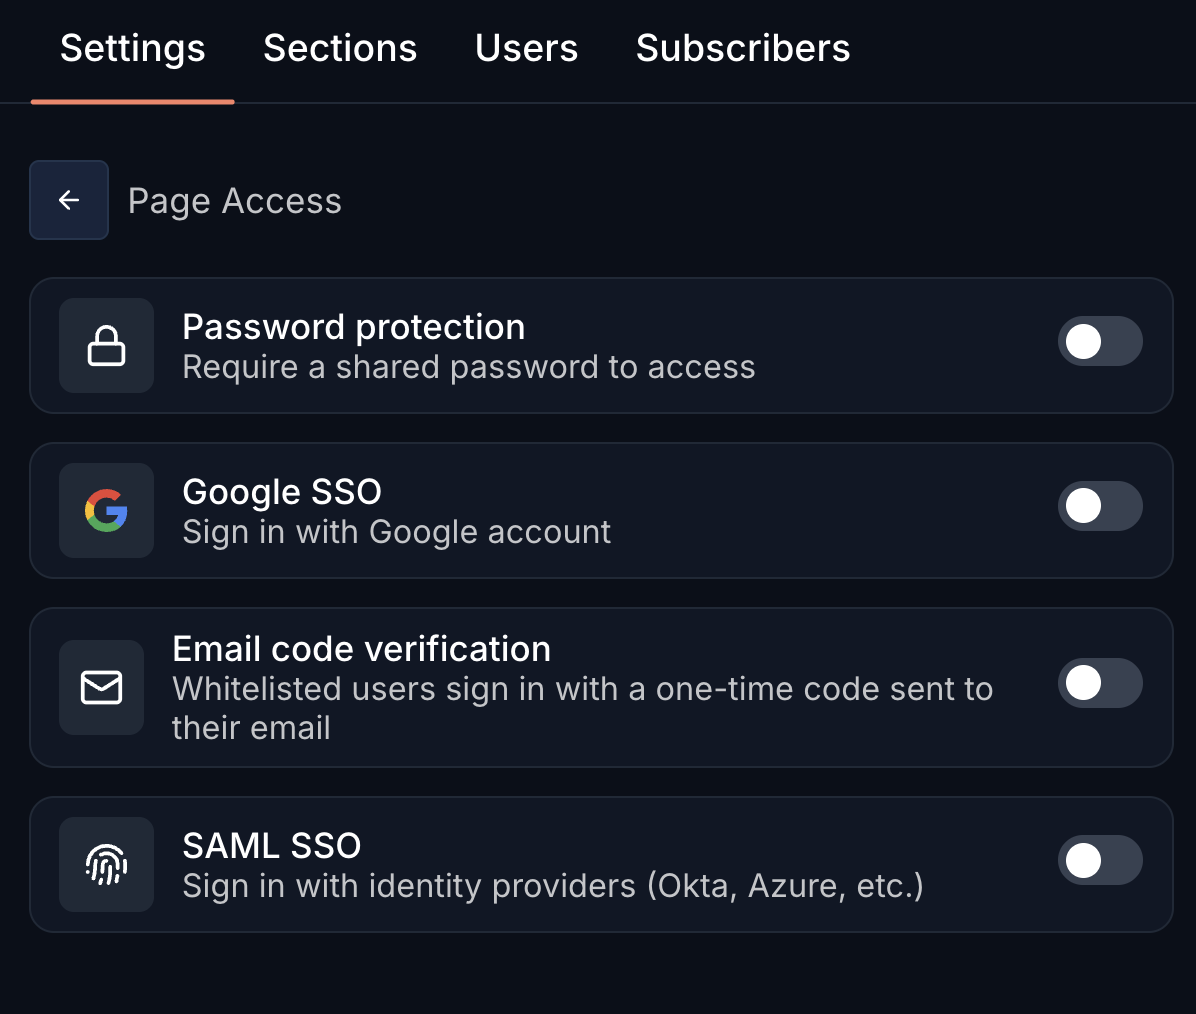
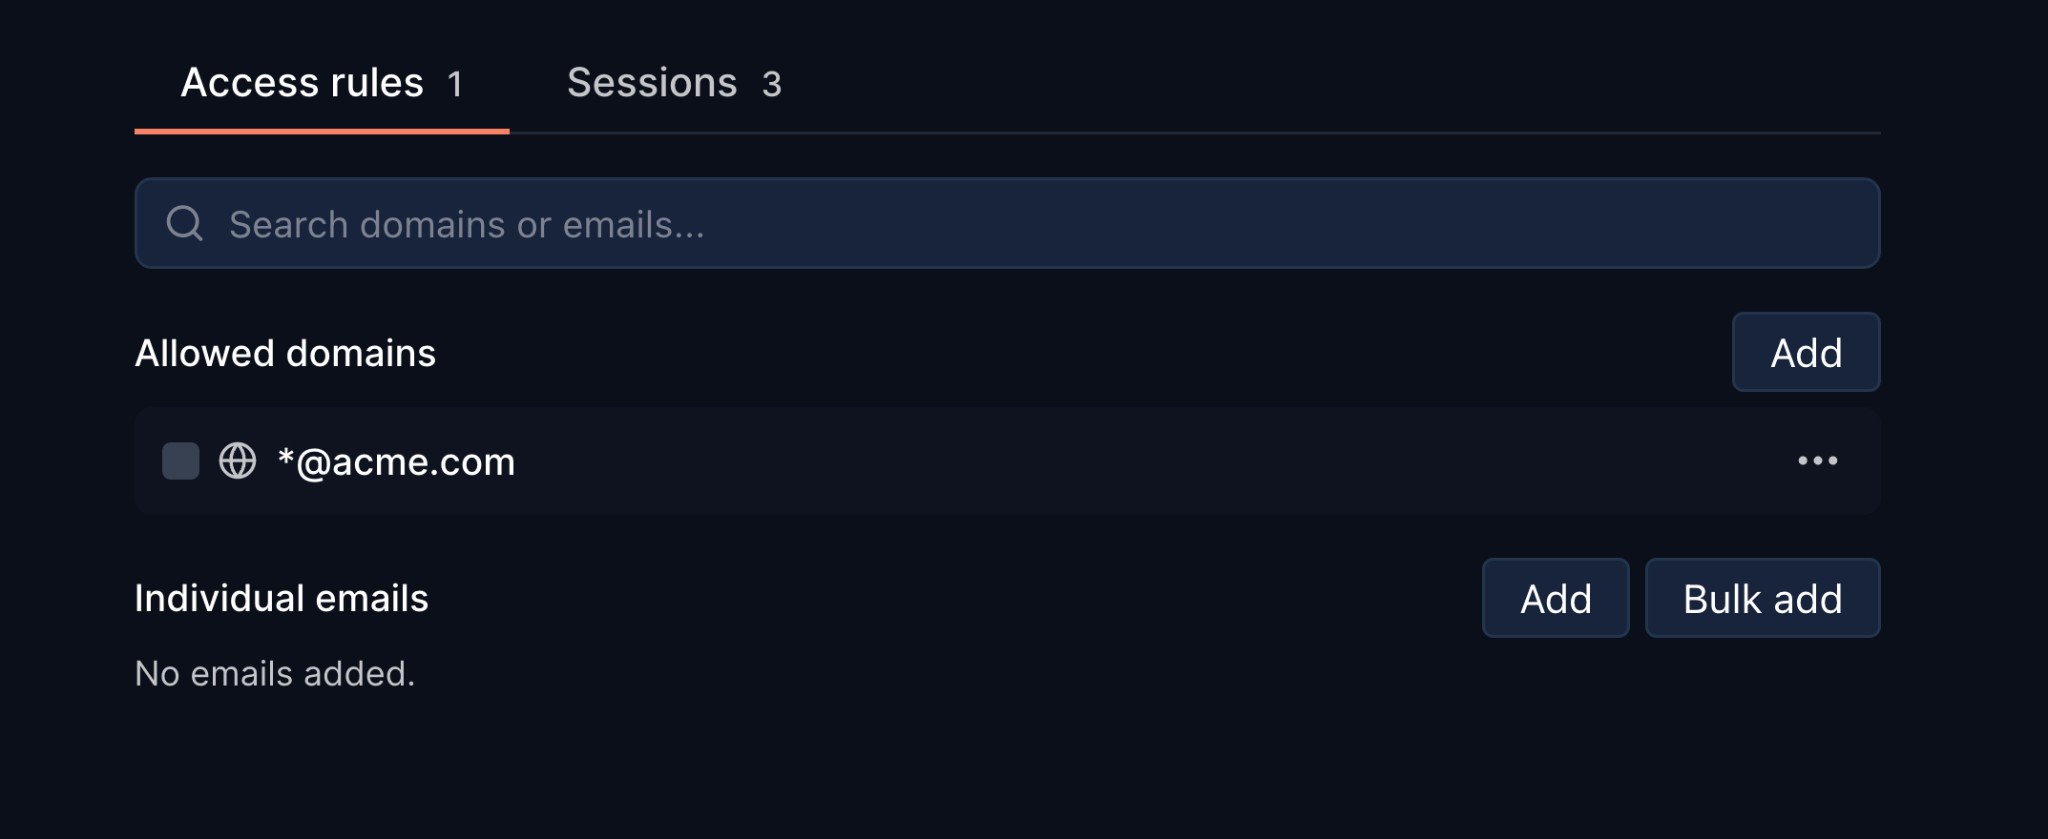
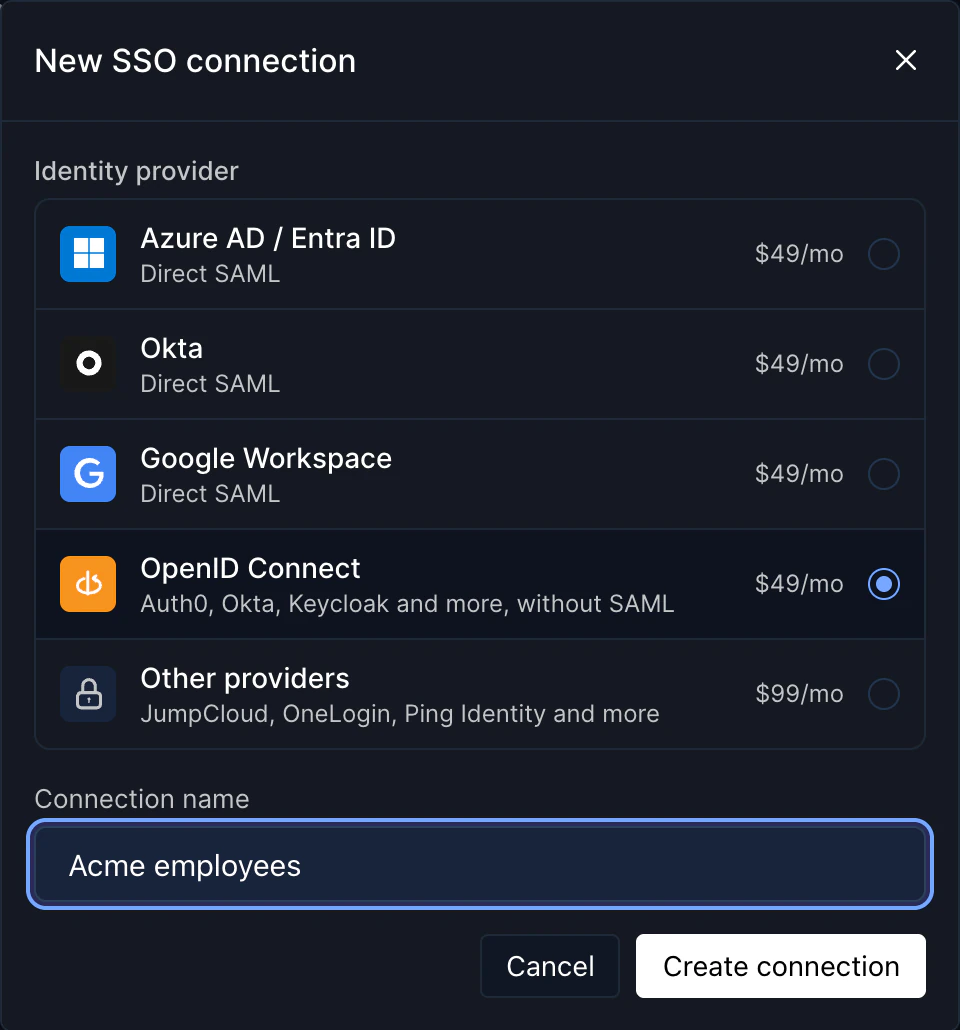
Resolved - Back to normal.

Jul 20, 16:12 UTC
Identified - A bad gateway deploy.

Affected services: API, Dashboard

]]>
``` Feeds cover incident history only. For the current up or down state of your services, use the [status.json endpoint](https://hyperping.com/docs/status-page/status-page-json) instead. ## Languages On a multilingual status page the feed is served in the page's default language, including the update labels. Add a `lang` parameter to get another one: `https://status.acme.com/history.rss?lang=fr` The value has to be one of the languages enabled on the page. Anything else falls back to the default, so a reader never gets an empty feed from a typo. ## Autodiscovery While feeds are on, your status page carries `` tags for both formats in its head. Point a feed reader at `https://status.acme.com` and it finds the feeds on its own, no exact URL needed. ## Caching and freshness Feeds are cached for 5 minutes at the edge, and the cache is cleared the moment you publish an incident update or save your page settings. In practice the delay your readers see comes from their own polling interval, which is usually somewhere between 15 and 60 minutes depending on the reader. > **Browser-based readers work too** > > Both feeds are served with `Access-Control-Allow-Origin: *`, so a reader running in the browser, or your own front-end, can fetch them cross-origin without a proxy. ## Private status pages On a [protected page](https://hyperping.com/docs/status-page/private-status-pages), both feed URLs answer 401 unless the request carries a valid session. Feed readers cannot sign in, so treat feeds as a public-page feature. The autodiscovery tags are left out of protected pages for the same reason. ## Troubleshooting **The feed URL returns a 404** Feeds are opt-in per page. Open the **Notifications** category of your status page settings and turn on **RSS & Atom feeds**. Pages created before the feature shipped default to off, which is the usual cause on an older status page. **The feed URL returns a 401** The page is password or SSO protected. Feeds only serve anonymous requests on public pages. **My reader shows an empty feed** The page has no incident or maintenance history yet, or its entries have no valid date. Feeds carry history, not live status: a page where everything is operational and nothing ever broke has an empty feed, and that is correct. **Old incidents disappeared from the feed** Feeds are capped at 25 entries. Older incidents stay on the status page and in the [incident calendar](https://hyperping.com/docs/status-page/incident-calendar), they just roll off the feed. **A new update is not showing up** Publishing an update clears our cache immediately, so the delay is on the reader's side. Most feed readers poll every 15 to 60 minutes and many let you refresh a feed by hand. Fetching the URL with curl tells you straight away whether the update is live on our end. ## Next steps [ Status page JSON→ The machine-readable endpoint for current status and uptime. ](https://hyperping.com/docs/status-page/status-page-json)[ Subscribers→ Email, Slack, Teams, and SMS notifications for incident updates. ](https://hyperping.com/docs/status-page/subscribers)[ Publish incidents→ Write the updates that end up in your feed. ](https://hyperping.com/docs/status-page/incidents)[ Import from statuspage.io→ Move your page over and keep your existing feed URLs working. ](https://hyperping.com/docs/status-page/import-from-statuspage) [← SMS notifications](https://hyperping.com/docs/status-page/sms-notifications)[Status page JSON →](https://hyperping.com/docs/status-page/status-page-json) [](https://x.com/hyperping)[](https://www.linkedin.com/company/hyperping) © 2026 Hyperping --- Source: https://hyperping.com/docs/status-page/sections # Status page sections Group your services into **Sections** to give your status page context and structure. > **Looking to fill your sections with services?** > > Read [how to add services](https://hyperping.com/docs/status-page/add-services) to your sections, with uptime and response time graphs. ![Status page sections interface](https://hyperping.com/static/sections-d0eb0a9211e1e1190b29ec39cc0f2977.webp) Sections in the status page builder ### Add a section You can add as many sections as you'd like. 1. Open the Sections tab Head to your status page's settings, then click on the **Sections** tab. 2. Name the section All it takes is a name, which is optional. It will be shown on top of the section inside your status page. ### Change section's order To change a section's order, click on the section's 3-dots icon, then click on either **Move up** or **Move down**. ### Delete a section To delete a section, click on the 3-dots icon at the right of a section, then click on **Delete**. ### Group services within sections You can create logical groups within sections to better organize related services. Groups help you: - Bundle microservices (auth, users, payments) - Organize by region (US-East, EU-West) - Group by team ownership - Keep related dependencies together ![Grouped services in status pages](https://hyperping.com/grouped-services-in-status-pages.png) Grouped services on a status page To create a group, click the "Add Group" button within any section. ## Next steps [ Add services→ Pick monitors to display, with uptime and response time graphs. ](https://hyperping.com/docs/status-page/add-services)[ Incident calendar→ A monthly calendar of incidents and maintenances on your page. ](https://hyperping.com/docs/status-page/incident-calendar)[ Custom domain→ Serve your page from your own domain with automatic SSL. ](https://hyperping.com/docs/status-page/custom-domain)[ Go-live checklist→ Everything to verify before you announce your status page. ](https://hyperping.com/docs/status-page/go-live-checklist) [← Components](https://hyperping.com/docs/status-page/components)[Custom domain →](https://hyperping.com/docs/status-page/custom-domain) [](https://x.com/hyperping)[](https://www.linkedin.com/company/hyperping) © 2026 Hyperping --- Source: https://hyperping.com/docs/status-page/seo-analytics # SEO and analytics Decide whether search engines index your status page, and measure the traffic it gets. A public status page is a real page on your domain, so search engines treat it like one. Most teams want that: someone searching "acme down" should land on your page rather than on a forum thread guessing. Some teams want the opposite, usually because the page is meant for a handful of enterprise customers who already have the URL. Both settings live in the **SEO & Analytics** category of your status page settings. ## Search engine indexing By default your status page is crawlable and can appear in search results. Turning on **Hide from search engines** flips the page's robots policy: | Setting | robots.txt served | | --- | --- | | Off (default) | Allows crawling of the whole page | | On | Disallows crawling of the whole page | ```markup User-agent: * Allow: / ``` You can check the result yourself at any time by opening `https://status.acme.com/robots.txt`. The change takes effect as soon as you publish. > **Hidden is not private** > > A robots policy is a request to well-behaved crawlers, not an access control. Anyone with the URL still reaches the page, and pages already indexed can take a while to drop out of results. If the page should not be readable by strangers, use a [private status page](https://hyperping.com/docs/status-page/private-status-pages) with a password, email codes, or SSO. > **Plan availability** > > Hide from search engines requires the Pro plan. Google Analytics works on every plan. ## Google Analytics Add your measurement ID and Hyperping loads Google Analytics on your status page, so status page traffic shows up next to the rest of your site. 1. Open SEO & Analytics Go to [Status Pages](https://app.hyperping.io/v2/statuspage), pick your page, then open the **SEO & Analytics** category. 2. Turn Google Analytics on Flip the toggle and paste your measurement ID. A GA4 ID looks like `G-XXXXXXXXXX`. Older Universal Analytics IDs (`UA-XXXXXX-YY`) are accepted too. 3. Publish and verify Hit Publish, open your status page, and check the realtime report in Google Analytics. Traffic should appear within a minute. Page views are what makes this worth setting up: a spike on your status page is an early signal that something is wrong, often before your support inbox catches up. ## Social previews Your status page generates its own preview image for links shared in Slack, X, LinkedIn, and iMessage, built from the page name and the [favicon](https://hyperping.com/docs/status-page/create-status-page) you uploaded. There is nothing to configure. Setting a favicon and a clear page name is what makes the preview look right. ## Getting found Indexing is only half of it. What actually brings people to a status page during an incident: - Serve it from your own domain, typically `status.acme.com`. A [custom domain](https://hyperping.com/docs/status-page/custom-domain) ranks and reads better than a shared one. - Link it from your app footer, your docs, and your support pages, so it is one click away from wherever a confused user already is. - Give your services the names your customers use, not your internal ones. Someone searching for "checkout" will not find "svc-payments-edge". - Add the [footer badge](https://hyperping.com/docs/status-page/footer-badge) to your marketing site, which links back and shows live status at the same time. ## Troubleshooting **My status page still shows in Google after hiding it** Search engines drop pages on their own schedule, which can take weeks. To speed it up, request removal through Google Search Console. Check `/robots.txt` on your page first to confirm the disallow is being served. **Google Analytics shows no traffic** Check the ID for a typo, confirm you published after saving, and remember that ad blockers and privacy-focused browsers block Analytics, so status page numbers skew low the same way the rest of your site does. **My status page is not indexed at all** Confirm **Hide from search engines** is off, then check that the page is reachable without a password. A [protected page](https://hyperping.com/docs/status-page/private-status-pages) is never indexed, whatever the SEO setting says. **The link preview shows the wrong logo** The preview is built from your favicon. Upload a square favicon in the **Appearance** settings, publish, then re-share the link. Slack and other platforms cache previews, so an old one can stick around for a while. ## Next steps [ Custom domain→ Serve the page from your own domain with automatic HTTPS. ](https://hyperping.com/docs/status-page/custom-domain)[ Private status pages→ Real access control when hiding is not enough. ](https://hyperping.com/docs/status-page/private-status-pages)[ Footer badge→ Link back from your site with live status built in. ](https://hyperping.com/docs/status-page/footer-badge)[ Go-live checklist→ Everything to verify before you announce your page. ](https://hyperping.com/docs/status-page/go-live-checklist) [← Footer badge](https://hyperping.com/docs/status-page/footer-badge)[How we calculate uptime →](https://hyperping.com/docs/status-page/uptime-calculation) [](https://x.com/hyperping)[](https://www.linkedin.com/company/hyperping) © 2026 Hyperping --- Source: https://hyperping.com/docs/status-page/sms-notifications # How to setup SMS notifications for status page subscribers Connect your own Twilio account to send status updates to your subscribers via SMS. You will be billed directly to your Twilio account. To follow this tutorial, you will need a Hyperping account, which you can create from the [Hyperping new account registration page](https://app.hyperping.io/register) if you don't already have one. > **A US toll-free number is created for you** > > We automatically create a US toll-free phone number after you connect your account. [Twilio charges $2 per month](https://www.twilio.com/sms/pricing/us) for this service. ### Connect Twilio 1. Connect your Twilio account The Twilio setup is made at the project level, from the [Integrations page](https://app.hyperping.io/integrations), since a project can contain multiple status pages. The Twilio Connect button will redirect you to the authentication page. If you aren't signed up yet, a registration form will be presented to you. By granting Hyperping permission to your account, you allow us to buy and send SMS via your account. ![Twilio integration card showing the connected state and its phone number](https://hyperping.com/static/sms-connect-twilio-48aad51380a52221f6f7051f6c81f2f1.webp) Twilio connected in the Integrations page, with the auto-created toll-free number 2. Enable SMS notifications for your status page Once your Twilio account is connected, open any status page of the project and go to **Settings → Notifications**. Under Subscription channels, enable **SMS**. ![Subscription channels panel with the SMS toggle enabled](https://hyperping.com/static/sms-enable-notifications-63dfc40a51f380069f105de239b897c8.webp) The SMS channel in your status page's Notifications settings 3. Let visitors subscribe by SMS Once enabled, your status page will give the visitors the option to subscribe to status updates using their own number. ![Status page SMS subscription form](https://hyperping.com/static/status-page-phone-number-512ce9270ee683103811c9396d26c37b.png) The phone number subscription option on your status page ## Next steps [ Subscribers→ Email, Slack, Teams and SMS notification channels for your status page. ](https://hyperping.com/docs/status-page/subscribers)[ Publish incidents→ The updates your SMS subscribers get notified about. ](https://hyperping.com/docs/status-page/incidents)[ Private status pages→ Control who can access your status page. ](https://hyperping.com/docs/status-page/private-status-pages)[ Go-live checklist→ Everything to verify before you announce your status page. ](https://hyperping.com/docs/status-page/go-live-checklist) [← Multi-language status pages](https://hyperping.com/docs/status-page/languages)[RSS and Atom feeds →](https://hyperping.com/docs/status-page/rss-atom-feeds) [](https://x.com/hyperping)[](https://www.linkedin.com/company/hyperping) © 2026 Hyperping --- Source: https://hyperping.com/docs/status-page/sso # Status page SSO Put a private status page behind your identity provider, so only people who can sign in to it can see the page. You create a reusable SSO connection once, over SAML or OpenID Connect, then attach it to as many status pages as you need. ![The SSO Connections page with an OpenID Connect connection, an Entra ID connection, and an Okta connection that still needs setup](https://hyperping.com/static/sso-connections-list-8ea6ca9099859e9285df31c98cce6200.webp) SSO connections are managed in one place and reused across status pages > **This is separate from dashboard SSO** > > Status page SSO controls who can view a status page. It never creates Hyperping accounts: visitors get a viewer session after signing in. To let your own team sign in to the Hyperping dashboard through your IdP, see [SAML SSO](https://hyperping.com/docs/projects/saml-sso) or [OpenID Connect SSO](https://hyperping.com/docs/projects/oidc-sso) instead. ## Prerequisites - A Hyperping **Business** plan. See [pricing](https://hyperping.com/pricing) for plan details. - A [private status page](https://hyperping.com/docs/status-page/private-status-pages), or a page you want to make private. - Admin access to your identity provider. ## Pick a connection type The **New SSO connection** dialog lists five connection types, each billed monthly per connection: | Connection type | Protocol | Price | | --- | --- | --- | | **Azure AD / Entra ID** | Direct SAML | $49/mo | | **Okta** | Direct SAML | $49/mo | | **Google Workspace** | Direct SAML | $49/mo | | **OpenID Connect**: Auth0, Keycloak, Okta, Entra ID and any other OpenID Connect provider | OpenID Connect | $49/mo | | **Other providers**: JumpCloud, OneLogin, Ping Identity and other SAML providers | SAML, set up in a hosted portal | $99/mo | One connection can protect several status pages, and you pay once per connection. Okta and Entra ID work over SAML or OpenID Connect: pick the protocol your identity team prefers. On plans that include SSO connections, the dialog shows **Included** instead of a price. ## Step 1: Create the SSO connection Go to [Status Pages → SSO Connections](https://app.hyperping.io/v2/statuspage/sso-connections) to manage your connections. 1. Create the connection Click **New connection**, pick the identity provider, give the connection a **Connection name** such as "Acme employees", and click **Create connection**. ![New SSO connection dialog with OpenID Connect selected and the connection name Acme employees](https://hyperping.com/static/sso-connection-create-24e0705e606b08bcfa77a256659fe551.webp) The New SSO connection dialog, with the price of each connection type The new card shows **Setup required** until you configure the connection. Follow the section below that matches its type. ## Step 2a: Configure an Azure AD / Entra ID connection Click **Configure** on the connection card. Under **1\. In your identity provider**, the dialog shows the two values to copy into an Entra enterprise application: | Entra field | Value | | --- | --- | | **Identifier (Entity ID)** | `https://api.hyperping.io/statuspage/saml/sp` | | **Reply URL (Assertion Consumer Service URL)** | `https://api.hyperping.io/v1/auth/sso/statuspage/azure/callback` | > **These values differ from dashboard SSO** > > Status page SAML uses its own entity ID and reply URL. If you already created a SAML app for dashboard sign-in, create a second one for the status page: the two cannot share an app. This applies to every SAML provider. 1. Create the enterprise application In the [Microsoft Entra admin center](https://entra.microsoft.com), create a non-gallery enterprise application, open its **Single sign-on → SAML** settings, and paste the two values above. The app creation flow is the same as in the [Entra ID guide](https://hyperping.com/docs/sso/entra-id). 2. Assign users Under **Users and groups**, assign the people or groups who should be able to view the status page. 3. Paste the metadata into Hyperping Copy the **App Federation Metadata Url** from the **SAML Certificates** section and paste it into **Federation Metadata URL**. To type the **Login URL (SSO URL)** and **Azure AD Identifier (Issuer)** yourself, click **Enter the values manually instead**. ![Configure Azure AD / Entra ID dialog with the entity ID, the reply URL and the Federation Metadata URL field](https://hyperping.com/static/sso-connection-azure-config-a1715b05d41a6e6a03f4b49d69c5a474.webp) The Azure AD / Entra ID dialog: the values to copy, then the metadata URL 4. Check, save and test Click **Check values**, then **Save configuration**. Then click **Test connection** to run a real sign-in against your tenant. The card shows **Test passed** under **Last test** once it works. ## Step 2b: Configure an Okta or Google Workspace connection Okta and Google Workspace connections are Direct SAML too, and work like Azure AD: click **Configure** on the connection card and follow the steps listed in the dialog. 1. Create the SAML app in your IdP In Okta, create a **SAML 2.0** app integration. In Google Admin, add a **custom SAML app**. Paste the two values shown in the dialog (entity ID and ACS URL), and send the user's email as the **Name ID**. 2. Assign users Assign the people or groups who should be able to view the status page. In Google Workspace, also turn the app **ON** under **User access**: new apps are off for everyone by default. 3. Paste the metadata into Hyperping For Okta, paste the app's **Metadata URL** from the **Sign On** tab. For Google, upload the **GoogleIDPMetadata.xml** file. You can also enter the SSO URL and issuer manually. 4. Check, save and test Click **Check values**, then **Save configuration**, then **Test connection**. The card shows **Test passed** once it works. Step-by-step IdP screens are in the [Okta](https://hyperping.com/docs/sso/okta) and [Google Workspace](https://hyperping.com/docs/sso/google-workspace) guides. Use the values from the status page dialog, not the dashboard ones. ## Step 2c: Configure an OpenID Connect connection Use this type for Auth0, Keycloak, or any provider your identity team runs over OpenID Connect, Okta and Entra ID included. 1. Create the application in your identity provider Click **Configure** on the connection card and pick your provider at the top of the dialog: **Auth0**, **Okta**, **Microsoft Entra ID** or **Other**. Follow the steps listed for it: create a web application with a client secret, and register this callback URL in it: `https://api.hyperping.io/v1/auth/sso/oidc/callback` 2. Decide who can view the page Everyone who can sign in to this application can view the status pages that use the connection. Assign the right people or groups in your identity provider. In Auth0, keep only the right connections on the application's **Connections** tab, as the [Auth0 guide](https://hyperping.com/docs/sso/auth0) explains. 3. Paste the values into Hyperping Fill in the issuer (**Domain** for Auth0), the **Client ID** and the **Client secret**. Click **Check values**, then **Save configuration**. ![Configure dialog of an OpenID Connect connection with the Auth0 steps, the callback URL, and the domain, client ID and client secret fields](https://hyperping.com/static/sso-connection-oidc-config-f8059afcbea90f65b1a8823f2fddad2f.webp) An OpenID Connect connection for Auth0, with the values checked 4. Test the sign-in Click **Test sign-in** in the dialog, or **Test connection** on the card, and sign in in the popup. The test checks the code exchange, the token signature, the issuer, the audience and the email, and shows the address your provider sent. ![Test connection report for the Acme employees connection: Sign-in works, with nine passed checks](https://hyperping.com/static/sso-connection-oidc-test-3b34eb1d5705a1bf46d80dade6d28a1b.webp) A passing test on an OpenID Connect connection Unlike SAML, the callback URL is the same for dashboard and status page sign-in, so an application you already use for [dashboard OpenID Connect sign-in](https://hyperping.com/docs/projects/oidc-sso) also works here. Create a separate application when the status page has a different audience. ## Step 2d: Configure an Other providers connection For JumpCloud, OneLogin, Ping Identity and other SAML providers, the IdP-side configuration happens in a hosted setup portal rather than in Hyperping. 1. Fill in the organization details Click **Configure** on the connection card. Enter your **Organization name** and the **Allowed domains** as a comma-separated list, for example `company.com, corp.company.com`. 2. Run the guided setup Click **Continue to setup**. The portal walks through your specific provider: which app to create, which values to paste, and a check of the connection at the end. Reopen it any time from the card, with **Continue setup** or **Manage**. ## Step 3: Attach the connection to a status page Go to [Status Pages → Choose a status page → Settings → Page Access](https://app.hyperping.io/v2/statuspage) to protect the page. 1. Turn on SSO for the page In the page's access settings, turn on the **SAML SSO** toggle. It covers every connection type, OpenID Connect included. 2. Pick the connection Select your connection in the **SSO Connection** dropdown. Only configured connections are listed, and a warning appears when the selected one has not passed a test yet. Repeat this on every status page the connection should protect. ## How visitors sign in On the protected status page, visitors click **Sign in with SAML SSO** and enter their email, and Hyperping sends them to your identity provider. The button keeps this label for OpenID Connect connections too. After a successful sign-in, they get a viewer session and land back on the page. Your identity provider decides who gets in: anyone it signs in for the application can view the page. When a connection has allowed domains, the visitor's email must also be at one of them. No Hyperping account is created, and visitors never appear in your Teammates list. ## Troubleshooting **The page says "This connection is not configured yet"** The connection was created but never completed. Open **Status Pages → SSO Connections**, finish the configuration, then test it from the card. **A visitor signs in but is denied access** Their email domain is not in the connection's allowed domains. Add the domain on the connection, or check that the visitor used their work account at the IdP. **People outside the company can view the page** Your identity provider let them sign in to the application. Restrict the application's assignments, or in Auth0 its **Connections** tab, where Google social login is often enabled by default. **I can't delete a connection** A connection that still protects status pages cannot be deleted. Remove SSO from those pages first, then delete the connection. **Do I need SSO for a simple internal page?** Maybe not. [Private status pages](https://hyperping.com/docs/status-page/private-status-pages) also support password protection, email access codes, and Google sign-in, with no per-connection fee. ## Next steps [ Private status pages→ All the access controls: password, email codes, Google, and SSO. ](https://hyperping.com/docs/status-page/private-status-pages)[ Auth0→ Set up an Auth0 application for status page or dashboard sign-in. ](https://hyperping.com/docs/sso/auth0)[ White labeling→ Remove Hyperping branding and send emails from your own domain. ](https://hyperping.com/docs/status-page/white-labeling)[ Dashboard SSO→ Let your own team sign in to Hyperping through your IdP. ](https://hyperping.com/docs/projects/login-methods) [← Private status pages](https://hyperping.com/docs/status-page/private-status-pages)[White labeling →](https://hyperping.com/docs/status-page/white-labeling) [](https://x.com/hyperping)[](https://www.linkedin.com/company/hyperping) © 2026 Hyperping --- Source: https://hyperping.com/docs/status-page/status-page-json # Status page's JSON data via API Access your status page data programmatically through a public JSON endpoint. Every Hyperping status page exposes a `/status.json` endpoint that returns the current status and uptime of your services in a machine-readable format. This lets you integrate your status page data into dashboards, internal tools, or automated checks without scraping the HTML page. The JSON endpoint is useful when: - You want to display your current status on your own website or dashboard - You need automated scripts to check your service health - You are building internal tooling that reacts to status changes - You want a lightweight way to monitor your overall status from a third-party system ## Access the endpoint Append `/status.json` to your status page URL. For example: ```bash curl https://meta.hyperping.app/status.json ``` **Response200 OK** ```json { "indicator": "up", "uptime": "99.967%" } ``` Try it live: [https://meta.hyperping.app/status.json](https://meta.hyperping.app/status.json). If your status page uses a custom domain like `status.yourcompany.com`, the endpoint would be `status.yourcompany.com/status.json`. ## Response format The endpoint returns a JSON object with two fields: | Field | Type | Description | | --- | --- | --- | | `indicator` | string | Current top-level status of your status page | | `uptime` | string | Average uptime across services with "Show uptime" enabled, over the past 90 days | ## Indicator values The `indicator` field reflects the overall status of your status page. The value is determined by the highest-priority condition, checked in this order: | Indicator | Priority | Condition | | --- | --- | --- | | `maintenance` | 1 (highest) | At least one service is under maintenance | | `incident` | 2 | At least one (but not all) services have a downtime or are part of an incident | | `outage` | 3 | All services have a downtime or are part of an incident | | `up` | 4 (lowest) | All services are operational | ## Integration examples **Embed status in a dashboard**: Fetch the JSON endpoint on a timer and display the indicator and uptime values in your internal dashboard or Grafana panel. **Automated health checks**: Use a cron job or CI/CD pipeline step to poll the endpoint and fail a build or trigger an alert if the indicator is not `up`. **Slack bot or chatops**: Build a simple bot that queries the endpoint and posts the current status to a Slack channel on demand. ## Troubleshooting **The endpoint returns a 404** Verify your status page URL is correct and that the page is published. The JSON endpoint is only available on active status pages. **Uptime shows as "N/A"** Make sure at least one service on your status page has the "Show uptime" option enabled. The uptime value is calculated only from services with this option turned on. **The indicator does not update immediately** The JSON endpoint reflects real-time status. If the indicator seems stale, check that your monitors are correctly linked to the status page services and that incidents are being created automatically. ## Next steps [ Footer badge→ Embed a live status badge powered by this endpoint on your website. ](https://hyperping.com/docs/status-page/footer-badge)[ How we calculate uptime→ The math behind the uptime percentage the endpoint returns. ](https://hyperping.com/docs/status-page/uptime-calculation)[ Add services→ Choose your services and enable the "Show uptime" option. ](https://hyperping.com/docs/status-page/add-services)[ Create a status page→ Set up and publish the status page behind the endpoint. ](https://hyperping.com/docs/status-page/create-status-page) [← RSS and Atom feeds](https://hyperping.com/docs/status-page/rss-atom-feeds)[Status page public API →](https://hyperping.com/docs/status-page/public-api) [](https://x.com/hyperping)[](https://www.linkedin.com/company/hyperping) © 2026 Hyperping --- Source: https://hyperping.com/docs/status-page/subscribers # Subscribers Allow your status page visitors to subscribe via their preferred channels. They will be notified when you publish incident updates to your status page. ![Subscribers interface](https://hyperping.com/static/subscribers-6a001b8010be859f2e4c8bed0c912a62.webp) The subscription options visitors see on your status page ## Notification channels Subscribers is an optional feature. You can select none, or up to 4 different notification channels: email, Slack, Microsoft Teams, or SMS. Visitors who would rather not subscribe at all can follow your incident history through [RSS and Atom feeds](https://hyperping.com/docs/status-page/rss-atom-feeds), which sit in the same Notifications settings and work independently of this toggle. ### Slack Subscribers can choose to receive notifications via a Slack channel. When clicking on "Get updates via Slack", the user will be redirected to a Slack authentication page, and they will be invited to select which channel they want to receive notifications to. ### Microsoft Teams Subscribers can receive notifications directly in their Microsoft Teams channels. To set up Teams notifications, users need to: 1. Create a new workflow in Teams Go to [Teams](https://teams.microsoft.com/v2/) and create a new workflow by clicking "+ New flow". 2. Pick the webhook template Select the "Post to a channel when a webhook request is received" template. 3. Copy the webhook URL Create the flow and copy the provided webhook URL. 4. Paste it in the subscription form Paste the webhook URL in the subscription form on your status page. ### SMS To enable SMS notifications, you will need to connect your own Twilio account. [Read the docs here.](https://hyperping.com/docs/status-page/sms-notifications) ## Manually add/import subscribers You can manually add subscribers via your status page's settings, in the "Subscribers" tab. You can add up to 500 email addresses at once, with each address either on a new line or separated by commas. Only email subscribers can be added manually: Slack, Teams and SMS subscribers must subscribe through their respective channels. ![Subscribers list in the status page builder with email and Slack subscribers](https://hyperping.com/static/subscribers-list-1f94f4672d64a4d165dc6c5c946707be.webp) The Subscribers tab: everyone subscribed to this page, by channel > **Importing a large list?** > > If you have a large volume, do not hesitate to ask us via the chat or via email to help you import them. To import or manage subscribers programmatically, use the [Subscribers API](https://hyperping.com/docs/api/statuspages/subscribers/list). ## Subscribe to specific updates Users can choose to subscribe to updates for specific services on your status pages. When you create an incident and select affected services, notifications will only be sent to subscribers of those specific services. ## Delete subscribers To delete subscribers: 1. Select the subscribers Select one or multiple subscribers using the checkboxes. 2. Delete them Click the Delete icon (trash can) in the top bar. ## Next steps [ SMS notifications→ Connect your Twilio account so subscribers can get text message updates. ](https://hyperping.com/docs/status-page/sms-notifications)[ Publish incidents→ Report incidents, post updates, and notify subscribers at every step. ](https://hyperping.com/docs/status-page/incidents)[ Private status pages→ Control who can access your status page in the first place. ](https://hyperping.com/docs/status-page/private-status-pages)[ Go-live checklist→ Everything to verify before you announce your status page. ](https://hyperping.com/docs/status-page/go-live-checklist) [← Custom domain](https://hyperping.com/docs/status-page/custom-domain)[Private status pages →](https://hyperping.com/docs/status-page/private-status-pages) [](https://x.com/hyperping)[](https://www.linkedin.com/company/hyperping) © 2026 Hyperping --- Source: https://hyperping.com/docs/status-page/uptime-calculation # How we calculate uptime Your uptime percentage is the number customers, auditors, and your own team rely on. This page explains exactly where it comes from, so you can trust it and defend it. ## What counts as up and down A monitor is up or down based on confirmed checks. When a check fails, Hyperping re-runs it from your other selected regions, and only a confirmed failure marks the monitor as down. See [how a check works](https://hyperping.com/docs/monitoring) for the full loop. An outage opens the moment a failure is confirmed, and it closes when your service responds again and recovery is confirmed. The time between those two points is the outage's duration, and that duration is what drives the uptime number. ## The formula For any time window, uptime is the share of that window your monitor spent up: **Uptime % = (window duration - cumulative outage duration) / window duration** Every confirmed outage inside the window contributes its duration. No outages means 100%. ## A worked example Take a 30-day window with 43 minutes of cumulative outage time across the month: ```bash window = 30 days = 43,200 minutes downtime = outages, cumulative = 43 minutes uptime = (43,200 - 43) / 43,200 = 43,157 / 43,200 = 99.90% ``` > **99.9% is about 43 minutes per month** > > That is the whole downtime budget for a three-nines target on a 30-day window. The [outage breakdown in reports](https://hyperping.com/docs/monitoring/reports) shows exactly where that budget went. ## Where uptime appears The same calculation feeds three places: - **Monitor view**: each monitor shows its uptime alongside its outage history and check logs. - **Uptime reports**: the [reporting dashboard](https://hyperping.com/docs/monitoring/reports) aggregates uptime per monitor over any period, with outage counts, total downtime, and CSV export for SLA reviews. - **Status page**: services can display uptime bars to your visitors. See [Add services](https://hyperping.com/docs/status-page/add-services). ## Uptime on your status page Visitors see the uptime of the services you chose to display. Each service can show a graph of the past 90 days of historical uptime, as a percentage of availability, so your reliability track record is public and verifiable. Enable it per service from the Gear icon in your status page's Sections tab, where you can also show a response time graph. See [Add services](https://hyperping.com/docs/status-page/add-services) for the setup. ## Next steps [ Uptime reports→ Per-monitor uptime, outages, MTTA and MTTR, with CSV export. ](https://hyperping.com/docs/monitoring/reports)[ Add services→ Show uptime and response time graphs on your status page. ](https://hyperping.com/docs/status-page/add-services)[ Go-live checklist→ Everything to verify before you announce your status page. ](https://hyperping.com/docs/status-page/go-live-checklist)[ Datacenter regions→ The 18 regions your checks run from, and how failures are confirmed. ](https://hyperping.com/docs/monitoring/datacenter-regions) [← SEO and analytics](https://hyperping.com/docs/status-page/seo-analytics)[Go-live checklist →](https://hyperping.com/docs/status-page/go-live-checklist) [](https://x.com/hyperping)[](https://www.linkedin.com/company/hyperping) © 2026 Hyperping --- Source: https://hyperping.com/docs/status-page/white-labeling # White labeling White labeling makes your status page fully yours. Your users see your domain, your branding, and your email address, with no Hyperping branding anywhere they look. ## What white labeling includes - A **custom domain** like status.yourdomain.com, with automatic HTTPS. - The **"Powered by Hyperping" footer removed** from your status page. - **Subscriber emails sent from your own domain** instead of Hyperping's. - Full **visual branding**: logo, favicon, accent color, fonts, and themes. ![Status page appearance settings with branding options and live preview](https://hyperping.com/static/statuspage-appearance-c272dff8a7a4dbbbfe1edfca7bd3dee4.webp) The Appearance settings: fonts, theme, the "Powered by" toggle, colors, and logos ## Custom domain Point a CNAME record at Hyperping and your status page is served from your own domain with an automatically provisioned SSL certificate. See [Custom domain](https://hyperping.com/docs/status-page/custom-domain) for the full setup. ## Hide the "Powered by Hyperping" footer In your status page's **Settings**, under the customization options, you can hide the "Powered by Hyperping" mention so the page carries only your brand. This option is available on the Business plan. ## Send emails from your own domain By default, subscriber notifications (incident updates, maintenance notices, and confirmation emails) are sent from a Hyperping address. On the Business plan, you can send them from your own domain instead, so every touchpoint your customers see is branded as you. Configure the sender domain from your status page's settings, then add the DNS records shown in the dashboard to verify your domain and authorize sending. ## Visual branding All plans can customize the look of their status page: company logo (with a separate dark mode logo), favicon, accent color, font, and light or dark theme. See [How to create a status page](https://hyperping.com/docs/status-page/create-status-page) for every customization option. ## Plan availability | Feature | Availability | | --- | --- | | Visual branding (logo, colors, fonts) | All plans | | Custom domain with HTTPS | All paid plans | | Hide "Powered by Hyperping" | Business | | Custom email sender domain | Business | ## Next steps [ Custom domain→ Serve your status page from your own domain with automatic HTTPS. ](https://hyperping.com/docs/status-page/custom-domain)[ Create a status page→ Logo, favicon, accent color, fonts, themes, and every other option. ](https://hyperping.com/docs/status-page/create-status-page)[ Private status pages→ Restrict access with a password, email codes, or SSO. ](https://hyperping.com/docs/status-page/private-status-pages)[ Go-live checklist→ Everything to verify before you announce your status page. ](https://hyperping.com/docs/status-page/go-live-checklist) [← Status page SSO](https://hyperping.com/docs/status-page/sso)[Multi-language status pages →](https://hyperping.com/docs/status-page/languages) [](https://x.com/hyperping)[](https://www.linkedin.com/company/hyperping) © 2026 Hyperping --- Source: https://hyperping.com/docs/server-monitoring # What is Server monitoring? Updated September 28, 2026 Install a lightweight agent on your Linux, macOS, and Windows hosts and stream system metrics straight to your Hyperping dashboard. Each install creates one server entry showing CPU and load averages, memory, filesystem usage, disk I/O, network throughput, and host metadata, with no collector of your own to manage. Platforms Linux (systemd) · macOS (launchd) · Windows (service) Architectures amd64 · arm64 (amd64 on Windows) Cadence 30 second scrape Transport OTLP/HTTP with on-disk queue Enrollment Install token (stable or bound) Footprint ~50 MB RSS target > **Sits alongside your HTTP monitors** > > HTTP monitors tell you a page stopped loading from the outside. The agent tells you the machine ran out of memory two minutes earlier. Use both together for full coverage. ![Server detail dashboard with CPU, memory, load average, disk I/O, network bandwidth, and disk usage panels](https://hyperping.com/static/server-detail-9ebd2510a1079496f89d8e3c380cb98d.webp) A server's dashboard: CPU, memory, load, disk I/O, network, and disk usage ## What it collects The agent embeds an OpenTelemetry collector that scrapes system metrics every 30 seconds and ships them to Hyperping over OTLP/HTTP. The first data point reaches the dashboard within a few seconds of enrollment. ### Metric categories 6 groups `CPU`percent / load Utilization percentage, 1, 5, and 15-minute load averages, logical core count. `Memory`bytes / percent Used, available, total, and utilization as a percentage. `Filesystem`bytes Used and free space for every real mount point, rendered as a per-mount table in the dashboard. Utilization percentage is computed in the UI from these two values. `Disk I/O`bytes Bytes read and written per block device, with a direction attribute. `Network`bytes Bytes in and out per interface. The dashboard derives TX and RX rates automatically. `System`seconds / string Uptime, boot time, hostname, OS and distribution, kernel, architecture, CPU model and vendor, agent version. Powers the dashboard's System Info panel. > **Not ingested today** > > Per-process CPU and memory, per-interface packets and errors, per-device disk operation counts, and swap / paging are on the roadmap. The agent can emit them but the ingestor drops them. See [Metrics collected](https://hyperping.com/docs/server-monitoring/metrics-collected) for the exact accepted list. Queue resilience, not a metric: the collector persists unsent batches to `/var/lib/hyperping/queue` (`C:\ProgramData\Hyperping\queue` on Windows) so metrics survive ingest outages, reboots, and network blips. For the full list of fields and units, see [Metrics collected](https://hyperping.com/docs/server-monitoring/metrics-collected). ## How enrollment works 1. Generate a token Add a server in the dashboard. Hyperping returns a single-use install token scoped to that server entry. 2. Exchange for an agent token The installer hands the install token to Hyperping and gets back a long-lived per-host agent token. From that point on the host authenticates as itself, not as the shared install token. 3. Rotate by re-running Running the installer with a new install token re-enrolls the agent and revokes the old credential. Same server UUID, clean rotation. > **What happens when a server stops reporting?** > > It turns Stale, then Offline once its offline threshold passes (default 90 seconds). An outage opens and the escalation policy bound to the server pages its channels. See [Server alerting](https://hyperping.com/docs/server-monitoring/alerting). ## Next steps [ Getting started→ Add a server, run one command, see metrics in about 30 seconds. ](https://hyperping.com/docs/server-monitoring/getting-started)[ Install the agent→ Paths, service names, platform notes, and troubleshooting. ](https://hyperping.com/docs/server-monitoring/install-agent)[ Metrics collected→ Every field and unit the agent reports, plus collection cadence. ](https://hyperping.com/docs/server-monitoring/metrics-collected)[ Uninstall→ Stop the agent, purge state, and remove the server entry. ](https://hyperping.com/docs/server-monitoring/uninstall) [Getting started →](https://hyperping.com/docs/server-monitoring/getting-started) [](https://x.com/hyperping)[](https://www.linkedin.com/company/hyperping) © 2026 Hyperping --- Source: https://hyperping.com/docs/server-monitoring/alerting # Server alerting Server alerting pages your team when a server stops reporting. It works like monitor alerting: when a server goes offline, an outage opens and the escalation policy bound to the server notifies its channels. ## Server states Each enrolled server has a liveness state based on the metrics the agent reports: - **Green.** The agent is reporting normally. - **Orange (stale).** The first scrape gap has crossed the stale threshold (30 seconds). This is surfaced in the UI only, no alert fires. - **Red (offline).** No metrics for longer than the server's offline threshold (default 90 seconds, floor 60 seconds). An outage is opened and the escalation policy bound to the server pages its channels. > **Where does liveness come from?** > > There is no dedicated heartbeat: liveness is derived from metric arrival. See [Metrics collected](https://hyperping.com/docs/server-monitoring/metrics-collected) for the scrape cadence and [Install the agent](https://hyperping.com/docs/server-monitoring/install-agent#agent-states-and-liveness) for the full state reference. ## Tune the offline threshold The offline threshold is per-server and tunable from the **Alerting** panel on the server detail page. Pick something longer than your worst expected network blip, and shorter than you'd want to wait before being paged. ## Choose who gets paged Bind an [escalation policy](https://hyperping.com/docs/monitoring/escalation-policies) to the server from the same Alerting panel. The policy's steps, delays, and channels apply exactly as they do for monitors: email, SMS, phone calls, Slack, Teams, PagerDuty, OpsGenie, webhooks, or an [on-call schedule](https://hyperping.com/docs/monitoring/on-call). ## Recovery When the agent reports metrics again, the outage is resolved and recovery notifications are sent to the same channels. ## Testing your setup To verify alerting end to end, stop the agent on a non-critical server and wait for the offline threshold to pass: ```bash sudo systemctl stop hp-agent.service ``` You should be paged through the escalation policy bound to that server. Start the agent again to trigger the recovery notification. ## Plan availability Server alerting is included on all paid plans. See [pricing](https://hyperping.com/pricing) for the number of server agents included in each plan. ## Next steps [ Install the agent→ Enrollment, install tokens, and liveness details. ](https://hyperping.com/docs/server-monitoring/install-agent)[ Metrics collected→ CPU, memory, filesystem, disk I/O, and network. ](https://hyperping.com/docs/server-monitoring/metrics-collected)[ Escalation policies→ Configure who gets paged, and in what order. ](https://hyperping.com/docs/monitoring/escalation-policies)[ On-call schedules→ Page whoever is on duty through an on-call schedule. ](https://hyperping.com/docs/monitoring/on-call) [← Metrics collected](https://hyperping.com/docs/server-monitoring/metrics-collected)[Uninstall the agent →](https://hyperping.com/docs/server-monitoring/uninstall) [](https://x.com/hyperping)[](https://www.linkedin.com/company/hyperping) © 2026 Hyperping --- Source: https://hyperping.com/docs/server-monitoring/getting-started # Getting started with Server monitoring Updated September 28, 2026 Get your first server reporting metrics in under a minute. Add the server in the dashboard, run one install command on the host, then wait for the first scrape. ## Quick start 1. Add a server in the dashboard Open your [Servers view](https://app.hyperping.io/servers) and click **New server**. Give it a display name, for example `api-prod-1`. Hyperping generates a single-use install token. 2. Run the install command on the host Pick **Linux / macOS** or **Windows** above the command, copy it, and run it on the host: as a user that can `sudo` on Linux and macOS, in a PowerShell window opened with **Run as Administrator** on Windows. The installer detects OS and architecture, verifies SHA256, and registers the service. 3. Wait for the first scrape Refresh the Servers view. Within about 30 seconds the new row flips to **Online** (green dot) and the CPU, memory, disk, network, and System Info panels start filling in. ## Install command On Linux and macOS, replace the placeholder with your real install token: TerminalBASH ``` curl -fsSL https://hyperping.com/install.sh | sh -s HP_INSTALL_xxxxx ``` The script is POSIX `sh`, so `sh`, `dash`, and `bash` all work. If you prefer to run as root directly, the command works without `sudo`. On Windows 10, Windows Server 2016, and later, run this in an Administrator PowerShell window: PowerShell (Administrator)POWERSHELL ``` & ([scriptblock]::Create((irm https://hyperping.com/install.ps1))) HP_INSTALL_xxxxx ``` On Windows Server 2016, copy the command from the dashboard: it starts with a line that turns on TLS 1.2, which PowerShell 5.1 does not enable there by default. See [Windows install notes](https://hyperping.com/docs/server-monitoring/install-agent#windows). > **What the installer changes** > > It creates the `hyperping` system user on Linux, writes config to `/etc/hyperping/`, installs the binary to `/usr/local/bin/hp-agent`, and registers a service with systemd or launchd. On Windows it installs `C:\Program Files\Hyperping\hp-agent.exe`, writes config to `C:\ProgramData\Hyperping\`, and registers the `hp-agent` Windows service. See the [install reference](https://hyperping.com/docs/server-monitoring/install-agent) for the full picture. ![Servers list with per-server CPU, RAM, and disk usage](https://hyperping.com/static/servers-list-e8eea346b16fa830c61b37fffb40bf45.webp) Your fleet once agents report: CPU, RAM, and disk per server, grouped how you like > **Want to be paged if this server goes offline?** > > Bind an escalation policy from the Alerting panel on the server detail page. When the server crosses its offline threshold, an outage opens and the policy pages its channels. See [Server alerting](https://hyperping.com/docs/server-monitoring/alerting). ## Next steps [ Metrics collected→ Exact fields and units the agent reports, with collection cadence. ](https://hyperping.com/docs/server-monitoring/metrics-collected)[ Install the agent→ Paths, service names, token rotation, and troubleshooting. ](https://hyperping.com/docs/server-monitoring/install-agent)[ Server alerting→ Offline thresholds, escalation policies, and recovery notifications. ](https://hyperping.com/docs/server-monitoring/alerting)[ Uninstall→ Remove the agent and delete the server entry from the dashboard. ](https://hyperping.com/docs/server-monitoring/uninstall) [← What is Server monitoring?](https://hyperping.com/docs/server-monitoring)[Install the agent →](https://hyperping.com/docs/server-monitoring/install-agent) [](https://x.com/hyperping)[](https://www.linkedin.com/company/hyperping) © 2026 Hyperping --- Source: https://hyperping.com/docs/server-monitoring/install-agent # Install the agent Updated September 28, 2026 Reference for what the installer changes on your host, where to look when something goes wrong, and how re-enrollment works. If you just want an agent running, [Getting started](https://hyperping.com/docs/server-monitoring/getting-started) is shorter. ## Requirements OS Linux with systemd, macOS with launchd, or Windows 10 / Windows Server 2016 and later. Architecture `amd64` or `arm64` on Linux and macOS. `amd64` (64-bit x86) on Windows. Privileges Root access via `sudo` or a root shell. On Windows, a PowerShell window opened with **Run as Administrator**. Tools `curl` and `tar` on Linux and macOS, preinstalled on most systems. Nothing extra on Windows: the built-in Windows PowerShell 5.1 is enough. Egress Outbound HTTPS to `api.hyperping.io` and `ingest.hyperping.io`. ## Install command Replace the placeholder with the install token from the dashboard: TerminalBASH ``` curl -fsSL https://hyperping.com/install.sh | sh -s HP_INSTALL_xxxxx ``` The script is POSIX `sh`, so `sh`, `dash`, and `bash` all work. If your pipeline forces a particular shell, pipe to that shell explicitly, for example `... | bash -s HP_INSTALL_xxxxx`. ### Windows On Windows the installer is a PowerShell script, `install.ps1`. Open PowerShell with **Run as Administrator** and run: PowerShell (Administrator)POWERSHELL ``` & ([scriptblock]::Create((irm https://hyperping.com/install.ps1))) HP_INSTALL_xxxxx ``` The `[scriptblock]::Create(...)` form is what lets you pass the token and flags as arguments. The dashboard's **Windows** tab, next to **Linux / macOS** above the install command, gives you this command with your token already filled in. > **Windows Server 2016** > > Windows PowerShell 5.1 on Server 2016 only offers TLS 1.0 by default, so the download fails before the installer starts. Enable TLS 1.2 for the session first. The command copied from the dashboard already starts with this line. PowerShell (Administrator)POWERSHELL ``` [Net.ServicePointManager]::SecurityProtocol = [Net.ServicePointManager]::SecurityProtocol -bor 3072 & ([scriptblock]::Create((irm https://hyperping.com/install.ps1))) HP_INSTALL_xxxxx ``` ## Install-time overrides Pass flags after the install token to set a display name, bind an escalation policy, or drop the server into a group on first enrollment. Useful when you're running the same command across an Ansible inventory, a Terraform `remote-exec`, or a Kubernetes DaemonSet. TerminalBASH ``` curl -fsSL https://hyperping.com/install.sh | sh -s -- \ HP_INSTALL_xxxxx \ --name "web-01" \ --policy 6fe4c2e0-... \ --group web-tier ``` `--name` Friendly display name shown in the dashboard. Falls back to the host's own hostname when not set. `--policy` Escalation policy UUID to attach. Copy it from the policy detail page in the dashboard. `--group` Group to land the server in. The group is created on demand if it doesn't exist. `--force` Overwrite name, policy, and group on re-enrollment of a host that already exists. See [Re-enrollment](#re-enrollment-and-token-rotation). Every flag is also readable from an environment variable, which is cleaner for config-management tools that export variables rather than template long command lines: Environment variablesBASH ``` HP_DISPLAY_NAME="web-01" HP_POLICY_UUID=6fe4c2e0-... HP_GROUP_NAME=web-tier \ sh -c "$(curl -fsSL https://hyperping.com/install.sh)" -- HP_INSTALL_xxxxx ``` The mapping is `--name` → `HP_DISPLAY_NAME`, `--policy` → `HP_POLICY_UUID`, `--group` → `HP_GROUP_NAME`. Explicit flags win over environment variables when both are set. On Windows the same options are PowerShell parameters: `-Name`, `-Policy`, `-Group`, `-Force`, plus `-Interval` for the collection interval in seconds (default and minimum 30). The installer reads the same environment variables, and `$env:HP_INSTALL_TOKEN` can stand in for the token argument. PowerShell (Administrator)POWERSHELL ``` & ([scriptblock]::Create((irm https://hyperping.com/install.ps1))) HP_INSTALL_xxxxx ` -Name "web-01" ` -Policy 6fe4c2e0-... ` -Group web-tier ``` ## Install tokens and bound defaults Every project has one stable install token, which is what the dashboard shows by default. Beyond that you can mint **bound install tokens** from the **Advanced** link next to the install command. A bound token carries its own default name, policy, and group, so the one-liner stays short even when the fleet has a specific destination in mind. Stable project token Always available. Safe to paste into ad-hoc installs or docs. Override defaults with flags when you need to. Bound install token Carries `default_display_name`, `default_policy_uuid`, and `default_group_name`. Good for fleets where every host in a group shares the same destination. Plaintext visibility The token is shown once, at creation. Reopening **Advanced** only surfaces a short ID. Lose it, revoke and mint a new one. Revocation Revoking a token blocks further enrollments through it. Agents that enrolled earlier keep running on their own per-host agent tokens. Resolution order when a server enrolls: explicit flag, then bound token default, then existing value on the server row. This is why a bound token's defaults can be overridden on specific hosts without losing them on the rest. ## What the installer does 1. Detect the host Identifies OS (`linux` or `macos`), architecture, and init system (systemd or launchd). On Windows, `install.ps1` checks that it runs as Administrator on Windows 10 / Server 2016 or later, 64-bit, with at least 200 MB free on the system drive. 2. Download and verify Fetches `hp-agent---.tar.gz` (`hp-agent--windows-amd64.zip` on Windows) from `api.hyperping.io/downloads/agent` and checks its SHA256. 3. Enroll and register Exchanges the install token for a per-host agent token, writes config under `/etc/hyperping/` (`C:\ProgramData\Hyperping` on Windows), and starts the service. The first scrape reaches Hyperping within a few seconds. ## Where files are written Binary `/usr/local/bin/hp-agent` Libexec `/usr/local/libexec/` (collector and sidecar binaries) Config `/etc/hyperping/agent.env` and `/etc/hyperping/agent.yaml` State `/var/lib/hyperping/` Logs `/var/log/hyperping/` Linux service `/etc/systemd/system/hp-agent.service` macOS service `/Library/LaunchDaemons/com.hyperping.agent.plist` On Windows: Binary `C:\Program Files\Hyperping\hp-agent.exe` Config `C:\ProgramData\Hyperping\agent.yaml`. It holds the agent token, so the folder is readable by SYSTEM and Administrators only. Queue `C:\ProgramData\Hyperping\queue` Service `hp-agent` Windows service, started automatically at boot and restarted 5 seconds after a crash. Logs Windows Application event log, source `hp-agent`. ## Checking the agent Service status on Linux: LinuxBASH ``` sudo systemctl status hp-agent.service ``` Tail logs on Linux: LinuxBASH ``` sudo journalctl -u hp-agent.service -f ``` Service status on macOS: macOSBASH ``` sudo launchctl print system/com.hyperping.agent ``` Logs are also written under `/var/log/hyperping/`. Service status on Windows: PowerShellPOWERSHELL ``` Get-Service hp-agent ``` Recent logs on Windows, from the Application event log: PowerShellPOWERSHELL ``` Get-WinEvent -ProviderName hp-agent -MaxEvents 20 ``` ## Agent states and liveness There is no dedicated heartbeat: liveness is derived from metric arrival. The dashboard reflects four states: **Online** Green. Metrics arrived within the last scrape window (~30 seconds). **Stale** Orange. First scrape gap has crossed the stale threshold (30 seconds). Surfaced in the UI only, no alert fires. **Offline** Red. No metrics for longer than the server's offline threshold (default 90s, floor 60s). An outage is opened and the escalation policy bound to the server pages its channels. **Uninstalled** Grey. Recorded after a successful `--uninstall` on the host. The row is kept for ownership history; no alerts. > **Who gets paged when a server goes Offline?** > > The escalation policy bound to the server. The offline threshold is per-server and tunable from the Alerting panel on the server detail page: pick something longer than your worst expected network blip, and shorter than you'd want to wait before being paged. See [Server alerting](https://hyperping.com/docs/server-monitoring/alerting). ## Revoke, uninstall, and delete Three separate actions are available from the server's menu. Pick the one that matches what you're trying to do: Revoke agent Invalidates the per-host agent token server-side without removing the server row. The running binary starts 401-ing. Use for rotation or if a host's credential is compromised. Re-run the installer with a fresh install token afterwards to bring it back. Copy uninstall command Copies the uninstall one-liner to your clipboard: `sh -s -- --uninstall` on Linux and macOS, `-Uninstall` on Windows. Run it on the host to stop the service and remove binaries. See [Uninstall](https://hyperping.com/docs/server-monitoring/uninstall). Delete server Hard-deletes the server row and releases its quota slot. Invalidates the agent token too, so any still-running binary logs 401s until it's stopped. ## Cloud detectors Cloud resource detection (EC2, GCE, Azure) is **off by default** to keep cold-start latency low on bare-metal hosts. On cloud VMs where you want the instance metadata shown alongside host info, enable the relevant detector in `/etc/hyperping/agent.yaml` and restart the agent (`systemctl restart hp-agent` on Linux, `launchctl kickstart -k system/com.hyperping.agent` on macOS). On Windows the file is `C:\ProgramData\Hyperping\agent.yaml` and the restart is `Restart-Service hp-agent`. ## Re-enrollment and token rotation Re-running the installer on a host that has already enrolled keeps the same server UUID and its metric history, rotates the per-host agent token, and revokes the old one. Safe to use for credential rotation or recovery from a compromised `agent.env`. On re-enrollment, display name, escalation policy, and group are **sticky**: the installer will only fill them if the server row has no value yet. This protects edits you've made in the dashboard from being overwritten by a pipeline that re-runs the installer. Pass `--force` when you do want the installer to win. TerminalBASH ``` curl -fsSL https://hyperping.com/install.sh | sh -s -- HP_INSTALL_xxxxx --name "web-prod-01" --force ``` Hostname, OS, architecture, and agent version always update from whatever the host reports. Those are facts about the machine, not user-editable preferences, so they don't need the `--force` gate. > **Sticky fields at a glance** > > On first enrollment, flags or bound-token defaults populate the row. On re-enrollment without `--force`, only empty columns get filled. With `--force`, the resolved values overwrite whatever is there. ## Troubleshooting **SHA256 mismatch** The tarball failed integrity check. Usually a dropped connection or a rewriting proxy. Re-run the command. If it fails again, confirm `api.hyperping.io` is reachable and not behind a transforming proxy. **Service starts, no metrics** Check outbound HTTPS to `ingest.hyperping.io`. Tail the logs and look for TLS or DNS errors. A blocked egress firewall is the most common cause. **Required command not found** The installer needs `curl` and `tar`. Install them through your package manager and re-run. **Install token revoked or expired** If enrollment fails with 401 `token_revoked` or `token_expired`, the token has been revoked or has aged out. Generate a fresh one from the Servers view, or open **Advanced** to mint a bound token. **escalation\_policy\_not\_found on enrollment** The `--policy` UUID doesn't belong to this project. Copy the UUID directly from the policy detail page in the dashboard, and double-check you're using the right install token for the project you expect. **Windows: must run as Administrator** The installer registers a Windows service and writes under `C:\Program Files`, so it needs an elevated session. Right-click PowerShell, pick **Run as Administrator**, and run the command again. **Windows: the download fails on Server 2016** Windows PowerShell 5.1 on Server 2016 negotiates TLS 1.0 by default, which Hyperping does not accept. Run `[Net.ServicePointManager]::SecurityProtocol = [Net.ServicePointManager]::SecurityProtocol -bor 3072` in the same window first, or copy the command from the dashboard, which includes that line. **Windows: service did not become healthy** The service started but the collector exited right after. Read the reason with `Get-WinEvent -ProviderName hp-agent -MaxEvents 20`. After editing `agent.yaml` by hand, restart with `Restart-Service hp-agent`. **Windows detected when running install.sh** You ran the Linux / macOS command from Git Bash, MSYS2, or Cygwin. The agent runs as a native Windows service, so use the PowerShell installer from an Administrator PowerShell window instead. **Name or policy didn't update** On re-enrollment, display name, policy, and group are sticky by design: the installer won't overwrite a value that's already set. Add `--force` when you want the installer to win over a UI edit. ## Next steps [ Metrics collected→ Every OTLP metric name the ingestor accepts, with units and cadence. ](https://hyperping.com/docs/server-monitoring/metrics-collected)[ Server alerting→ Offline thresholds, escalation policies, and recovery notifications. ](https://hyperping.com/docs/server-monitoring/alerting)[ Escalation policies→ Route alerts in order, with delays, until resolved. ](https://hyperping.com/docs/monitoring/escalation-policies)[ Uninstall→ Stop the agent, purge state, and remove the server entry. ](https://hyperping.com/docs/server-monitoring/uninstall) [← Getting started](https://hyperping.com/docs/server-monitoring/getting-started)[Metrics collected →](https://hyperping.com/docs/server-monitoring/metrics-collected) [](https://x.com/hyperping)[](https://www.linkedin.com/company/hyperping) © 2026 Hyperping --- Source: https://hyperping.com/docs/server-monitoring/metrics-collected # Metrics collected Use this page as the reference for every OTLP metric name the ingestor accepts. The agent ships system metrics through an embedded OpenTelemetry collector: scraped every 30 seconds, streamed to the ingest endpoint over OTLP/HTTP. There is no separate heartbeat; a server is considered live as long as its metrics keep arriving. Anything outside the accepted set below is dropped silently server-side. ![Server detail with CPU, memory, load average, disk IO, network bandwidth, and disk usage charts](https://hyperping.com/static/server-detail-9ebd2510a1079496f89d8e3c380cb98d.webp) What the metrics become: live CPU, memory, load, disk IO, network, and disk usage charts on the server detail Scrape interval 30 seconds Dashboard lag A few seconds after each scrape Liveness Derived from metric arrival Transport OTLP/HTTP, gzipped, on-disk queue > **About the metric names below** > > These are the OpenTelemetry instrument names (`system.cpu.utilization`, `system.memory.usage`, …). The dashboard shows them under friendlier labels like "CPU" or "RAM"; the raw names are only useful if you're reading OTLP payloads directly. ## CPU ### Processor metrics 3 metrics `system.cpu.utilization`percent Total CPU time spent in user, system, iowait, and other states, as a percentage of wall time. Per-state and per-CPU breakdowns are available as attributes. `system.cpu.load_average.{1m,5m,15m}`scalar 1, 5, and 15-minute load averages. Read from `/proc/loadavg` on Linux and `sysctl` on macOS. Windows has no load average, so the collector derives one from the processor queue length. `system.cpu.logical.count`count Logical core count of the host. Opt-in metric, powers System Info → CPU Cores. ## Memory ### Memory metrics 3 metrics `system.memory.usage`bytes Memory in use per state (`used`, `free`, `buffered`, `cached`, `slab_reclaimable`, `slab_unreclaimable`), as reported by the kernel. `system.memory.utilization`percent Same as above, expressed as a fraction of installed memory. Convenient for alerts. `system.memory.limit`bytes Installed physical memory. Powers System Info → Total RAM. > **Paging / swap is not ingested** > > The agent can emit `system.paging.usage`, but the ingestor drops it today. If swap pressure matters to you, alert on available memory instead, or let us know so we can add it. ## Filesystem ### Filesystem metrics 1 metric `system.filesystem.usage`bytes Used and free space per mount point, with `device`, `mountpoint`, `mode`, and `type` attributes. Rendered in the dashboard as a per-mount Filesystems table. The dashboard computes the utilization percentage from these two values, so there is no separate `system.filesystem.utilization` series to query. > **macOS disk available is approximated** > > macOS does not expose a direct "available" gauge at the kernel level, so this value is an approximation. Treat small deltas on macOS hosts as noise rather than a precise reading. > **Windows drives** > > On Windows each drive letter is a mount point (`C:`, `D:`, …). The system drive, `C:`, plays the role of `/`: it is the disk shown on the server row and in the host-level Disk gauge. ## Disk I/O ### Block device metrics 1 metric `system.disk.io`bytes Bytes read and written per block device, with a `direction` attribute. Operation counts (`system.disk.operations`) are not ingested today. ## Network ### Interface counters 1 metric `system.network.io`bytes Bytes in and out per interface, per `direction`. The dashboard derives TX and RX byte rates from this in the Network table. Packet counts, per-interface errors, and dropped-packet counters are not ingested today. On Windows, the loopback pseudo-interface and virtual tunnel adapters (ISATAP, Teredo, and the hidden `Local Area Connection*` adapters) are left out of the Network table, as `lo` is on Linux. > **Per-process metrics are not ingested** > > Running and blocked process counts (`system.processes.count`) and per-process CPU and memory (`process.cpu.utilization`, `process.memory.usage`) are on the roadmap. The agent can emit them but the ingestor drops them today, so enabling the `process` scraper in `agent.yaml` just adds payload weight without populating the dashboard. ## Host metadata Host metadata rides on every OTLP payload as resource attributes, so the dashboard stays accurate across reboots, kernel upgrades, and agent upgrades without any metadata-specific endpoint. Hostname As returned by `gethostname`. Host ID A stable machine identifier, unchanged across reboots, so a re-enrolled host is recognised as the same machine. OS Distribution and version, for example `Ubuntu 22.04` or `macOS 14.5`. Kernel Kernel version string (`uname -r`). Architecture `amd64` or `arm64`. CPU model Model name and vendor, shown in System Info → CPU Model. Boot time Derived from system uptime, shown in System Info → Boot Time. Agent version The installed agent version. When a newer release is available the dashboard shows an "update available" pill on the server row. ## Uptime ### System lifetime 1 metric `system.uptime`seconds Seconds since the kernel booted. Used to render Boot Time in the System Info panel. ## Collection cadence Host metrics scrape Every `30` seconds by the embedded OTel `hostmetrics` receiver. Dashboard lag Each scrape typically reaches Hyperping within a couple of seconds, so a graph update is visible within ~32s of the event on the host. Persistent queue Unsent metrics are queued to disk at `/var/lib/hyperping/queue` (`C:\ProgramData\Hyperping\queue` on Windows) and retried automatically, so metrics survive ingest outages, reboots, and network blips. Liveness Derived from metric arrival: Online → Stale after ~30s without data → Offline after the per-server threshold (default 90s, floor 60s). > **Want to be paged when metrics stop arriving?** > > When a server crosses its offline threshold, an outage opens and the escalation policy bound to the server pages its channels. Tune the threshold and pick the policy from the Alerting panel on the server detail page. See [Server alerting](https://hyperping.com/docs/server-monitoring/alerting). ## Retention How far back the dashboard can scroll on each plan. High-resolution data ages out first; coarser rollups live longer, so a 6-month-old graph on Business still shows hourly points even after the minute-level data has been deleted. Free 2 days of 1-minute history, 7 days at 5-minute, 30 days at 1-hour. Essentials 7 days of 1-minute history, 30 days at 5-minute, 6 months at 1-hour. Pro 14 days of 1-minute history, 60 days at 5-minute, 13 months at 1-hour. Business 30 days of 1-minute history, 90 days at 5-minute, 13 months at 1-hour. The 48-hour raw-scrape cache is uniform across plans. It is what the live server view reads for the current values on each panel, not what backs the historical charts. If you need longer retention than Business offers (audit, compliance), reach out; custom retention windows are available on Enterprise. ## Next steps [ Install the agent→ Paths, service names, enrollment, and troubleshooting. ](https://hyperping.com/docs/server-monitoring/install-agent)[ Server alerting→ Offline thresholds, escalation policies, and recovery notifications. ](https://hyperping.com/docs/server-monitoring/alerting)[ Getting started→ Add a server, run one command, see metrics in about 30 seconds. ](https://hyperping.com/docs/server-monitoring/getting-started)[ Uninstall→ Stop the agent, purge state, and remove the server entry. ](https://hyperping.com/docs/server-monitoring/uninstall) [← Install the agent](https://hyperping.com/docs/server-monitoring/install-agent)[Uninstall →](https://hyperping.com/docs/server-monitoring/uninstall) [](https://x.com/hyperping)[](https://www.linkedin.com/company/hyperping) © 2026 Hyperping --- Source: https://hyperping.com/docs/server-monitoring/uninstall # Uninstall the agent Updated September 28, 2026 Pass `--uninstall` (`-Uninstall` on Windows) to the same installer script to remove the Hyperping agent: the service is stopped and deregistered and the binaries are removed, while configuration and state stay on disk so you can reinstall without losing the agent token. Removing the server from the dashboard or rotating its credential are [separate actions](https://hyperping.com/docs/server-monitoring/install-agent#revoke-uninstall-and-delete). > **Three actions, pick the right one** > > **Uninstall** (this page) is a host-side action: it stops the service on that machine. **Revoke** invalidates the agent's credential server-side without removing the server row. **Delete** hard-removes the server row and frees its quota slot. They compose: if you're decommissioning a host, the clean sequence is uninstall, then delete. ## Stop and remove Run on the host: TerminalBASH ``` curl -fsSL https://hyperping.com/install.sh | sh -s -- --uninstall ``` Service Stops and disables `hp-agent.service` on Linux, unloads `com.hyperping.agent` on macOS. Unit files Removes `/etc/systemd/system/hp-agent.service` or `/Library/LaunchDaemons/com.hyperping.agent.plist`. Binaries Removes files from `/usr/local/bin/` and `/usr/local/libexec/`. Legacy Cleans up 0.1.x service files if they exist. On Windows, run this in an Administrator PowerShell window: PowerShell (Administrator)POWERSHELL ``` & ([scriptblock]::Create((irm https://hyperping.com/install.ps1))) -Uninstall ``` It stops and deletes the `hp-agent` service, removes `C:\Program Files\Hyperping\`, and unregisters the `hp-agent` event log source. ## What is kept by default > **Config, state, and logs are preserved** > > The uninstaller leaves `/etc/hyperping/` (including the agent token), `/var/lib/hyperping/`, and `/var/log/hyperping/` untouched. On Windows it keeps `C:\ProgramData\Hyperping\`, which holds `agent.yaml` and the queue. If you plan to reinstall on the same host, keeping these in place lets the agent come back online without re-enrolling. ## Fully remove everything To purge all Hyperping files: TerminalBASH ``` sudo rm -rf /etc/hyperping /var/lib/hyperping /var/log/hyperping ``` On Windows, after the uninstall: PowerShell (Administrator)POWERSHELL ``` Remove-Item -Recurse -Force "$env:ProgramData\Hyperping" ``` The `hyperping` system user on Linux is harmless, but you can remove it with `sudo userdel hyperping` if your compliance policy requires it. ## Remove from the dashboard > **Dashboard and host are separate** > > Uninstalling is a host-side action. To remove the server entry and stop billing for that slot, open the [Servers view](https://app.hyperping.io/servers), open the server, and click **Delete server**. Deletion invalidates the agent token server-side, so if the binary is still running it will start logging 401s. Run the uninstaller too. ## Rotate the credential without uninstalling If you only need to rotate the host's agent token, for example after suspected compromise of `/etc/hyperping/agent.env` (`C:\ProgramData\Hyperping\agent.yaml` on Windows), use **Revoke agent** from the server menu instead. The server row stays, the running binary starts 401-ing, and re-running the installer with a new install token brings the host back with a fresh credential and the same UUID (so metric history is preserved). See [Re-enrollment](https://hyperping.com/docs/server-monitoring/install-agent#re-enrollment-and-token-rotation). ## Reinstall after uninstall 1. Generate a fresh token Add the server again (or regenerate the install token) from the Servers view. 2. Re-run the installer Paste the new install command on the host. The new token replaces any cached credential. 3. Confirm in the dashboard Refresh the Servers view. The server moves back to **Online** within about 30 seconds. ## Next steps [ Install the agent→ Re-enroll a host, rotate tokens, and check the service. ](https://hyperping.com/docs/server-monitoring/install-agent)[ Getting started→ Add a server, run one command, see metrics in about 30 seconds. ](https://hyperping.com/docs/server-monitoring/getting-started) [← Metrics collected](https://hyperping.com/docs/server-monitoring/metrics-collected) [](https://x.com/hyperping)[](https://www.linkedin.com/company/hyperping) © 2026 Hyperping --- Source: https://hyperping.com/docs/logs # Logs Send your application and platform logs to Hyperping, search them in the same place as your monitors, and open an incident when errors pile up or lines stop arriving. ![Hyperping Logs explorer with a search bar, time range buttons, a histogram of lines per minute colored by level, and a list of log lines with time, level, service, host and message](https://hyperping.com/static/logs-explorer-d10ff5b447fe330dcb8327b02c99acb4.webp) The Logs explorer: a volume histogram by level above the newest matching lines ## Overview When a monitor goes down, the next question is what your application was doing at that moment. With Logs, the answer sits next to the incident: every incident page has a **Logs** tab showing the lines from 15 minutes before it started to 5 minutes after, so you don't have to switch to another tool and line up timestamps by hand. Logs come in through **sources**. Each source has its own token and retention, and can be an OpenTelemetry SDK or collector, a plain HTTP JSON call, syslog over TLS, or a platform drain such as Vercel, Heroku or AWS CloudWatch. - A monitor alerted and you want the errors your API logged at the same minute. - You run on Vercel, Render or Fly.io and want function and request logs without another subscription. - You want to be told when your workers log more than a handful of errors in five minutes. - A nightly job should log a line every hour, and silence means it is stuck. ## Availability Logs is in **Alpha** on paid plans. The **Logs** section of the sidebar carries an Alpha badge while the product is in this phase, and features may still change. - Logs is not available yet for accounts restricted to EU data residency. - Owners, admins and members can create sources and alerts. Viewers and billing members can search. - Lines are kept 3, 7, 14 or 30 days, chosen per source. The **Usage** page shows the volume each source ingested this month. ## Key terms used in this article - **Source**: a named entry point for logs with its own token, retention and ingestion stats. - **Source token**: the secret that authenticates the lines a source sends. It starts with `hpl_` and is shown only once. - **Live tail**: a mode of the explorer that shows new lines as they arrive. - **Log alert**: a rule evaluated every minute that opens an incident when a search matches too many lines, or when lines stop. ## Send your first logs Go to [Logs → Sources](https://app.hyperping.io/logs/sources) to start. 1. Create a source Click **New source**, pick **HTTP JSON** under **Other** (or the platform you run on), give it a name such as `api-production`, then click **Create source**. 2. Copy the token Click **Copy token**. The token is shown only once, right after creation: Hyperping only stores its fingerprint. 3. Send a line Run the command shown under **Send your first lines**, or this one with your token: ```bash curl -X POST https://logs.hyperping.com/ \ -H "Authorization: Bearer $HYPERPING_LOGS_TOKEN" \ -H "Content-Type: application/json" \ -d '{"message":"Hello from curl","level":"info","service":"my-app"}' ``` The endpoint answers `202` once the line is stored. The panel switches to **First line received** within a few seconds. 4. Search it Click **Open live tail** or **Search this source**, then wire your application with one of the [source types](https://hyperping.com/docs/logs/sources). > **Let your coding agent do the wiring** > > After creating a source, **Set it up with an AI agent** gives you a prompt to paste into Claude Code, Cursor or Codex from your project. It contains the endpoint, the source type and what to check, and the agent adds the logging code for you. ## Where logs show up - **Explorer** (`/logs`): search, filter, live tail, saved views and export. See [Search and explore logs](https://hyperping.com/docs/logs/search). - **Incidents**: the **Logs** tab of an incident, scoped to **Matched by the alert**, **Warnings and errors** or **Every line**. - **Alerts** (`/logs/rules`): rules that open incidents from your logs. See [Log alerts](https://hyperping.com/docs/logs/alerts). - **Ask Hyperping** and the [MCP server](https://hyperping.com/docs/mcp): AI assistants can search your logs and group recent errors by pattern with the `search_logs`, `summarize_log_errors` and `get_outage_logs` tools. ## Next steps [ Log sources→ OpenTelemetry, HTTP JSON, syslog, Vector and platform drains. ](https://hyperping.com/docs/logs/sources)[ Search and explore→ Search syntax, filters, live tail, views and export. ](https://hyperping.com/docs/logs/search)[ Log alerts→ Open an incident on too many errors, or on silence. ](https://hyperping.com/docs/logs/alerts)[ Escalation policies→ Decide who gets paged when a monitor goes down. ](https://hyperping.com/docs/monitoring/escalation-policies) [← Uninstall the agent](https://hyperping.com/docs/server-monitoring/uninstall)[Log sources →](https://hyperping.com/docs/logs/sources) [](https://x.com/hyperping)[](https://www.linkedin.com/company/hyperping) © 2026 Hyperping --- Source: https://hyperping.com/docs/logs/alerts # Log alerts Open an incident when a search matches too many lines, or when lines stop arriving. Rules are evaluated every minute and reuse the explorer's search syntax. ![New alert form with Too many lines selected, the search level:>=error service:checkout, at least 10 lines within 5 minutes, the name Checkout errors, and a Last 24 hours preview chart](https://hyperping.com/static/logs-new-alert-ae51f047547be5439f450962a8ce719b.webp) A new alert on checkout errors, with a preview of how often it would have fired in the last 24 hours ## Overview Monitors tell you when an endpoint stops answering. Some failures never reach an endpoint: a payment provider rejecting every card, a queue worker throwing on each job, a cron that silently stopped. Your logs see those first. A log alert watches a search over a short window and opens an incident in your project when the count crosses your threshold. - More than 10 errors from the checkout service in 5 minutes. - Any `fatal` line, anywhere. - No line from the nightly import source for 2 hours. - A spike of `429` responses on your API, counted per service. > **During the Alpha, log alerts don't page anyone yet** > > A firing rule opens an incident in your project and shows in the notification bell of the dashboard, with the matching lines. It doesn't notify escalation policies or notification channels yet. Keep your monitors and their [escalation policies](https://hyperping.com/docs/monitoring/escalation-policies) as the alerts that wake people up. ## Prerequisites - At least one [log source](https://hyperping.com/docs/logs/sources) sending lines. - An owner, admin or member role to create, edit or delete alerts. ## Create an alert The fastest way is to start from a search: in the [explorer](https://hyperping.com/docs/logs/search), type the search you want to watch and click **Alert**. The form opens with that search filled in. You can also start from scratch: Go to [Logs → Alerts → New alert](https://app.hyperping.io/logs/rules) 1. Choose the condition Under **Alert when**, pick **Too many lines** to alert on a volume of matching lines, or **Lines stop** to alert on silence. 2. Write the search In **Lines matching**, use the same syntax as the explorer, such as `level:>=error service:checkout` or `"payment declined"`. 3. Set the threshold and window For **Too many lines**, set **Count** (**at least**, **more than**, **at most** or **fewer than**), the number of **Lines**, and the window in **Within**. For **Lines stop**, choose a source in **From source** and how long silence lasts in **For**. 4. Check the preview The **Last 24 hours** panel replays the rule over yesterday's lines and tells you how many times it would have fired. If it would have fired more than 24 times, raise the threshold or widen the window. 5. Name it and save Give it a **Name**, or leave it empty to generate one from the condition. Click **Create alert**. ## Options | Option | Description | Default | | --- | --- | --- | | **Lines matching** | The search to count. Optional for **Lines stop** if a source is set. Up to 1,000 characters. | None | | **Count** | **at least**, **more than**, **at most** or **fewer than** the number of lines. | at least | | **Lines** | The threshold. | 10 | | **Within** / **For** | The window: 1, 2, 5, 10, 15 or 30 minutes, or 1, 2 or 6 hours. | 5 min | | **From source** | For **Lines stop**: **Any source** or one source. | Any source | | **Count each service separately** | Evaluates the rule per service and opens one incident per service. | Off | ## How rules are evaluated - Every rule runs once a minute, over a window that ends 2 minutes before now. The delay leaves time for late lines to arrive, so counts are complete. - Lines are counted by the time Hyperping received them. - When the threshold is crossed, an incident opens right away, titled after the rule and the count, for example _Logs: Checkout errors: 14 lines in 5 min_. - The incident resolves on its own after a minute back under the threshold. - If you resolve the incident by hand, it won't reopen until a new window crosses the threshold again. - If the log pipeline is late or unreachable, the rule shows **Unknown** for that minute and nothing opens or resolves. **Lines stop** rules also wait a few minutes after such a gap, so an outage on Hyperping's side doesn't look like silence on yours. ## Alert states | State | Meaning | | --- | --- | | **OK** | The last evaluation was under the threshold. | | **Alerting** | An incident is open for this rule. | | **Pending** | Not evaluated yet. Rules run every minute. | | **Unknown** | Not evaluated because the log store was late or unreachable. | | **Paused** | Not evaluated until you resume it. | ## What the incident contains Each incident lists the 5 most recent matching lines and a link to the full search. Lines are redacted before they are attached: tokens, `Bearer` and `Basic` credentials, JWTs, common API keys (AWS, Stripe, Slack, GitHub), password-like values, emails, card numbers and the last part of IP addresses are masked. The incident's **Logs** tab shows everything around it. ## Manage alerts The **Log alerts** page lists every rule with its **State**, its **Last count** and when it was **Evaluated**. Each row has **Logs** (open the rule's search in the explorer), **Edit**, **Pause** or **Resume**, and delete. Editing a rule (other than its name), pausing it or deleting it closes its open incident without a recovery message. ## Use cases **Error spike on one service.** `level:>=error service:checkout`, at least 10 lines within 5 minutes. Raise the threshold until the preview shows a few firings a day at most. **A job that went quiet.** **Lines stop** on the `workers-production` source with `"job completed"`, for 1 hour. You hear about a stuck worker before the backlog does. **Errors per service.** `level:>=error` with **Count each service separately**. One noisy service opens its own incident without hiding the others. ## Limits - 50 alerts per project. - Windows from 1 minute to 6 hours. - A threshold of 0 with **at least** or **fewer than** is refused: the first is always true, the second never. To alert on any matching line, use **at least** 1. ## Next steps [ Search and explore→ Build the search before turning it into an alert. ](https://hyperping.com/docs/logs/search)[ Escalation policies→ Decide who gets paged for monitor incidents. ](https://hyperping.com/docs/monitoring/escalation-policies) [← Search and explore logs](https://hyperping.com/docs/logs/search)[Notification channels →](https://hyperping.com/docs/projects/notification-channels) [](https://x.com/hyperping)[](https://www.linkedin.com/company/hyperping) © 2026 Hyperping --- Source: https://hyperping.com/docs/logs/search # Search and explore logs Find the lines that explain an incident: search across every source, narrow down with filters, follow new lines live, and share what you found with a link. Go to [Logs → Explorer](https://app.hyperping.io/logs) ## Overview The explorer shows the newest lines first, with a histogram of volume per level above them. Every control writes into the search bar and the page URL, so a search, a time range or an open line can be shared with a teammate as a plain link. - You want every error the checkout service logged in the last hour. - You need the request that failed for a given user or order ID. - You are deploying and want to watch new lines arrive. - You found the culprit and want to hand a teammate the exact view. ## Pick a time range Use **15m**, **1h**, **24h** or **7d** next to the search bar, or **Custom…** to enter a **From** and **To** date. A search covers up to 7 days, within the last 30. On the histogram, drag across a range to zoom into it, or use **Earlier**, **Zoom out** and **Later**. Clicking a bar jumps the list to that moment. The **Incidents** toggle draws your incidents over the histogram, so you can see whether errors started before or after an outage. ## Search syntax Type in the search bar, or press `/` from anywhere on the page to focus it. Suggestions list your recent searches, field names and their values. The **?** button at the end of the bar opens the syntax reference. ![Search syntax popover listing examples such as timeout db, quoted phrases, -healthcheck, service:api and level:>=warn, above a list of checkout warnings and errors](https://hyperping.com/static/logs-search-syntax-9e114d245530a078683bd124b3f77515.webp) The search syntax reference, opened from the ? button, over a search for warnings and errors | Search | Matches | | --- | --- | | `timeout db` | Both words, anywhere in the message | | `"connection reset"` | The exact phrase | | `-healthcheck` | Lines without that word. Works on phrases and fields too: `-"GET /"`, `-service:web` | | `conn*` | Words starting with `conn` | | `service:api` | An exact field value. Works with `service`, `host`, `env` and `source`. `service:api*` matches a prefix | | `service:(api|web)` | Any of the listed values, up to 100. `-service:(api|web)` excludes them | | `level:error` | One level | | `level:>=warn` | Warnings and worse. `>`, `<=`, `<` and `=` also work | | `attr.user_id:42` | An attribute value. `attr.plan:*` matches lines that have the attribute | | `resource.k8s.namespace:prod` | An OpenTelemetry resource attribute | | `platform:vercel` | Lines from a platform drain | | `trace:4bf92f35…` | Every line of a trace. `span:` works the same way | A few rules apply to every search: - Every term must match. `OR` is not supported; for levels, use a comparison such as `level:>=warn`. - Words match whole words. Use `*` for a prefix. - Values with spaces take quotes: `service:"billing api"`. - Levels accept common aliases: `warning` is `warn`, `err` is `error`, `critical` and `panic` are `fatal`. - A search is limited to 1,000 characters and 20 terms. > **This search is too broad** > > A very wide search over 7 days can be refused. The explorer then offers **Search the last hour** or **Only warnings and errors**, which are usually what you wanted anyway. ## Filter without typing Click **Filters** to open the filter rail. It lists the values found in the current search for **Level**, **Service**, **Host**, **Environment** and **Source**, plus a few frequent attributes, with a count for each. - Tick a value to add it to the search, or click **only** to keep that value alone. - Click a level in the histogram legend to filter on it. Shift-click keeps that level and worse. - Counts marked **≈** are estimates on large volumes. The rail edits the search bar, so the URL always reflects what you see. ## Inspect a line Click a line, or move with ↑/↓ (or j/k) and press Enter, to open its detail panel. It shows the full message, the standard fields, and every attribute and resource attribute the line carries. ![Log line detail panel showing an ERROR from the checkout service, its message, fields such as host, env, severity and source, and attributes such as http.status\_code 504 and order\_id](https://hyperping.com/static/logs-line-detail-905e4fb634e3655400219c5bed318361.webp) The detail panel of an error line: message, fields, and the attributes sent with it From the panel: - **Lines around** shows the 20 lines before and after from the same source and host. - **Same pattern** finds every line with the same message shape, with the variable parts (IDs, durations) ignored. - **Lines of this trace** and **Search this trace** appear when the line has a trace ID. - **Copy for AI** copies the line and its context as Markdown, ready to paste into an assistant. **Copy JSON** copies the raw line. - Hover any field or attribute to filter on it, exclude it, show it as a column, or copy its value. - The link button copies a URL that opens this exact line. Messages longer than 32 KB are truncated in the panel. Press Esc to close it. ## Follow new lines live Click **Live** to show new lines as they arrive, over the last 15 minutes. The list keeps up to 5,000 lines and shows the arrival rate when traffic is high. New lines are held back while you scroll, hover the list or have a line open, so the line you are reading doesn't move. A band shows how many lines are waiting; click **Resume** or press Home to catch up. Stop live mode to go back to a normal search over the window on screen. A link ending in `?live=1` opens straight into live mode. ## Choose columns Click **Columns** to show or hide **Time**, **Level**, **Service**, **Host**, **Source** and **Trace**. The message is always shown. You can add up to 4 field columns, such as `attr.user_id` or `attr.http.status_code`, switch between **Comfortable** and **Compact**, and turn on **Wrap long messages**. Drag a column header to resize it. Column choices are saved for this project, in this browser. ## Save and share views A view stores the search, the time range, the columns and the filter rail. Open **Views** to use one: - **Built in** views: **Errors**, **Warnings and worse**, plus **HTTP 5xx** when your lines carry a status code and **Platform drains** when a drain source exists. - **Save current view** keeps up to 50 views of your own. - Each saved view has a copy-link button. Someone opening the link sees a banner with **Save to my views**. Saved views live in your browser, per project. Share them by link to give them to a teammate. ## Export lines The download button offers **Copy visible lines**, **Download CSV** and **Download JSON (NDJSON)**. Exports contain up to 10,000 lines of the current search, newest first, with times in UTC. ## Logs on incident pages Every incident has a **Logs** tab covering 15 minutes before it started to 5 minutes after. Switch between **Matched by the alert**, **Warnings and errors** and **Every line** to widen the view. ## Limits | Limit | Value | | --- | --- | | Time range of one search | 7 days, within the last 30 | | Lines per page | 200, more load as you scroll | | Search length | 1,000 characters, 20 terms | | Searches per project | 120 per minute, shared by the team | | Live tail buffer | 5,000 lines | | Export | 10,000 lines | ## Troubleshooting ### No logs match Check the time range first: the default is the last hour. The empty state offers to widen the range or clear the search, and shows each term as a chip you can remove one at a time. ### A word I can see in the message doesn't match Words match whole words. `time` doesn't match `timeout`; use `time*`. ### Too many searches The project ran more than 120 searches in a minute, often from several people in live mode or from an export. Wait a few seconds and retry. ## Next steps [ Log alerts→ Turn a search into an alert with the **Alert** button. ](https://hyperping.com/docs/logs/alerts)[ Log sources→ Send structured fields so you can filter on them. ](https://hyperping.com/docs/logs/sources) [← Log sources](https://hyperping.com/docs/logs/sources)[Log alerts →](https://hyperping.com/docs/logs/alerts) [](https://x.com/hyperping)[](https://www.linkedin.com/company/hyperping) © 2026 Hyperping --- Source: https://hyperping.com/docs/logs/sources # Log sources Connect the places your logs come from. Each source has its own token, its own retention and its own reception stats, so you can tell at a glance which service stopped sending. ![Log sources list showing six sources, including an HTTP JSON API, a Vercel drain, two OpenTelemetry services, an AWS CloudWatch source and a syslog source, with their last line, lines in 24 hours, volume and rejected count](https://hyperping.com/static/logs-sources-482a24b97fb86db6949b925c2722a880.webp) Log sources with their platform, type, last line received and volume over 24 hours ## Overview A source is a token plus a retention. Anything that holds the token can send lines to Hyperping: an OpenTelemetry SDK or collector, an HTTP client, rsyslog, or a hosting platform's log drain. Create one source per service and environment, such as `api-production` and `api-staging`, so you can revoke, filter and size them separately. - Your app already uses OpenTelemetry and you want its logs next to your monitors. - You deploy on Vercel, Heroku, Render, Fly.io, Railway, Cloudflare Workers, Supabase or Netlify and want the platform to push its logs. - Your Lambdas and ECS tasks log to CloudWatch. - Your servers already run rsyslog or Vector. ## Prerequisites - A paid plan. Logs is in Alpha on paid plans and not yet available for EU-only accounts. See [Logs](https://hyperping.com/docs/logs). - An owner, admin or member role to create or revoke sources. ## Create a source Go to [Logs → Sources → New source](https://app.hyperping.io/logs/sources) ![New source form with a grid of platforms (Vercel, Heroku, Render, Fly.io, Railway, Cloudflare Workers, AWS CloudWatch, Supabase, Netlify), protocols (OpenTelemetry, HTTP JSON, Syslog over TLS) and fields for name, description, retention and rate cap](https://hyperping.com/static/logs-new-source-1abd1a3f39b4eed56569e93b8737468a.webp) Creating an HTTP JSON source: pick a platform or a protocol, then name it and choose its retention 1. Pick where the logs come from Under **Connect a platform**, choose your hosting platform. Under **Other**, choose **OpenTelemetry**, **HTTP JSON** or **Syslog over TLS** to send them yourself. 2. Name it Fill in **Name** (it shows in the list and in the explorer's filters) and, optionally, a **Description** of what sends to it and who owns it. 3. Choose a retention Pick 3, 7, 14 or 30 days in **Retention**. The default is 7 days; Vercel suggests 3. 4. Create it and copy the token Click **Create source** (or **Create and connect** for a platform). Copy the token right away with **Copy token**: it is shown only once, and Hyperping only keeps its fingerprint. 5. Send your first lines The panel shows the setup for the type you picked, with your token already filled in, and waits for the first line. Use **Send a test log** to check the pipeline end to end, then **Open live tail** or **Search this source**. > **Set it up with an AI agent** > > The panel also offers a prompt to paste into Claude Code, Cursor or Codex from your project. The agent adds the logging setup for that source type and checks that lines arrive. ## Endpoints and authentication | Protocol | Endpoint | | --- | --- | | HTTP JSON | `POST https://logs.hyperping.com/` | | OpenTelemetry (OTLP/HTTP) | `POST https://logs.hyperping.com/v1/logs` | | Syslog over TLS | `logs.hyperping.com:6514` | HTTP requests authenticate with the source token in an `Authorization: Bearer ` header. Tokens start with `hpl_`. Syslog carries the token in the structured data of each message, as in the rsyslog example below. The endpoint answers `202 Accepted` once the lines are durably stored, so a client that retries on any other answer won't lose lines. ## Send logs yourself Pick the tab that matches your stack. Replace the token placeholder with your source token, ideally from an environment variable. ```bash curl -X POST https://logs.hyperping.com/ \ -H "Authorization: Bearer $HYPERPING_LOGS_TOKEN" \ -H "Content-Type: application/json" \ -d '{"message":"Hello from curl","level":"info","service":"my-app"}' ``` - **OpenTelemetry**: OTLP over HTTP, protobuf or JSON, gzip accepted. gRPC is not supported. Traces and metrics sent to the same endpoint are accepted but not stored. The environment variables work with any OpenTelemetry SDK (Node.js, Python, Go, Java, .NET, Ruby). - **Vector**: the `http` sink batches lines as a JSON array and retries on failure. - **rsyslog**: RFC 5424 over TLS. The token travels in the structured data and is not stored with the line. The disk queue covers network cuts. ### HTTP JSON format Send one JSON object, an array of objects, or NDJSON (one object per line). Gzip and deflate request bodies are accepted. Hyperping reads the standard fields under their usual names and keeps everything else as attributes, searchable with `attr.`. Nested objects are flattened with dots: in the example below, `status_code` is searchable as `attr.http.status_code:504`. ```json [ { "timestamp": "2026-10-03T14:16:32.609Z", "level": "error", "message": "Timeout after 5000ms calling inventory-service", "service": "checkout", "environment": "production", "host": "api-prod-2", "trace_id": "4bf92f3577b34da6a3ce929d0e0e4736", "order_id": "ord_8f2K1x", "http": { "method": "POST", "path": "/api/checkout", "status_code": 504 } } ] ``` | Field | Keys recognized | | --- | --- | | Time | `timestamp`, `time`, `@timestamp`, `ts`, `dt`, `datetime`, `date` | | Message | `message`, `msg`, `@message`, `log`, `text` | | Level | `level`, `severity`, `level_name`, `lvl`, `levelname`, `log.level`, `loglevel`, `severity_text` | | Service | `service`, `service.name`, `app`, `application` | | Environment | `environment`, `env`, `deployment.environment` | | Host | `host`, `hostname`, `host.name` | | Trace and span | `trace_id`, `span_id` | The format is compatible with Logtail (Better Stack) HTTP payloads, so a JSON shipper already pointed at Logtail only needs a new URL and token. ## Connect a platform Platform sources point the platform's own log drain at Hyperping. After you create one, the panel lists the exact values to paste, the steps in the platform's dashboard, and a curl command to check the token first. | Platform | How it connects | | --- | --- | | **Vercel** | Log drain (Team Settings → Drains) to `https://logs.hyperping.com/vercel`, JSON format, with the token in a custom `Authorization` header. Drains need a Vercel Pro or Enterprise team. | | **Heroku** | HTTPS drain added with the Heroku CLI, or a telemetry drain on Fir. | | **Render** | Log stream (Integrations → Observability → Log Streams) to `logs.hyperping.com:6514` with the token. | | **Fly.io** | The `fly-log-shipper` app with an HTTP sink. | | **Railway** | A Locomotive sidecar sending JSON to `https://logs.hyperping.com/`. | | **Cloudflare Workers** | Workers OpenTelemetry export to `/v1/logs`, or a Workers Logpush job. | | **AWS CloudWatch** | A CloudFormation stack that subscribes your log groups to a Firehose stream, launched from the panel or with the AWS CLI. | | **Supabase** | Log drain (Project Settings → Log Drains) to `https://logs.hyperping.com/`. | | **Netlify** | Log drain to `https://logs.hyperping.com/`, NDJSON format. | ```bash heroku drains:add "https://x:@logs.hyperping.com/heroku" -a ``` Lines from a platform carry its name: search them with `platform:vercel`, or use the **Platform drains** view. DigitalOcean App Platform can't forward logs to a custom endpoint, so it isn't supported. > **Check the platform's own billing** > > Some platforms charge for their drains, such as Vercel per GB sent. The setup panel notes it when it applies. ## Manage a source Click a source in the list to open it. ![Source detail with last line, lines, volume and rejected counts over 24 hours, Send a test log and View logs buttons, and settings for description, retention and rate cap](https://hyperping.com/static/logs-source-detail-840fa8d8e55e7e22110f33a6493616bb.webp) A source opened: reception stats for the last 24 hours, settings, and the latest ingestion errors - **Last line**, **Lines, 24 h**, **Volume, 24 h** and **Rejected, 24 h** show what the source received. The list updates every minute; a green dot means a line arrived in the last 5 minutes. - **Send a test log** sends a line through the source; **View logs** opens the explorer filtered on it. - **Settings** edits the **Description**, the **Retention** and the **Rate cap**. A new retention applies to new lines, within about a minute; lines already stored keep theirs. - **Latest ingestion errors** lists refused requests over the last 7 days, with the reason. - **About** shows the **Source ID**. Search a source's lines with `source:`. ### Revoke a source Under **Danger zone**, click **Revoke…**. Anything sending with its token is refused with a `401` within a minute. Lines already stored stay searchable until their retention ends. > **Lost or leaked token** > > Tokens can't be shown again or rotated. Create a new source, switch your senders to its token, then revoke the old one. ## Limits | Limit | Value | | --- | --- | | Sources per project | 50 active | | Retention | 3, 7, 14 or 30 days, per source | | Request body | 10 MiB compressed, 32 MiB decompressed (`413` above) | | Message | Truncated at 64 KiB | | Attributes | 128 per line, values truncated at 16 KiB, keys at 256 characters | | Timestamps | From 48 hours in the past to 10 minutes in the future; others are clamped | | Rate | Per project, by plan, with a daily volume cap. Above it the endpoint answers `429` with a `Retry-After` header | ## Troubleshooting ### The source stays on "Waiting for the first log" Run the curl command from the panel with the same token. A `401` means the token is wrong or revoked. If curl works, the problem is in your app's configuration: check the endpoint path (`/v1/logs` for OpenTelemetry, `/` for JSON) and that the exporter is enabled. ### Requests answer 415 The content type isn't supported. Send JSON, NDJSON or OTLP (protobuf or JSON), and set `Content-Type` accordingly. ### The Rejected count goes up Open the source and read **Latest ingestion errors**. The usual reasons are **Rate limited**, **Daily cap reached**, **Request too large**, **Malformed request** and **Timestamp out of range**. ### Lines arrive without a level or service Hyperping didn't find them under a recognized key. Rename the field in your logger, or set `OTEL_SERVICE_NAME` with OpenTelemetry. The raw value stays available as an attribute meanwhile. ## Next steps [ Search and explore→ Search syntax, filters, live tail and views. ](https://hyperping.com/docs/logs/search)[ Log alerts→ Get an incident when a source goes quiet. ](https://hyperping.com/docs/logs/alerts) [← Logs](https://hyperping.com/docs/logs)[Search and explore logs →](https://hyperping.com/docs/logs/search) [](https://x.com/hyperping)[](https://www.linkedin.com/company/hyperping) © 2026 Hyperping --- Source: https://hyperping.com/docs/projects/audit-logs # Audit logs Audit logs record every configuration change made in your project: what changed, who made the change, and when. They give owners and compliance teams a complete, attributable history of the account. ## What gets logged - Monitor changes: created, edited, paused, resumed, or deleted monitors. - Status page changes: settings, services, and published incidents. - Alerting changes: escalation policies, on-call schedules, and notification channels. - Team changes: teammate invitations, removals, and role updates. - Integration changes: connected or removed integrations. - API key activity: changes made with an API key, over the [REST API](https://hyperping.com/docs/api/overview) or the [MCP server](https://hyperping.com/docs/mcp), appear as `ApiKeyWriteAction` entries with the key as their target. A read-only key that attempts a change leaves an `ApiKeyPermissionDenied` entry. ## What each entry contains Every entry records the action that was performed, the teammate who performed it, and a precise timestamp. This makes it easy to answer questions like "who disabled this monitor last Tuesday" or "when was this escalation policy changed". ## Common use cases - **Compliance:** provide an audit trail for SOC 2, ISO 27001, or internal security reviews. Logs can be exported for compliance reporting. - **Incident retros:** reconstruct configuration changes that happened around an incident. - **Debugging alerting:** find out when and by whom an escalation policy or notification channel was modified. - **Offboarding:** review the activity of a teammate before removing them from the project. See [Invite teammates](https://hyperping.com/docs/projects/teammates). ## Access and permissions Audit logs cover activity across the whole project. > **Who can perform which actions?** > > For details on who can perform and review which actions, see [Roles and permissions](https://hyperping.com/docs/projects/roles-permissions). ## Plan availability Audit logs are available on the [Business plan](https://hyperping.com/pricing). ## Next steps [ Roles and permissions→ What each role can see and do across the project. ](https://hyperping.com/docs/projects/roles-permissions)[ Invite teammates→ Invitations, removals, and role updates all show up in the logs. ](https://hyperping.com/docs/projects/teammates)[ Set up SAML SSO→ Centralize sign-in through your IdP for SOC 2 and ISO 27001. ](https://hyperping.com/docs/projects/saml-sso)[ Project setup→ How projects scope monitors, teammates, and settings. ](https://hyperping.com/docs/projects/project-setup) [← Roles and permissions](https://hyperping.com/docs/projects/roles-permissions)[Invite teammates →](https://hyperping.com/docs/projects/teammates) [](https://x.com/hyperping)[](https://www.linkedin.com/company/hyperping) © 2026 Hyperping --- Source: https://hyperping.com/docs/projects/login-methods # Login methods Three ways to sign in to Hyperping. Pick what fits your security posture: single sign-on over SAML or OpenID Connect for centralized identity, Google for one-click access, or email and password for the universal fallback. Combine them, or require the strongest. > **Useful when** > > - You're rolling out SSO across the team and need to decide the migration path. > - You need to restrict contractors to a specific set of projects. > - You're preparing for a SOC 2, ISO 27001, or vendor security review. ![Hyperping sign-in screen with Google, SAML SSO, and email login options](https://hyperping.com/static/login-methods-1f65ba002627cd3b1e0a0c4ad6c40890.webp) The sign-in screen: Google, SAML SSO, or email and password ## At a glance Methods 3 sign-in paths SSO SAML 2.0 or OpenID Connect, from Pro Providers Any SAML 2.0 or OIDC provider 2FA Available on all plans ## The three login methods Every user authenticates through one of these. Single sign-on is the strongest, the other two stay available as fallbacks. ### Single sign-on (SSO) Pro and Business plans Authenticate your team through your identity provider, over SAML 2.0 or OpenID Connect. Users sign in at your IdP, and Hyperping trusts its response. **Best for**Teams standardizing on one IdP, regulated environments, and centralized offboarding. What you get - Pro includes native SAML connections for Okta, Microsoft Entra ID (Azure AD), Google Workspace, KeyHub and JumpCloud. Other SAML providers through WorkOS require Business - Pro also includes OpenID Connect, for Auth0, Okta, Entra ID, Keycloak and any other OIDC provider - Tunable authentication policy, provisioning, and per-project access scope - Owner accounts stay accessible via email fallback so you never lock yourself out - Aligns with SOC 2 and ISO 27001 access-control controls Works with OktaMicrosoft Entra IDGoogle WorkspaceAuth0KeycloakOneLoginJumpCloudSAML 2.0OpenID Connect ### Sign in with Google All plans One-click OAuth for teammates who already sign in with a Google account. **Best for**Small teams on Google Workspace, or a simple fallback during SSO rollout. What you get - Zero configuration, just pick "Sign in with Google" on the login screen - Matches the email on file, no separate password to manage - Combines with SSO when set to "allow both" ### Email and password All plans Classic credentials backed by 2FA. Always available for the Owner as a lockout fallback. **Best for**The Owner fallback, or teams that do not have a central IdP yet. What you get - Passwords stored with bcrypt, never logged or exposed in API responses - Two-factor authentication available on every plan - Can be disabled for non-Owner users via the "Require SSO" policy ## Enable single sign-on Native SAML and OpenID Connect sign-in to the Hyperping account are included from Pro at no extra charge. SSO connections for private status pages are a separate Business option. See [status page SSO](https://hyperping.com/docs/status-page/sso) for that setup and pricing. Three steps from an empty SSO tab to every teammate signing in through your IdP. 1. Open the authentication tab Go to [Members](https://app.hyperping.io/teammates?view=authentication) and switch to the **Authentication** tab. Click **Configure** on your identity provider's card, or on the **OpenID Connect** card. 2. Exchange the connection details For SAML, copy Hyperping's ACS URL and entity ID into your IdP and paste back the IdP metadata URL or XML. For OpenID Connect, register Hyperping's callback URL and paste back the issuer, client ID and client secret. The setup dialog walks through each field. 3. Pick policies and test Set your authentication, provisioning, and access-scope policies below. Run the built-in test sign-in before flipping `Require SSO`. > **Want the full walkthrough?** > > The [SAML SSO setup guide](https://hyperping.com/docs/projects/saml-sso) covers each step in detail, including the exact ACS URL and entity ID fields for Okta, Microsoft Entra ID, and Google Workspace. For OpenID Connect, follow [Set up OpenID Connect SSO](https://hyperping.com/docs/projects/oidc-sso) or the [Auth0 guide](https://hyperping.com/docs/sso/auth0). ## Authentication policy Decide whether SSO is optional or mandatory for non-Owner users. ### Allow both methods During rollout Users choose SSO or email and password. Keep this while migrating, or when the team needs a break-glass path outside the IdP. ### Require SSO Recommended Non-Owner users must use the IdP. The Owner keeps email and password as a lockout fallback, supporting SOC 2 and ISO 27001 controls. ## New user provisioning Three ways to handle the first SSO login from a user you haven't invited yet. Pick the one that matches your trust model. 1. 01 ### Invite-only Most secure SSO login fails unless an admin already invited the user. You keep full control over who can reach the account. `IdP login → not invited → rejected` 2. 02 ### Request access Balanced New users land on a pending screen. Admins get notified and approve or deny them from the Teammates page. `IdP login → pending → admin approval` 3. 03 ### Auto-provision Frictionless Anyone with a matching email domain joins automatically when your IdP is the source of truth for employment. `IdP login → domain match → member` ## SSO access scope Control which projects SSO users reach once they're in. ### All projects Default SSO users can be invited into any project in the account. This is the simplest access model. ### Specific projects only Scoped Restrict SSO users to selected projects for contractors, isolated environments, or client work. > **How does this interact with roles?** > > See [roles and permissions](https://hyperping.com/docs/projects/roles-permissions) for how project isolation interacts with SSO scope. ## Change email To change the email on your Hyperping account, open [account settings](https://app.hyperping.io/settings/general), edit the email field, and click **Save**. A confirmation link goes to the new address. ## Troubleshooting **SSO login returns "user not found"** Your provisioning policy is set to **Invite-only**. Invite the user from the [Teammates page](https://app.hyperping.io/teammates), or switch provisioning to **Request access** or **Auto-provision**. **I enabled "Require SSO" and locked myself out** Owner accounts are exempt by design and can always sign in with email and password. Log in as the Owner, go to **Teammates → Authentication**, and relax the policy. **An SSO user can see projects they shouldn't** Check **SSO access scope**. If it's set to **All projects**, they inherit access per invite. Switch to **Specific projects only** and pick the allowed set. **My IdP doesn't appear in the supported list** Any SAML 2.0 compliant provider works through the generic SAML configuration in the setup wizard, and any OpenID Connect provider through the [OpenID Connect card](https://hyperping.com/docs/projects/oidc-sso). If you hit a snag, [contact us](mailto:hello@hyperping.io) with your IdP's details. ## Next steps [ Roles and permissions→ Four roles, project-level isolation. How scope and role decide what each user sees. ](https://hyperping.com/docs/projects/roles-permissions)[ Invite teammates→ Add people to your project and assign a role. Works for both SSO and email users. ](https://hyperping.com/docs/projects/teammates)[ Project setup→ Shape your workspace before inviting the team. Clients, teams, or environments. ](https://hyperping.com/docs/projects/project-setup)[ Notification channels→ Configure how each role gets notified during incidents. ](https://hyperping.com/docs/projects/notification-channels) [← Notification channels](https://hyperping.com/docs/projects/notification-channels)[Roles and permissions →](https://hyperping.com/docs/projects/roles-permissions) [](https://x.com/hyperping)[](https://www.linkedin.com/company/hyperping) © 2026 Hyperping --- Source: https://hyperping.com/docs/projects/notification-channels # Notification channels Get notified the moment an outage is detected, and again when it resolves. Configure as many channels as you want in [Integrations](https://app.hyperping.io/integrations). > **Who gets notified, and when?** > > Channels define **where** alerts are delivered. To control **who** gets notified and **when**, set up [escalation policies](https://hyperping.com/docs/monitoring/escalation-policies) and [on-call schedules](https://hyperping.com/docs/monitoring/on-call). ![Notification channels interface](https://hyperping.com/static/notification-channels-de1ab588007c2719d84af5efc182c317.webp) Notification channels are configured per project in Integrations. ## Via email Notifications sent via email use the email you signed up with, at an account level. You will receive email notifications to this email on any incident across all projects. To modify your email, head to your [account settings](https://app.hyperping.io/settings/general), edit your email and click **Save**. You will receive an email to confirm your new email address. ## Via SMS Hyperping allows you to receive SMS notifications. The phone number is set at an account level. You will receive SMS notifications to this phone number on any incident across all projects. ### SMS credits SMS alerts use credits included in your plan: 20 per month on Essentials, 75 on Pro, and 200 on Business. Credits cover teammate SMS alerts across all your projects. SMS notifications sent to your status page subscribers are separate: they go through your own connected Twilio account and do not consume plan credits. See the [Twilio integration](https://hyperping.com/docs/integrations/twilio). If your team needs more SMS credits, contact support. To add or modify your phone number, head to your [account settings](https://app.hyperping.io/settings/general). ## Slack Alerts Webhook Use this integration to receive downtime and up notifications via your selected Slack channel. Follow the link in the project, select your Slack channel, then copy and paste the url to your project setting's integration. ### Test your Slack integration You can send **Down** and **Up** fake alerts to test your integration. ## Teams Alerts Use this integration to receive downtime and up notifications via your selected Teams channel. Follow the link in the project, select your Teams channel, then copy and paste the url to your project setting's integration. ## Slack Incident Manager This integration is used to post to your preferred Slack channel every time you manually publish an incident to your status page via Hyperping. You can either create a new channel for every new incident, or select a permanent one. > **Invite the bot to your channel** > > After connecting your Slack account, you must manually invite the **@Hyperping Ongoing Incident** bot to the channel of your choice. ## Webhook Webhooks allow you to push Hyperping events to third-parties you're already using whether it's in your in-house system or an application that's not yet integrated with Hyperping. When an outage arises, the webhook URL receives a POST request with a **check.down** event. When the outage ends, a **check.up** event is sent. See the [webhooks documentation](https://hyperping.com/docs/integrations/webhooks) for the full payload reference. ### Test your webhook Before any outage eventually happens, you can test both events using the test buttons below the webhook url field. ## OpsGenie integration Hyperping will automatically start and close an OpsGenie alert during an outage. See the [OpsGenie integration guide](https://hyperping.com/docs/integrations/opsgenie) to set it up. ## PagerDuty integration Hyperping will automatically start and close a PagerDuty alert during an outage. See the [PagerDuty integration guide](https://hyperping.com/docs/integrations/pagerduty) to set it up. ## Telegram notifications Hyperping will send down and up notifications via your preferred Telegram group. Invite the **@HyperpingAlertsBot** bot to your Telegram Group, and paste the chat ID given by the bot upon invitation into your [project settings](https://app.hyperping.io/project). > **Note** > > Some IDs given by the bot can start with a hyphen (-). ## Connect Twilio This integration allows to send SMS notifications to status page subscribers when you manually publish an incident. See [SMS notifications for status pages](https://hyperping.com/docs/status-page/sms-notifications) to set up the integration. ## Next steps [ Escalation policies→ Page channels step by step with delays, instead of all at once. ](https://hyperping.com/docs/monitoring/escalation-policies)[ On-call schedules→ Send alerts to whoever is on duty when the incident starts. ](https://hyperping.com/docs/monitoring/on-call)[ Webhooks reference→ Full payload reference for check.down and check.up events. ](https://hyperping.com/docs/integrations/webhooks)[ All integrations→ Browse every integration and how to connect it. ](https://hyperping.com/docs/integrations) [← Invite teammates](https://hyperping.com/docs/projects/teammates)[Login methods →](https://hyperping.com/docs/projects/login-methods) [](https://x.com/hyperping)[](https://www.linkedin.com/company/hyperping) © 2026 Hyperping --- Source: https://hyperping.com/docs/projects/oidc-sso # Set up OpenID Connect SSO Let your team sign in to Hyperping through any OpenID Connect provider, such as Auth0, Okta, Microsoft Entra ID or Keycloak. Use it when your identity team would rather not maintain a SAML application for Hyperping. OpenID Connect (OIDC) is the sign-in layer of OAuth 2.0. You register Hyperping as a web application in your identity provider, paste three values back into Hyperping, and run a test sign-in. Enforcement, provisioning and project access work as they do for [SAML SSO](https://hyperping.com/docs/projects/saml-sso), and OpenID Connect is included from Pro at no extra charge. - Your identity team runs Auth0 and does not want to set up SAML for a single tool. - Your other internal apps already sign in through OIDC clients in Okta, Entra ID or Keycloak. - You want the same identity provider for the Hyperping dashboard and for your private status pages. ![Configure OpenID Connect sign-in dialog with the Auth0 steps, the callback URL, and the domain, client ID, client secret and email domains fields](https://hyperping.com/static/oidc-config-1f987571a53e6bfaec2d19b3ba17ac90.webp) The setup dialog: the steps for your provider, the callback URL to copy, and the values checked before saving > **Protecting a status page instead?** > > This guide covers dashboard sign-in for your team. To put a private status page behind your identity provider, create an OpenID Connect connection under **Status Pages → SSO Connections**. See [Status page SSO](https://hyperping.com/docs/status-page/sso). ## Prerequisites - A Hyperping **Pro** or **Business** plan. See [pricing](https://hyperping.com/pricing) for plan details. - The **Owner** or **Admin** role in Hyperping. See [Roles and permissions](https://hyperping.com/docs/projects/roles-permissions). - Admin access to your identity provider, to create an application. - No SAML provider configured in Hyperping. The account uses one dashboard SSO provider at a time, so remove a SAML configuration before you switch to OpenID Connect. ## The callback URL Your identity provider needs one Hyperping address, the URL it sends people back to after they sign in: `https://api.hyperping.io/v1/auth/sso/oidc/callback` The setup dialog shows it with a copy button. The same URL serves dashboard sign-in, status page connections and test sign-ins, so one application in your identity provider can be used for all three. Each provider names the field differently: | Provider | Field for the callback URL | | --- | --- | | Auth0 | Allowed Callback URLs | | Okta | Sign-in redirect URIs | | Microsoft Entra ID | Redirect URI, on the Web platform | | Keycloak | Valid redirect URIs | ## Step 1: Open the OpenID Connect setup Go to [Members → Authentication](https://app.hyperping.io/teammates?view=authentication) and click Configure on the OpenID Connect card. ![Authentication tab with the Microsoft Entra ID, Google Workspace, Okta, KeyHub, JumpCloud, OpenID Connect and Other Providers cards](https://hyperping.com/static/sso-providers-17b188afa457e75d3b8090dd2aac7610.webp) The OpenID Connect card sits below the SAML providers ## Step 2: Create the application in your identity provider At the top of the dialog, pick **Auth0**, **Okta**, **Microsoft Entra ID** or **Other** to see the steps for that provider. In every case you create a web application with a client secret, register the callback URL, and give access to the people who need Hyperping. | Provider | Application to create | Issuer to paste in Hyperping | | --- | --- | --- | | Auth0 | **Applications → Applications → Create Application**, type **Regular Web Applications** | The **Domain**, for example `acme.eu.auth0.com` | | Okta | **Applications → Applications → Create App Integration**, then **OIDC - OpenID Connect** and **Web Application** | Your Okta domain, for example `https://acme.okta.com` | | Microsoft Entra ID | **App registrations → New registration**, single tenant, **Web** platform, plus a client secret under **Certificates & secrets** | `https://login.microsoftonline.com//v2.0` | | Keycloak | **Clients → Create client**, type **OpenID Connect**, **Client authentication** on, **Standard flow** enabled | `https:///realms/` | | Other | A confidential web application that uses the authorization code flow | The URL that comes before `/.well-known/openid-configuration` | Hyperping requests the `openid`, `email` and `profile` scopes, which providers allow by default. With Entra ID, copy the secret's **Value**, not its **Secret ID**. > **Using Auth0?** > > The [Auth0 guide](https://hyperping.com/docs/sso/auth0) covers the Auth0 screens one by one, including the **Connections** tab that decides who can sign in. ## Step 3: Enter the values in Hyperping 1. Paste the issuer Auth0 calls it **Domain**, the other providers **Issuer URL**. You can paste a bare domain, the issuer URL, or the full discovery URL ending in `/.well-known/openid-configuration`. 2. Paste the client ID and client secret Hyperping stores the secret encrypted and never shows it again. When you edit the configuration later, leave **Client secret** empty to keep the saved one. 3. List your email domains In **Email domains**, enter the domains your teammates use, separated by commas, for example `acme.com`. People who sign in with an email at these domains are sent to your identity provider. A domain can belong to one SSO configuration only. 4. Check and save Click **Check values**. Hyperping reads your provider's discovery document and asks it whether it accepts the client ID and secret, without signing anyone in. Then click **Save configuration**. ## Step 4: Test the sign-in Click **Test sign-in**, right after saving or later on the OpenID Connect card. A popup opens your identity provider: sign in with your work account. The test runs the whole sign-in and checks the token your provider returns, but signs nobody in to Hyperping. ![Test connection report for dashboard sign-in: Sign-in works, with nine passed checks](https://hyperping.com/static/oidc-test-report-380b7803db5fad2110fae7fe315a919b.webp) A passing test lists each check and the email address your provider sent | Check | What Hyperping verifies | | --- | --- | | **Sign-in** | Your provider sent the person back with an authorization code. | | **Discovery** | The issuer still publishes the discovery document saved with the configuration. | | **Code exchange** | The provider accepted the client ID, the secret and the PKCE verifier, and returned an ID token. | | **Signature** | The ID token is signed with a key the provider publishes (RS256, PS256, ES256 and their stronger variants) or with the client secret (HS256). Unsigned tokens are refused. | | **Issuer** | The token comes from the issuer saved in the configuration. | | **Audience** | The token was issued for your client ID. | | **Nonce** | The token answers this sign-in request and was not replayed from another one. | | **Clock** | The token is inside its validity window, with 60 seconds of tolerance. | | **Email** | The token carries an email address your provider has verified. | When a check fails, the report explains why and whether the fix belongs in Hyperping or in your identity provider. ## Set the SSO policies Once the configuration is saved, the card shows your email domains and issuer, and the **OpenID Connect SSO Policies** appear below it. They follow the same rules as the SAML policies, described in [Login methods](https://hyperping.com/docs/projects/login-methods). ![OpenID Connect card marked Configured with the acme.com domain, followed by the authentication policy, new user provisioning and SSO access scope settings](https://hyperping.com/static/oidc-policies-b856c0b69a9a52ef19a6b8a6b5fd2e83.webp) A configured OpenID Connect card and its policies | Policy | Options | Default | | --- | --- | --- | | **Authentication policy** | **Allow SSO and email/password**, or **Require SSO**. The Owner can always sign in with email and password. | Allow SSO and email/password | | **New user provisioning** | **Invite-only**, **Request access**, or **Auto-provision** for emails at your domains. | Invite-only | | **SSO Access Scope** | **All projects**, or **Specific projects only**. | All projects | ## How teammates sign in On the Hyperping sign-in page, teammates click **Sign in with SAML SSO**, enter their work email and click **Sign in**. The button keeps this label for every provider, OpenID Connect included. Hyperping finds your configuration from the email domain and sends them to your identity provider. Once the provider has confirmed who they are: - Someone who already belongs to your Hyperping account, as Owner, teammate or account member, is signed in. - An email that belongs to another Hyperping account is refused. That person signs in with their password, or you invite them to your account. - Someone new needs an email at one of your email domains. The provisioning policy then decides whether they join, wait for approval, or are refused. - The email must be verified by your provider. Hyperping refuses an address marked `email_verified: false`. ## Troubleshooting **Check values says "Nothing at ... (HTTP 404)"** The issuer is wrong. Paste the address that comes before `/.well-known/openid-configuration`. For Entra ID it is `https://login.microsoftonline.com//v2.0`, for Keycloak `https:///realms/`. **Check values says the discovery document names another issuer** Some providers publish an issuer that differs from the URL you typed, for example an Okta custom authorization server (`https://acme.okta.com/oauth2/default`) or an Auth0 custom domain. Paste the exact issuer quoted in the message. **"The identity provider refused this client ID and secret"** Copy both values again from the same application. If the secret was rotated or has expired, which happens with Entra ID secrets, create a new one, click **Edit** on the OpenID Connect card and paste it. **Sign-in fails with "This email belongs to another Hyperping account"** The person already has a Hyperping account outside yours. They can sign in with their password, or an Owner or Admin of your account can invite them. **Sign-in fails with "Your identity provider has not verified this email address"** Verify the address in your identity provider, then sign in again. In Auth0, users of a database connection must confirm their email first. **The sign-in page says "This email isn't available with SAML/SSO"** The email's domain is not in the **Email domains** of your configuration. Click **Edit** on the OpenID Connect card and add it. ## Next steps [ Auth0→ The Auth0 application settings, step by step. ](https://hyperping.com/docs/sso/auth0)[ Status page SSO→ Put private status pages behind the same identity provider. ](https://hyperping.com/docs/status-page/sso)[ Login methods→ Compare SSO, Google sign-in, and email and password. ](https://hyperping.com/docs/projects/login-methods)[ SAML SSO→ Okta, Entra ID, Google Workspace, KeyHub and JumpCloud over SAML. ](https://hyperping.com/docs/projects/saml-sso) [← JumpCloud](https://hyperping.com/docs/sso/jumpcloud)[Auth0 →](https://hyperping.com/docs/sso/auth0) [](https://x.com/hyperping)[](https://www.linkedin.com/company/hyperping) © 2026 Hyperping --- Source: https://hyperping.com/docs/projects/project-setup # Project setup Organize your monitoring, status pages, and team access into separate workspaces. Projects are the top-level containers in Hyperping. Every monitor, status page, teammate invitation, maintenance window, and API token belongs to a specific project. This means you can run completely separate monitoring setups from a single Hyperping account, each with its own team members and notification channels. Projects are useful when: - You manage multiple clients and want to keep their monitoring isolated - Different teams in your organization need their own dashboards and alerts - You want to separate production and staging environments - You need project-level access control so teammates only see what they should ![Project view interface showing the project dropdown and settings](https://hyperping.com/static/project-view-92ef2397f6c3338bfda2aa6383719f1d.webp) The project dropdown lets you switch between projects and create new ones. ## How projects work > **Usage is counted at the account level** > > You can create unlimited projects within a single account. Plan limits, including the number of monitors and teammates, apply across all of them. When you sign up for Hyperping, a default project called **Untitled project** is created automatically. You can rename it in your [project settings](https://app.hyperping.io/project). ## Create a new project 1. Open the project dropdown Click the project dropdown at the top-left of the screen. 2. Create the project Click **Create a new project +**. 3. Name it Give the project a descriptive name in [project settings](https://app.hyperping.io/project). 4. Bring in your team [Invite teammates](https://hyperping.com/docs/projects/teammates) and [set up notification channels](https://hyperping.com/docs/projects/notification-channels) for the new project. ## What belongs to a project | Resource | Scope | | --- | --- | | Monitors | Created and managed per project | | Status pages | Tied to a single project | | Teammates | Invited per project, only see that project | | Notification channels | Configured per project | | Escalation policies | Defined per project | | API tokens | Scoped to a single project | | Maintenance windows | Scheduled per project | ## Common project structures **By client:** Agencies and MSPs create one project per client. Each client's team only sees their own monitors and status page. **By team:** Larger organizations split projects by team (infrastructure, backend, frontend) so each group manages their own alerts independently. **By environment:** Separate production monitoring from staging to avoid alert noise from non-critical environments. > **Who can see which project?** > > Teammates only have access to projects they were explicitly invited to. See [roles and permissions](https://hyperping.com/docs/projects/roles-permissions) for how project isolation works, then [invite your team](https://hyperping.com/docs/projects/teammates). ## Troubleshooting **I created a monitor in the wrong project** Monitors cannot be moved between projects. Delete the monitor and recreate it in the correct project. **My teammate cannot see a project** Teammates only have access to projects they were explicitly invited to. Switch to the correct project and invite them from the [Teammates page](https://app.hyperping.io/teammates). **I want to rename or delete a project** Go to [project settings](https://app.hyperping.io/project) to rename a project. Only the account Owner can delete a project, and doing so removes all monitors and data within it. ## Next steps [ Roles and permissions→ What each role can do, and how projects isolate access. ](https://hyperping.com/docs/projects/roles-permissions)[ Invite teammates→ Add people to a project and assign them a role. ](https://hyperping.com/docs/projects/teammates)[ Notification channels→ Choose where each project delivers its alerts. ](https://hyperping.com/docs/projects/notification-channels)[ Audit logs→ Track every configuration change made in the project. ](https://hyperping.com/docs/projects/audit-logs) [Roles and permissions →](https://hyperping.com/docs/projects/roles-permissions) [](https://x.com/hyperping)[](https://www.linkedin.com/company/hyperping) © 2026 Hyperping --- Source: https://hyperping.com/docs/projects/roles-permissions # Roles & permissions Control who can do what across your Hyperping account and projects. Four roles give you fine-grained control, with every resource scoped inside a project, and team members only seeing the projects they belong to. > **Useful when** > > - You're onboarding new team members and need to explain what they can and can't do. > - You need to decide how to structure projects for different teams or clients. > - You're preparing for a security or compliance review. ![The Members page with the role dropdown showing Owner, Admin, and Billing descriptions](https://hyperping.com/static/permissions-4595f9ab16fa5be7a04af0e1439bc0da.webp) Assign roles from the Members page; each member's role applies per project ## At a glance Model Role-based access control Roles Owner, Admin, Member, Billing Scope One role per project Default Member ## The four roles One Owner per account. All other team members are assigned one of three roles: Admin, Member, or Billing. Owner Unrestricted The Owner has full access to the entire account. Exactly one Owner per account. Usually assigned to the founder or account holder. Transferring ownership changes the previous Owner to Member. Admin Manages people + config Same capabilities as the Owner except billing and ownership transfer. Usually assigned to a team lead or manager who maintains the monitoring configuration. Member Default role Can manage monitors and respond to incidents within their assigned project. Usually assigned to an engineer who configures monitors and responds to incidents. Billing Read + billing Read-only access to project data plus the ability to manage subscription and payment details. Usually assigned to a finance or operations contact who handles invoices and plan changes. ## Permission matrix Quick reference for every capability. A check means allowed, and a minus sign means blocked. | Action | Owner | Admin | Member | Billing | | --- | --- | --- | --- | --- | | Read access | | View monitors, reports, and outages | | | | | | View on-call schedules | | | | | | View teammates list | | | | | | Monitoring and incidents | | Create, edit, and delete monitors | | | | \- | | Bulk-edit monitors | | | | \- | | Create and update on-call schedules | | | | \- | | Delete on-call schedules | | | \- | \- | | Create outages | | | | \- | | Acknowledge and resolve outages | | | | \- | | Escalate outages | | | | \- | | Update outage severity and details | | | | \- | | Write postmortems and AI summaries | | | | \- | | Delete outages | | | | \- | | Account administration | | Invite and remove teammates | | | \- | \- | | Transfer account ownership | | \- | \- | \- | | Manage billing and subscription | | \- | \- | | | Configure SSO and authentication | | | \- | \- | ## Project isolation Projects act as boundaries. A teammate invited to Project A cannot see monitors, status pages, or integrations in Project B. Only the Owner sees every project. acme.com Project A Production monitors, public status page, and on-call rotation. Jane is Owner, Marcus is Admin, and Priya is Member. staging.acme.com Project B Staging monitors and internal incident workflows. Jane is Owner, Ren is Admin, and Sasha is Member. Priya has no access. Common ways to split work across projects: - Create one project per client when teams should not see each other's monitors. - Separate engineering, infrastructure, and support when each team owns different services. - Keep production and staging apart when access or alerting differs by environment. > **Using SSO?** > > You can restrict SSO users to specific projects through the **SSO access scope** setting. See [login methods](https://hyperping.com/docs/projects/login-methods) for the full flow. ## Pick a role Common mappings from job title to recommended role: | Team member | Responsibility | Role | | --- | --- | --- | | CTO or team lead | Manages the team and configuration | **Admin** | | Engineer | Sets up monitors and responds to incidents | **Member** | | Finance or operations | Handles invoices and plan changes | **Billing** | ## Account security Two-factor authentication Authentication Add a second verification step to login. Once enabled, you need your password plus a code from your authenticator app. Enable it in your [account settings](https://app.hyperping.io/settings/general). It is available on every plan. Audit logs Traceability Hyperping records who changed a setting, when it changed, and which project it affected. Use the log to review configuration changes after an incident or during a compliance audit. Data protection Storage Data is encrypted at rest with LUKS and in transit with SSL/HTTPS. Hyperping stores data in DigitalOcean's Frankfurt region and provides self-service data deletion. ## Troubleshooting **A teammate says they can't see a project** Team members only see projects they were invited to. Check the [Teammates page](https://app.hyperping.io/teammates) while inside the correct project to verify they were invited there. **A teammate needs to manage billing** Assign them the Billing role, or let the Owner handle it directly. Change roles on the [Teammates page](https://app.hyperping.io/teammates). **An SSO user can't log in** Check the provisioning policy in your SSO settings. If it's set to "Invite-only," the user needs to be invited before SSO login will work. See [login methods](https://hyperping.com/docs/projects/login-methods) for details. ## Next steps [ Invite teammates→ Add people to your project and assign them a role. ](https://hyperping.com/docs/projects/teammates)[ Login methods→ SSO (SAML or OpenID Connect), Google, email. Scope SSO users to specific projects. ](https://hyperping.com/docs/projects/login-methods)[ Project setup→ How to organize your workspace into projects before inviting the team. ](https://hyperping.com/docs/projects/project-setup)[ Notification channels→ Configure how roles get notified during incidents. ](https://hyperping.com/docs/projects/notification-channels) [← Project setup](https://hyperping.com/docs/projects/project-setup)[Invite teammates →](https://hyperping.com/docs/projects/teammates) [](https://x.com/hyperping)[](https://www.linkedin.com/company/hyperping) © 2026 Hyperping --- Source: https://hyperping.com/docs/projects/saml-sso # Set up SAML SSO Let your team sign in to Hyperping through your identity provider. Hyperping has guided setup wizards for Okta, Microsoft Entra ID (Azure AD), Google Workspace, and JumpCloud, and any other SAML 2.0 compliant provider works through the generic configuration. If your identity team prefers OpenID Connect, see [Set up OpenID Connect SSO](https://hyperping.com/docs/projects/oidc-sso). ## What SAML SSO covers SAML SSO controls how your teammates log in to the Hyperping dashboard. Native connections are included from **Pro** at no extra charge. These support Microsoft Entra ID, Okta, Google Workspace, KeyHub and JumpCloud. Other providers through WorkOS require Business. Users sign in through your IdP, and Hyperping trusts the assertion, which gives you centralized offboarding and aligns with SOC 2 and ISO 27001 access-control requirements. SAML sits alongside the other login methods. **Sign in with Google** is available on all plans and combines with SAML when your policy is set to allow both. **Email and password** stays available for the Owner as a lockout fallback, so you can never lock yourself out of the account. See [Login methods](https://hyperping.com/docs/projects/login-methods) for a full comparison of the three. ![SSO provider cards: Microsoft Entra ID, Google Workspace, Okta, KeyHub, JumpCloud, OpenID Connect, and Other Providers](https://hyperping.com/static/sso-providers-17b188afa457e75d3b8090dd2aac7610.webp) The identity provider cards under Members → Authentication > **Your identity team won't set up SAML?** > > Auth0, Okta, Entra ID and Keycloak can also connect over OpenID Connect, from the **OpenID Connect** card on the same tab. It is included from Pro too. See [Set up OpenID Connect SSO](https://hyperping.com/docs/projects/oidc-sso). > **Protecting a status page instead?** > > This guide covers dashboard login for your team. To put a status page behind SAML for your end users, see [Private status pages](https://hyperping.com/docs/status-page/private-status-pages). The two are configured separately. ## Prerequisites > **Before you start** > > - A Hyperping **Pro or Business** plan for native providers, or Business for other providers through WorkOS. See [pricing](https://hyperping.com/pricing) for plan details. > - Admin access to your identity provider so you can create a SAML application. > - The **Owner** or **Admin** role in Hyperping. Only these two roles can configure SSO and authentication settings. See [Roles and permissions](https://hyperping.com/docs/projects/roles-permissions). ## Step 1: Get the ACS URL and entity ID from Hyperping 1. Open the Authentication tab Go to the [Members section](https://app.hyperping.io/teammates?view=authentication) and open the **Authentication** tab. 2. Start the setup wizard Click **Configure** on your identity provider's card. Providers with a guided wizard: Microsoft Entra ID (Azure AD), Google Workspace, Okta, and JumpCloud. KeyHub also has a native setup wizard. Other providers require Business and appear under **Other Providers**. 3. Copy the two values The setup wizard shows Hyperping's **ACS URL** (`https://api.hyperping.io/saml/acs`) and **entity ID** (`https://api.hyperping.io/saml/sp`). Keep this tab open, your IdP needs both values in the next step. ## Step 2: Create the SAML application in your IdP Each provider has a dedicated guide that mirrors the setup wizard, with the exact screens, field names, and attribute mappings: [ Okta→ App integration, audience URI, and legacy attribute mapping. ](https://hyperping.com/docs/sso/okta)[ Microsoft Entra ID→ Enterprise application, claims, and federation metadata URL. ](https://hyperping.com/docs/sso/entra-id)[ Google Workspace→ Custom SAML app and the metadata XML upload. ](https://hyperping.com/docs/sso/google-workspace)[ JumpCloud→ Custom application, assertion signing, and metadata URL. ](https://hyperping.com/docs/sso/jumpcloud) In short, every provider asks for the same two values, but labels them differently: | Provider | Create the app under | ACS URL field | Entity ID field | | --- | --- | --- | --- | | Okta | Applications → Create App Integration → SAML 2.0 | Single sign-on URL | Audience URI (SP Entity ID) | | Microsoft Entra ID | Enterprise applications → New application → Create your own application | Reply URL (Assertion Consumer Service URL) | Identifier (Entity ID) | | Google Workspace | Apps → Web and mobile apps → Add custom SAML app | ACS URL | Entity ID | In your IdP, configure the application to send each user's work email address as the name identifier, then assign the users or groups who should have access. The setup wizard in Hyperping indicates any additional field it needs. Once the application is created, copy its **metadata URL** or download the **metadata XML**. If your provider is not in the table above, any SAML 2.0 compliant provider works with the generic SAML configuration in the wizard. ## Step 3: Paste the IdP metadata into Hyperping Back in the Hyperping setup wizard, paste the metadata URL or XML from your IdP. The wizard walks through each field. ## Step 4: Test the connection Run the built-in test login before enforcing anything. > **Test login succeeded?** > > SAML is live and teammates can pick it on the login screen. ## Choose an enforcement mode After testing, decide whether SSO is optional or mandatory for non-Owner users: | Mode | Behavior | Use when | | --- | --- | --- | | **Allow SSO and email/password** | Users pick either method at the login screen. Sign in with Google also stays available. | During rollout, or when you need a break-glass path outside the IdP. | | **Require SSO** | Non-Owner users must sign in through your IdP. The Owner keeps email and password as a lockout fallback. | Once rollout is done. Aligns with SOC 2 and ISO 27001 controls. | ## Provision teammates and roles The provisioning policy decides what happens when someone signs in through your IdP without an existing Hyperping account: | Policy | Behavior | | --- | --- | | **Invite-only** | SSO login fails unless an admin already invited the user. Most secure. | | **Request access** | New users land on a pending screen. Admins get notified and approve or deny from the Teammates page. | | **Auto-provision** | Anyone with a matching email domain joins automatically. Best when your IdP is the source of truth for employment. | Provisioned users get a role like any other teammate. New invites default to **Member**, and you can change roles from the [Teammates section](https://app.hyperping.io/teammates). See [Invite teammates](https://hyperping.com/docs/projects/teammates) for the invite flow and [Roles and permissions](https://hyperping.com/docs/projects/roles-permissions) for what each role can do. > **Need to restrict SSO users to certain projects?** > > The **SSO access scope** setting restricts SSO users to a selected set of projects, which is useful for contractors or per-client segregation. See [Login methods](https://hyperping.com/docs/projects/login-methods) for the details. ## SSO for private status pages Protecting a status page with SSO is a separate feature aimed at your end users, not your teammates. You create reusable connections under **Status Pages → SSO Connections**, and each connection can protect multiple status pages. Connections are billed per month: $49 for Microsoft Entra ID, Okta, Google Workspace, or any OpenID Connect provider such as Auth0, and $99 for other SAML providers set up through the hosted portal. See [Status page SSO](https://hyperping.com/docs/status-page/sso) for the full setup, and [Private status pages](https://hyperping.com/docs/status-page/private-status-pages) for the simpler access controls, password protection and email access codes. ## Troubleshooting **The test login fails with "user not found"** Your provisioning policy is set to **Invite-only** and the user has no account yet. Invite them from the Teammates page first, or switch provisioning to **Request access** or **Auto-provision**. **I enabled "Require SSO" and locked myself out** Owner accounts are exempt by design and can always sign in with email and password. Log in as the Owner, go to **Teammates → Authentication**, and relax the policy. **My IdP is not listed in this guide** Any SAML 2.0 compliant provider works through the generic SAML configuration in the setup wizard, and any OpenID Connect provider through the [OpenID Connect card](https://hyperping.com/docs/projects/oidc-sso). If you hit a snag, [contact us](mailto:hello@hyperping.io) with your IdP's metadata. ## Next steps [ Login methods→ The full comparison of SSO, Google, and email login. ](https://hyperping.com/docs/projects/login-methods)[ OpenID Connect SSO→ Auth0, Okta, Entra ID or Keycloak without SAML. ](https://hyperping.com/docs/projects/oidc-sso)[ Roles and permissions→ What each role can see and do. ](https://hyperping.com/docs/projects/roles-permissions)[ Status page SSO→ SSO-protected status pages for your end users. ](https://hyperping.com/docs/status-page/sso) [← Login methods](https://hyperping.com/docs/projects/login-methods)[Okta →](https://hyperping.com/docs/sso/okta) [](https://x.com/hyperping)[](https://www.linkedin.com/company/hyperping) © 2026 Hyperping --- Source: https://hyperping.com/docs/projects/teammates # Invite teammates Invite members to share everything across a project. There can only be one **Owner** per account. When inviting a new member, you can assign them one of four roles: **Admin**, **Member**, **Viewer**, or **Billing**. New invites default to the **Member** role. > **What can each role do?** > > Each role has different permissions. See [roles and permissions](https://hyperping.com/docs/projects/roles-permissions) for the full breakdown and the permission matrix. ![Teammates interface](https://hyperping.com/static/teammates-a61dd4dbf12c8f30dd7441aa8eea2381.webp) The Teammates section of your project. ## Invite a new teammate 1. Switch to the right project Invitations are scoped to the project you are currently in, so make sure you are within the right one. 2. Open the Teammates section Head to the [Teammates section](https://app.hyperping.io/teammates) of your app, and click on **Invite New Teammate**. 3. Enter their email address A modal will show up asking you to enter an email address. 4. They accept the invite The invitee clicks the link in the email and creates their account from there, either with a password or your company's Google SSO. > **Rolling out SSO?** > > Teammates can also sign in through your identity provider. Compare the options in [login methods](https://hyperping.com/docs/projects/login-methods), then connect your IdP with [SAML SSO](https://hyperping.com/docs/projects/saml-sso) or [OpenID Connect](https://hyperping.com/docs/projects/oidc-sso). ## Transfer ownership Only the **Owner** can transfer account ownership to another teammate. To do so, head to the [Teammates section](https://app.hyperping.io/teammates), then at the far-right of a teammate's row, click the dropdown menu, then click on **Set owner**. ## Remove a teammate **Owners** and **Admins** can remove a teammate. To do so, head to the [Teammates section](https://app.hyperping.io/teammates), then at the far-right of a teammate's row, click the dropdown menu, then click on **Remove from project**. ## Next steps [ Roles and permissions→ The permission matrix for Owner, Admin, Member, and Billing. ](https://hyperping.com/docs/projects/roles-permissions)[ Notification channels→ Choose where your team receives outage alerts. ](https://hyperping.com/docs/projects/notification-channels)[ Login methods→ SSO (SAML or OpenID Connect), Google, or email and password for your team. ](https://hyperping.com/docs/projects/login-methods)[ Audit logs→ Review teammate invitations, removals, and role updates. ](https://hyperping.com/docs/projects/audit-logs) [← Roles and permissions](https://hyperping.com/docs/projects/roles-permissions) [Notification channels →](https://hyperping.com/docs/projects/notification-channels) [](https://x.com/hyperping)[](https://www.linkedin.com/company/hyperping) © 2026 Hyperping --- Source: https://hyperping.com/docs/integrations # Integrations Route Hyperping alerts into the tools your team already uses, keep customers informed from your support stack, and manage everything as code through the API, Terraform, or MCP. ## Notifications & ChatOps Get UP and DOWN alerts where your team talks. [ Slack→ Alerts and incident updates in your Slack channels. ](https://hyperping.com/docs/integrations/slack)[ Microsoft Teams→ Post alerts to Teams channels. ](https://hyperping.com/docs/integrations/teams)[ Discord→ Send alerts to a Discord channel via webhook. ](https://hyperping.com/docs/integrations/discord)[ Google Chat→ Alerts in Google Chat spaces. ](https://hyperping.com/docs/integrations/googlechat)[ Telegram→ Alerts delivered by a Telegram bot. ](https://hyperping.com/docs/integrations/telegram) ## On-call & escalation Page the right person when a monitor goes down. [ PagerDuty→ Trigger and resolve PagerDuty incidents automatically. ](https://hyperping.com/docs/integrations/pagerduty)[ Opsgenie→ Create Opsgenie alerts from Hyperping outages. ](https://hyperping.com/docs/integrations/opsgenie)[ Phone call→ Get called when something goes down. ](https://hyperping.com/docs/integrations/phonecall)[ Twilio (SMS)→ SMS alerts through your own Twilio account. ](https://hyperping.com/docs/integrations/twilio) ## Ticketing & support Keep support tooling and customer communication in sync. [ Jira Service Management→ Open JSM incidents from Hyperping alerts. ](https://hyperping.com/docs/integrations/jsm)[ Intercom→ Show your service status inside Intercom Messenger. ](https://hyperping.com/docs/integrations/intercom)[ HelpDocs→ Display incidents in your HelpDocs knowledge base. ](https://hyperping.com/docs/integrations/helpdocs)[ Status banner→ Show ongoing incidents and maintenance on your site or help center. ](https://hyperping.com/docs/integrations/status-banner) ## Developer & automation Build on Hyperping and manage your monitoring as code. [ Webhooks→ Receive check.up and check.down events on any endpoint. ](https://hyperping.com/docs/integrations/webhooks)[ API reference→ REST API for monitors, incidents, maintenance windows, and reports. ](https://hyperping.com/docs/api/overview)[ Terraform Provider→ Monitors, status pages, and maintenance windows as infrastructure-as-code. ](https://hyperping.com/docs/community/terraform)[ MCP for AI agents→ Connect Claude, Cursor, or any MCP client to your Hyperping project. ](https://hyperping.com/docs/mcp) > **More community tools** > > A [Python SDK](https://hyperping.com/docs/community/python-sdk), a [Prometheus exporter](https://hyperping.com/docs/community/prometheus-exporter) for Grafana dashboards, and a [Go client](https://hyperping.com/docs/community/go-client) are maintained by the community — see [all community tools](https://hyperping.com/docs/community). [](https://x.com/hyperping)[](https://www.linkedin.com/company/hyperping) © 2026 Hyperping --- Source: https://hyperping.com/docs/integrations/discord # Discord Get Hyperping alerts in your preferred Discord server's channel. Generate a webhook on Discord, paste it into Hyperping, and alerts start flowing. ![Discord integration documentation](https://hyperping.com/static/discord-integration-doc-59e43fe9cccab46240d1fc911a3d3045.webp) ## Configure Configuring the Discord webhook requires to generate and copy the url webhook from Discord, then paste it in your Hyperping project. ### On Discord 1. Create a new webhook If you have the rights over the server, head to **Server Settings** → **Integrations** → **Webhooks**: View Webhooks → Click on **New Webhook**. 2. Name it and pick a channel Expand it, you can then give it a name, and choose the channel of your server you want to receive the alerts to. ![Discord webhook view](https://hyperping.com/static/discord-webhook-view-1c50efe9511a2ae24c98f893f76bd225.webp) 3. Copy the webhook URL Finally, click on **Copy Webhook URL**. ### On Hyperping 1. Connect the Discord integration Head to your [Integrations](https://app.hyperping.io/integrations) page, then click on _Connect_ on the Discord card. 2. Paste the webhook URL Enter the field with the webhook URL you just copied, then hit save. > **Test your channels** > > We recommend testing your channels to make sure they are working. To do so, create a monitor that returns an error, such as a 404 page, which will trigger the alerts. ## Next steps [ Escalation policies→ Alert Discord first, then escalate to SMS or phone calls. ](https://hyperping.com/docs/monitoring/escalation-policies)[ Notification channels→ Every channel Hyperping can alert, in one place. ](https://hyperping.com/docs/projects/notification-channels)[ Webhooks integration→ Send raw UP and DOWN payloads to your own endpoint. ](https://hyperping.com/docs/integrations/webhooks) [← Browser Checks](https://hyperping.com/docs/monitoring/browser-checks)[Webhooks Integration →](https://hyperping.com/docs/integrations/webhooks) [](https://x.com/hyperping)[](https://www.linkedin.com/company/hyperping) © 2026 Hyperping --- Source: https://hyperping.com/docs/integrations/googlechat # Google Chat Receive up and down alerts via a Google Chat space. ## What you'll receive Hyperping posts a message in your Chat space when a monitor goes down, and another one when it recovers. Alerts include the monitor's name so your team knows at a glance what is affected. ## Configure ### On Google Chat To add a webhook to a Google Chat space, follow these steps: 1. Open the Chat space Open the Chat space where you want to add the webhook. 2. Open Manage webhooks Click the space name at the top and select **Manage webhooks**. 3. Add a webhook Click **Add webhook**. 4. Name it and save Enter a name for your webhook (e.g., "Hyperping Alerts"). Optionally, add an avatar image for your webhook. Click **Save**. 5. Copy the webhook URL Copy the webhook URL that appears. This URL will be used to send messages to your Chat space. ### On Hyperping 1. Configure the Google Chat integration Head to your [Integrations](https://app.hyperping.io/integrations) page, then click on **Configure** on the Google Chat card. 2. Paste the webhook URL Enter the webhook URL you just copied, then hit save. ![The new Google Chat integration form with name and webhook endpoint fields](https://hyperping.com/static/googlechat-integration-form-40c5df047abc1bb6f75dcbe6c781f959.webp) The Google Chat integration: a name and the space's webhook URL ## Test the integration We recommend testing your webhooks to make sure they are working. To do so, create a monitor that returns an error, such as a 404 page, which will trigger the alerts. A message should appear in your Chat space within a few moments of the outage being confirmed. ## Troubleshooting **No message in the space** Verify the webhook URL was copied in full, and that the webhook still exists in the space's **Manage webhooks** panel. **Webhook deleted or regenerated** Google Chat webhook URLs are unique. If the webhook was removed or recreated, update the URL in Hyperping's Integrations page. **Wrong space** Each webhook belongs to a single Chat space. To alert several spaces, create a webhook in each one. ## Next steps [ Escalation policies→ Alert Google Chat first, then escalate to SMS or phone calls. ](https://hyperping.com/docs/monitoring/escalation-policies)[ Notification channels→ Every channel Hyperping can alert, in one place. ](https://hyperping.com/docs/projects/notification-channels)[ Teams integration→ Send the same up and down alerts to Microsoft Teams. ](https://hyperping.com/docs/integrations/teams) [← Teams Integration](https://hyperping.com/docs/integrations/teams)[Intercom Integration →](https://hyperping.com/docs/integrations/intercom) [](https://x.com/hyperping)[](https://www.linkedin.com/company/hyperping) © 2026 Hyperping --- Source: https://hyperping.com/docs/integrations/helpdocs # HelpDocs Show your latest system status to users right inside your HelpDocs knowledge base. A simple status badge in the navigation reflects your current service health. ## What it does The HelpDocs integration displays a status badge in your knowledge base navigation that shows: - **Current system status:** All systems operational, partial outage, major outage, or ongoing maintenance - **Real-time updates:** Badge updates automatically when your status page changes - **Direct link:** Users can click the badge to view your full status page - **Seamless integration:** Appears natively in your HelpDocs navigation bar ## Setup and Configuration The HelpDocs integration is primarily configured on the HelpDocs side. For detailed setup instructions, please refer to the official HelpDocs documentation: > **Complete Setup Guide** > > Visit the [HelpDocs documentation](https://support.helpdocs.io/article/hlfs870030-connecting-hyperping) for step-by-step instructions on connecting Hyperping to your HelpDocs account. ### On Hyperping On the Hyperping side, you just need to ensure you have a status page set up: 1. Open Status Pages Go to [Status Pages](https://app.hyperping.io/v2/statuspage) in your Hyperping dashboard. 2. Create a status page Create a status page if you haven't already. 3. Copy the status page URL Copy the status page URL (e.g., `status.yourcompany.com`). 4. Use it in HelpDocs Use this URL in the HelpDocs configuration. ## Use Cases - **Support transparency:** Let users see system status while browsing your help docs - **Reduce support tickets:** Users can quickly check if issues are on your end - **Build trust:** Show transparency about service health directly in your help center - **Unified experience:** Keep users informed without leaving your documentation ## Testing your setup > **Verify the badge** > > After setting up the integration, visit your HelpDocs knowledge base to confirm the status badge appears in the navigation. You can verify it's working by checking that the badge reflects your current status page state. ## Next steps [ Create a status page→ The page your HelpDocs badge pulls its status from. ](https://hyperping.com/docs/status-page/create-status-page)[ Custom domain→ Serve your status page from status.yourcompany.com. ](https://hyperping.com/docs/status-page/custom-domain)[ Intercom integration→ Show live status inside your support messenger too. ](https://hyperping.com/docs/integrations/intercom) [← Webhooks Integration](https://hyperping.com/docs/integrations/webhooks)[Intercom Integration →](https://hyperping.com/docs/integrations/intercom) [](https://x.com/hyperping)[](https://www.linkedin.com/company/hyperping) © 2026 Hyperping --- Source: https://hyperping.com/docs/integrations/intercom # Intercom Integration Show service status, incident updates, and maintenance notifications directly in your Intercom messenger. Customers get answers before they ask, and your support team keeps full context during incidents. ## What this integration does The Hyperping Intercom integration brings real-time system status directly into your support workflow, eliminating the guesswork for both customers and support teams. Instead of playing "status detective" during incidents, your team gets instant context while customers see current service information without needing to ask. ![Intercom showing all systems operational](https://hyperping.com/intercom-all-systems-operational.png) All systems operational, shown in the Intercom messenger. ## Key benefits ### Dramatically Reduce Support Tickets Early customers report 40-60% reduction in status-related support tickets during incidents. When customers can see service status directly in the messenger, they don't need to contact support to ask "Is the service down?" ### Real-time Proactive Communication Status updates appear instantly in Intercom as soon as they're published on your Hyperping status page. Whether our monitoring detects downtime automatically or you schedule maintenance, customers and support agents see updates immediately, no manual intervention required. ### Branded Customer Experience Your status page data appears with your custom branding and messaging, maintaining a consistent experience that matches your existing status page design. ![Intercom maintenance notification](https://hyperping.com/intercom-maintenance.png) A scheduled maintenance notification in Intercom. ## Core features - **Real-time Synchronization:** Live status updates appear instantly in Intercom conversations - **Branded Experience:** Displays your custom status page with your branding - **Smart Subscriptions:** Customers subscribe to alerts for specific services directly in the messenger - **Secure OAuth Connection:** Enterprise-grade security with one-click setup - **Targeted Communication:** Updates reach customers affected by specific services - **Automated Notifications:** Incident updates flow automatically into relevant conversations ## How to set up the integration 1. Install from the Intercom App Store Find Hyperping in the [Intercom App Store](https://www.intercom.com/app-store/?app_package_code=hp-08-prod&search=incident) and install it to your workspace. 2. Connect your Hyperping account After installation, you'll be automatically redirected to authorize the secure OAuth connection between Intercom and your Hyperping account. This uses enterprise-grade authentication to ensure your data remains secure. You can also connect directly by visiting your [Intercom integration page](https://app.hyperping.io/integrations/intercom) and clicking "Connect via OAuth". 3. Select your status page data source Choose which Hyperping status page will serve as your data source. This determines which monitors and services will be displayed to customers and support staff in Intercom. ![Selecting status page data source](https://hyperping.com/intercom-chose-data-source.png) 4. Add to Messenger In Intercom, go to **Settings** → **Channels** → **Messenger** → **Web**, click **"Customize Home with apps"** and add Hyperping to make it visible to customers and support agents. ## How to use the integration ### For Support Teams When chatting with customers, your support team can instantly see current service status and share it with customers. No more switching between tools or manually checking system status during conversations. ### For Customers Customers see real-time service status directly in the messenger widget. They can subscribe to status updates for specific services they care about without creating additional accounts or leaving the conversation. ### During Incidents When Hyperping's built-in monitoring detects downtime or you create incidents manually, status updates automatically appear in relevant conversations. Subscribed customers receive targeted notifications throughout the incident lifecycle. ## What information is displayed The integration shows your complete status page information including: - Current service status (operational, degraded, outage) - Ongoing incidents with detailed updates - Scheduled maintenance windows - Historical uptime data - Service groupings and categories ## Testing your setup > **Test before an incident does** > > Test your integration to ensure it's working correctly. Create a test monitor or trigger a test incident to verify that status updates appear in your Intercom messenger as expected. This helps ensure your team is prepared when real incidents occur. ## Troubleshooting **Not seeing status updates in Intercom?** 1. Verify that the Hyperping app is properly added to your Intercom messenger home 2. Check that you've selected the correct status page as your data source 3. Ensure your OAuth connection is still active and authorized 4. Test the integration with a sample incident or maintenance notification 5. Confirm that your status page has public visibility enabled ## Privacy and security The Hyperping Intercom integration uses enterprise-grade OAuth authentication for secure connection. We only access data necessary to display service status and send notifications. We do not store or access your customer conversations, personal data, or other sensitive Intercom information. The integration follows strict privacy principles and only shares publicly available status page information that you've already made visible to customers. For complete details about data handling, please review our [Privacy Policy](https://hyperping.com/privacy). ## Next steps [ Create a status page→ The data source your Intercom messenger will display. ](https://hyperping.com/docs/status-page/create-status-page)[ Status page subscribers→ Let customers subscribe to incident and maintenance updates. ](https://hyperping.com/docs/status-page/subscribers)[ Slack integration→ Alert your own team the moment a monitor goes down. ](https://hyperping.com/docs/integrations/slack) [← Discord Integration](https://hyperping.com/docs/integrations/discord)[Webhooks Integration →](https://hyperping.com/docs/integrations/webhooks) [](https://x.com/hyperping)[](https://www.linkedin.com/company/hyperping) © 2026 Hyperping --- Source: https://hyperping.com/docs/integrations/jsm # Jira Service Management Open and close Jira Service Management alerts when Hyperping detects outages. Optionally route every alert to a specific JSM team so it lands with the right responders. Hyperping creates a JSM alert when a monitor goes down and closes the same alert when it recovers. ## Configure ### On Atlassian 1. Create an API token Create an API token at [Atlassian Account Settings](https://id.atlassian.com/manage-profile/security/api-tokens). Copy it, you will paste it into Hyperping in the next step. 2. Find your Cloud ID Find your **Cloud ID** by opening your-site-name.atlassian.net/\_edge/tenant\_info in your browser, or follow [Atlassian's guide](https://support.atlassian.com/jira/kb/retrieve-my-atlassian-sites-cloud-id/). It looks like 18739352-b0c2-455a-bf44-b320ece12b08. 3. Find the Team ID (optional) Find the **Team ID** of the responder team you want alerts routed to. In JSM, go to **Teams** → select the team → **Settings**. The ID starts with og- followed by a UUID. ### On Hyperping Head to your [Integrations](https://app.hyperping.io/integrations) page, then click **Connect** on the Jira Service Management card. 1. **Cloud ID**: the value you copied above. 2. **Email**: the Atlassian account that created the API token. Authentication uses email + token. 3. **Atlassian site (optional)**: the subdomain from your URL (e.g. hyperping from hyperping.atlassian.net). Used to log full alert URLs for debugging. 4. **API Token**: the token from Atlassian Account Settings. 5. **Responder team IDs (optional)**: one or more JSM team IDs, comma-separated. When set, every alert is created with these teams already assigned as responders, so JSM routes it without manual triage. Click **Test connection** to confirm your Cloud ID, email, and API token are valid before saving. ## Alert content Each alert includes the monitor name, the received and expected status codes, the time and detected location, request timings (DNS, connection, TLS, first byte, download), and a link back to the Hyperping report. ## Routing alerts to a team JSM alerts without responders stay unowned and need manual assignment. The **Responder team IDs** field on the integration tells JSM which teams own the alert at creation time, which lets your on-call schedules and escalation rules fire immediately. To route alerts to several teams at once, paste multiple IDs separated by commas: og-xxxxxxxx-xxxx-xxxx-xxxx-xxxxxxxxxxxx, og-yyyyyyyy-yyyy-yyyy-yyyy-yyyyyyyyyyyy To stop routing, clear the field and save. New alerts will be created without responders. ## Test the integration > **Trigger a test alert** > > Create a monitor that returns an error, such as a URL that responds with 404. The next failed check fires the alert and you should see it appear in JSM, already assigned to the responder team if you set one. ## Troubleshooting **Alerts are created but no team is assigned** Check that the team ID starts with og- and matches what you see in **Teams** → **Settings** in JSM. A typo or trailing space silently drops the field on the JSM side. **Authentication failed** The email must be the Atlassian account that owns the API token, not a project member. Regenerate the token if you are unsure. **Cloud ID not found** Open your-site-name.atlassian.net/\_edge/tenant\_info in the browser where you are logged in to Atlassian and copy the cloudId value verbatim. ## Next steps [ Escalation policies→ Create JSM alerts only when an outage outlasts earlier steps. ](https://hyperping.com/docs/monitoring/escalation-policies)[ OpsGenie integration→ The same open and close flow for OpsGenie alerts. ](https://hyperping.com/docs/integrations/opsgenie)[ Notification channels→ Every channel Hyperping can alert, in one place. ](https://hyperping.com/docs/projects/notification-channels) [← OpsGenie Integration](https://hyperping.com/docs/integrations/opsgenie)[Teams Integration →](https://hyperping.com/docs/integrations/teams) [](https://x.com/hyperping)[](https://www.linkedin.com/company/hyperping) © 2026 Hyperping --- Source: https://hyperping.com/docs/integrations/opsgenie # OpsGenie Once an outage is starting on Hyperping, an alert is automatically created in Opsgenie. Hyperping will close the Opsgenie alert once the outage is over. ## How it works - **Outage detected:** when a monitor goes down and the outage is confirmed across your selected regions, Hyperping creates an alert in OpsGenie with the monitor's details. - **Recovery:** when the monitor comes back up, Hyperping automatically closes the corresponding OpsGenie alert, so your OpsGenie alert list reflects reality without manual cleanup. - **Routing and escalation:** once the alert reaches OpsGenie, your OpsGenie team routing, schedules, and escalation rules take over. ## Configure ### On OpsGenie 1. Open your team's integrations Go to **Teams** → **Select a team** and click on the **Integrations** tab. 2. Add an API integration Click on **Add integration**, then select **API**. 3. Copy the API Key After you created the service, copy the **API Key**. ![](https://hyperping.com/static/opsgenie-integration-7c42b0b0f97a108ad72f29553c86c1cd.webp) ### On Hyperping 1. Connect the OpsGenie integration Head to your [Integrations](https://app.hyperping.io/integrations) page, then click on **Connect** on the OpsGenie card. 2. Paste the API key Enter the field with the API key you just copied, then hit save. ## Use OpsGenie in escalation policies OpsGenie can be used as a notification channel inside an [escalation policy](https://hyperping.com/docs/monitoring/escalation-policies). For example, notify Slack instantly, then create an OpsGenie alert if the outage is still going after a few minutes. ## Test the integration We recommend testing your channels to make sure they are working. To do so, create a monitor that returns an error, such as a 404 page, which will trigger the alerts. You should see the alert appear in OpsGenie, then close automatically when you fix or delete the monitor. ## Troubleshooting **No alert created** Verify the API key was copied from an **API** integration on the right OpsGenie team, and that the integration is enabled in OpsGenie. **Alert not closing** Alerts are closed by Hyperping when the outage resolves. If you closed the alert manually first, nothing else happens. **Wrong team notified** The alert is routed by the team that owns the API integration in OpsGenie. Create the API integration under the correct team. ## Plan availability The OpsGenie integration is available on all paid plans. ## Next steps [ Escalation policies→ Create OpsGenie alerts only when an outage outlasts earlier steps. ](https://hyperping.com/docs/monitoring/escalation-policies)[ Jira Service Management→ The same open and close flow on Atlassian's JSM. ](https://hyperping.com/docs/integrations/jsm)[ Notification channels→ Every channel Hyperping can alert, in one place. ](https://hyperping.com/docs/projects/notification-channels) [← PagerDuty Integration](https://hyperping.com/docs/integrations/pagerduty)[Jira Service Management →](https://hyperping.com/docs/integrations/jsm) [](https://x.com/hyperping)[](https://www.linkedin.com/company/hyperping) © 2026 Hyperping --- Source: https://hyperping.com/docs/integrations/pagerduty # PagerDuty Open and close PagerDuty incidents when Hyperping detects outages. Connect the two with a single integration key. ## Configure ### On PagerDuty 1. Create a new service Go to **Services** → **Service Directory** and click **New Service**. On the next screen you will be guided through several steps. 2. Enable Events API v2 Under Integration Settings, check **Events API v2**. 3. Copy the Integration Key After you created the service, copy the **Integration Key**. ![PagerDuty integration setup](https://hyperping.com/static/pagerduty-integration-8e97a66703710b5c9c4015d5d2e279cf.webp) ### On Hyperping 1. Connect the PagerDuty integration Head to your [Integrations](https://app.hyperping.io/integrations) page, then click on _Connect_ on the PagerDuty card. 2. Paste the integration key Enter the field with the integration key you just copied, then hit save. > **Test your channels** > > We recommend testing your channels to make sure they are working. To do so, create a monitor that returns an error, such as a 404 page, which will trigger the alerts. ## Next steps [ Escalation policies→ Page PagerDuty only when an outage outlasts earlier steps. ](https://hyperping.com/docs/monitoring/escalation-policies)[ OpsGenie integration→ The same open and close flow for OpsGenie alerts. ](https://hyperping.com/docs/integrations/opsgenie)[ Jira Service Management→ Route alerts to JSM responder teams automatically. ](https://hyperping.com/docs/integrations/jsm) [← Hyperping Webhooks](https://hyperping.com/docs/integrations/webhooks)[OpsGenie Integration →](https://hyperping.com/docs/integrations/opsgenie) [](https://x.com/hyperping)[](https://www.linkedin.com/company/hyperping) © 2026 Hyperping --- Source: https://hyperping.com/docs/integrations/phonecall # Phone call Receive hyperping.io alerts via a phone call during an outage. Can only be enabled using an [escalation policy](https://hyperping.com/docs/monitoring/escalation-policies). ## Configure Go to your [Account settings](https://app.hyperping.io/settings/general) → Add a phone number. Phone calls can only be enabled through an [escalation policy](https://hyperping.com/docs/monitoring/escalation-policies). If you have an European phone number, you will be called from **+31 970 10 25 72 04**. For US and non-EU countries, you will receive a call from **(424) 325-7650** (+14243257650). ## How it works We do not send phone call alerts more than once every 5 minutes. If a single monitor experiences multiple outages (going down and then back up repeatedly), or if multiple monitors trigger alerts within a 5-minute period, you will only receive one phone call. ## When to use phone calls Phone calls are the most intrusive channel, which makes them ideal as a late escalation step for critical services. A common pattern: 1. Instantly Slack or email alert. 2. After 5 minutes SMS to the on-call engineer. 3. After 10 minutes Phone call. Configure this order in your [escalation policy](https://hyperping.com/docs/monitoring/escalation-policies) steps. ## Test the integration We recommend testing your channels to make sure they are working. To do so, create a monitor that returns an error, such as a 404 page, and assign it an escalation policy that includes a phone call step. ## Troubleshooting **No call received** Verify your phone number in Account settings includes the country code, and that the monitor is assigned an escalation policy with a phone call step. **Call from an unknown number** Save Hyperping's calling numbers listed above in your contacts so on-call engineers recognize them and their phone does not silence the call. **Only one call for several outages** That is the 5-minute throttle described above, working as intended. ## Plan availability Phone call alerts are available on all paid plans. ## Next steps [ Escalation policies→ Put phone calls behind Slack and SMS steps. ](https://hyperping.com/docs/monitoring/escalation-policies)[ On-call schedules→ Call whoever is on duty when the incident starts. ](https://hyperping.com/docs/monitoring/on-call)[ Notification channels→ Every channel Hyperping can alert, in one place. ](https://hyperping.com/docs/projects/notification-channels) [← Browser Checks](https://hyperping.com/docs/monitoring/browser-checks)[Webhooks Integration →](https://hyperping.com/docs/integrations/webhooks) [](https://x.com/hyperping)[](https://www.linkedin.com/company/hyperping) © 2026 Hyperping --- Source: https://hyperping.com/docs/integrations/slack # Hyperping Alerts for Slack Get Hyperping alerts where your team already works. Hyperping sends messages to your Slack channels when monitors go down, recover, or an incident escalates. ![Slack integration documentation](https://hyperping.com/static/slack-integration-doc-5afb7314c28c1a967b57c0398cde4295.webp) ## What triggers messages in Slack? Hyperping will send messages to your Slack channels for the following events: - **Monitor downtime:** When any of your HTTP, ping, or port monitors fail - **Service recovery:** When a failed monitor comes back online - **SSL certificates and domains:** Certificate errors, expiry reminders before SSL certificates expire (at the threshold you choose, then 30, 15, 7, 3 and 1 days before), and reminders before the domain registration expires - **Browser check failures:** When browser automation scripts fail - **Cron job missed:** When expected cron jobs don't run on schedule - **Escalation alerts:** At each step of your escalation policy, after its delay ## How to set up Hyperping for Slack 1. Install the Slack app Install Hyperping in your Slack workspace. You can do this from your Hyperping dashboard. 2. Configure notification channels Go to your [Integrations](https://app.hyperping.io/integrations) → [Add a new Slack channel.](https://app.hyperping.io/integrations/slack) Once you've created it with a name, you can click on "Connect Slack". You will be redirected to select your Slack channel. You can have as many Slack channels as you want for different types of alerts or teams. 3. Set up escalation policies Escalation policies determine who gets notified and when. Configure [Escalation Policies](https://hyperping.com/docs/monitoring/escalation-policies) to include your Slack channels: 1. Create a new escalation policy or edit existing ones 2. Add escalation steps with different notification methods: - Slack channels for immediate team alerts - Email for individual team members - SMS for critical escalations - Phone calls for urgent situations 3. Set time delays between escalation steps (e.g., 5 minutes, 15 minutes) 4. Assign the escalation policy to your monitors 4. Configure monitor settings For each monitor you want to send Slack alerts: 1. Edit your monitor settings 2. In the "Escalation Policy" section, select your Slack-enabled policy 3. Choose alert frequency (immediate, every 5 minutes, etc.) 4. Save your changes ## Customizing Slack notifications You can customize how alerts appear in Slack: - **Channel routing:** Send different types of alerts to different channels - **Alert frequency:** Control how often repeat alerts are sent - **Message formatting:** Alerts include monitor name, failure reason, and response time - **Recovery notifications:** Get notified when services come back online ## Advanced features - **On-call scheduling:** Integrate with calendar apps for rotating on-call duties - **Incident acknowledgment:** Acknowledge incidents directly from Slack to take ownership and stop repeat alerts - **Status updates:** Get periodic status reports in your chosen channel - **Multi-workspace support:** Connect multiple Slack workspaces to one Hyperping account ## Testing your setup > **Test your channels** > > We recommend testing your channels to make sure they are working. To do so, create a monitor that returns an error, such as a 404 page, which will trigger the alerts. ## Troubleshooting **Not receiving Slack notifications?** 1. Check that the Hyperping app has permission to post in your channel 2. Verify your escalation policy includes a Slack notification step 3. Ensure your monitors are assigned to the correct escalation policy 4. Test your notification channel from the Hyperping dashboard ## Privacy and data handling Your privacy is important to us. The Hyperping Slack integration only accesses the channels you explicitly authorize and sends notifications about your monitoring events. We do not store or access your Slack messages or other workspace data. For complete details about how we collect, manage, and store data, please review our [Privacy Policy](https://hyperping.com/privacy). ## Getting started The Slack integration works with Hyperping's free plan, no paid subscription required. The free plan includes 20 monitors, and Slack notifications are not metered. ## Next steps [ Escalation policies→ Page Slack first, then SMS and phone calls if the outage lasts. ](https://hyperping.com/docs/monitoring/escalation-policies)[ Notification channels→ Every channel Hyperping can alert, in one place. ](https://hyperping.com/docs/projects/notification-channels)[ On-call schedules→ Route alerts to whoever is on duty when the incident starts. ](https://hyperping.com/docs/monitoring/on-call) [← Browser Checks](https://hyperping.com/docs/monitoring/browser-checks)[Webhooks Integration →](https://hyperping.com/docs/integrations/webhooks) [](https://x.com/hyperping)[](https://www.linkedin.com/company/hyperping) © 2026 Hyperping --- Source: https://hyperping.com/docs/integrations/status-banner # Status banner Show a banner on your website, app or help center while an incident or a maintenance is ongoing. You paste one script tag, and the banner appears and disappears on its own as your status page changes. ![Status banner showing an ongoing incident at the top of a help center](https://hyperping.com/status-banner-help-center.webp) The status banner at the top of a help center during an incident. ## Overview The status banner follows one of your Hyperping status pages. While that page has an ongoing incident, an outage or a maintenance, visitors of your site see a short bar with the title, the latest update and a link to the status page. The rest of the time, nothing is rendered. Customers learn about a problem on the page they are already using, and fewer of them open a ticket to ask whether something is down. - Warn visitors of your help center before they submit a request about an ongoing incident. - Tell logged-in users of your web app that a maintenance is in progress, or that one starts in the next 24 hours. - Show "All systems operational" in the footer of your marketing site or on your login page. The script works on any site where you can add a ` ``` Paste it in the ``, or just before ``, of every page where the banner should appear. If your site uses a shared layout or theme file, adding it there once covers every page. The `key` is the integration ID shown in the dashboard. It is not a secret: it only gives access to what your public status page already shows. 4. Check it is live Open a page of your site that has the snippet. Under **Check it is live**, the integration page lists each site hostname the banner was loaded from, with the time it was last loaded. Until the first visit, it shows **Waiting for the first visit**. The banner stays hidden while everything is operational, so seeing no banner at this point is expected. To see it, turn on "All systems operational" for a moment or wait for your next maintenance. ## Banner states The banner shows the most important thing happening on the status page it follows: | Label | Shown | Colour | | --- | --- | --- | | **Ongoing incident** | While an incident is open on the status page. | Red | | **Service disruption** | While monitors shown on the status page are down. | Red | | **Maintenance in progress** | During a maintenance window. | Blue | | **Scheduled maintenance** | During the 24 hours before a maintenance starts. | Blue | | **All systems operational** | Only with `data-show-ok="true"`, when none of the above applies. | Green | Each banner shows the label and the incident or maintenance title in bold, then the latest update as plain text, cut after 2 lines. The **View status** link opens your status page. On v2 status pages, it opens the page of the incident itself. Visitors can close the banner with the **×** button. ![Status banner states in light and dark themes: incident, outage, maintenance in progress, scheduled maintenance and all systems operational](https://hyperping.com/status-banner-states.webp) Every state in the light theme (left) and the dark theme (right), with the banner placed inside an element. ## Script options The dashboard adds these attributes to the ` ``` At the top of the page, the banner is a full-width tinted bar. Inside an element, it is a bordered box. Below 600px wide, the **View status** link and the close button move under the text. ## Refresh, dismiss and language - The banner checks for changes every minute, and skips the check while the browser tab is hidden. Hyperping caches the status for about 30 seconds, so a new incident or update reaches your site within a minute or two. - A visitor who closes the banner doesn't see it again for the rest of their browser session. It comes back if the state or the title changes, for example when a new incident starts or the incident is renamed. - Labels follow the `lang` attribute of your page's `` tag, then the visitor's browser language. English, French, German, Spanish and Dutch are available, and other languages fall back to English. Titles and messages appear as written on your status page. - The banner renders in a Shadow DOM. Your site's CSS can't change its look, and its styles can't leak into your site. ## Add the banner to a Zendesk Help Center In Zendesk, open **Knowledge admin** and go to **Customize design**. Click **Customize** on your live theme, then **Edit code**. Open `document_head.hbs`, paste the snippet and save. The Zendesk integration adds the same banner as part of its Help Center step, together with a status panel in the ticket sidebar. If you only need the banner, the Status banner integration is enough. ## Privacy and protected status pages - The banner shows the same information to anyone who visits your site: what your public status page already shows. - Private status pages, and status pages protected by a password or SSO, never show a banner, since the site that embeds it is public. - The script sets no cookies. Dismissals are kept in the visitor's browser for the current session only. ## Build your own banner To build your own UI, read the data the banner uses from its public endpoint. It returns JSON and allows requests from any origin (CORS). ```bash curl https://api.hyperping.io/v1/status-banner/int_XXXXXXXX ``` | Field | Description | | --- | --- | | `state` | `ok`, `incident`, `outage`, `maintenance` or `upcoming_maintenance`. | | `title` | Title of the incident or maintenance. | | `message` | Latest update, as plain text. | | `url` | Link used by **View status**. | | `statusPage` | Object with the `name` and `url` of the status page. | | `startsAt`, `endsAt` | Start and end of the incident or maintenance, when known. | | `updatedAt` | Time of the latest update. | The endpoint returns a `403` error for protected status pages. For the full list of incidents and scheduled maintenances, use the [status page public API](https://hyperping.com/docs/status-page/public-api). ## Troubleshooting **The banner doesn't appear** 1. The banner is hidden while everything is operational. Add `data-show-ok="true"` to the script tag to check that it loads, or test during a maintenance. 2. Check that the snippet is in the HTML of the page you are looking at. On a help center, make sure the theme you edited is the live one. 3. Check that the status page is not protected. Protected status pages never show a banner. 4. If your site sends a Content Security Policy, allow `https://api.hyperping.io` in `script-src` and `connect-src`. The banner's styles sit in a `